Home > Comparison > Technology > GRMN vs SANM
The strategic rivalry between Garmin Ltd. and Sanmina Corporation shapes the Hardware, Equipment & Parts sector’s evolution. Garmin excels as a diversified innovator in wireless devices and avionics, while Sanmina operates as a capital-intensive contract manufacturer serving multiple industries. This head-to-head pits product differentiation against manufacturing scale. This analysis will clarify which company’s trajectory offers superior risk-adjusted returns for a balanced portfolio in today’s competitive technology landscape.
Table of contents
Companies Overview
Garmin Ltd. and Sanmina Corporation both hold significant roles in the hardware and equipment sector, shaping technology markets globally.
Garmin Ltd.: Precision Navigation and Wearables Leader
Garmin Ltd. dominates as a global designer and manufacturer of wireless devices, focusing on fitness, outdoor, aviation, marine, and automotive segments. Its core revenue engine combines hardware sales with software platforms like Garmin Connect. In 2026, Garmin emphasizes expanding its wearable technology ecosystem and integrated avionics to sustain competitive advantage.
Sanmina Corporation: Integrated Manufacturing Powerhouse
Sanmina Corporation excels as a leading provider of manufacturing solutions and components for diverse industries including industrial, medical, aerospace, and communications. Its revenue stems from contract manufacturing, product design, and logistics services. The company’s 2026 strategy focuses on enhancing production capabilities and cloud-based manufacturing execution software to meet evolving OEM demands.
Strategic Collision: Similarities & Divergences
Garmin’s product-focused innovation contrasts with Sanmina’s service-driven manufacturing model. Both compete indirectly in the hardware value chain, with Garmin targeting end consumers and Sanmina serving original equipment manufacturers. Their primary battleground lies in technological integration versus scalable production. This creates distinctly different investment profiles: Garmin offers a consumer tech growth story, while Sanmina provides industrial tech exposure.
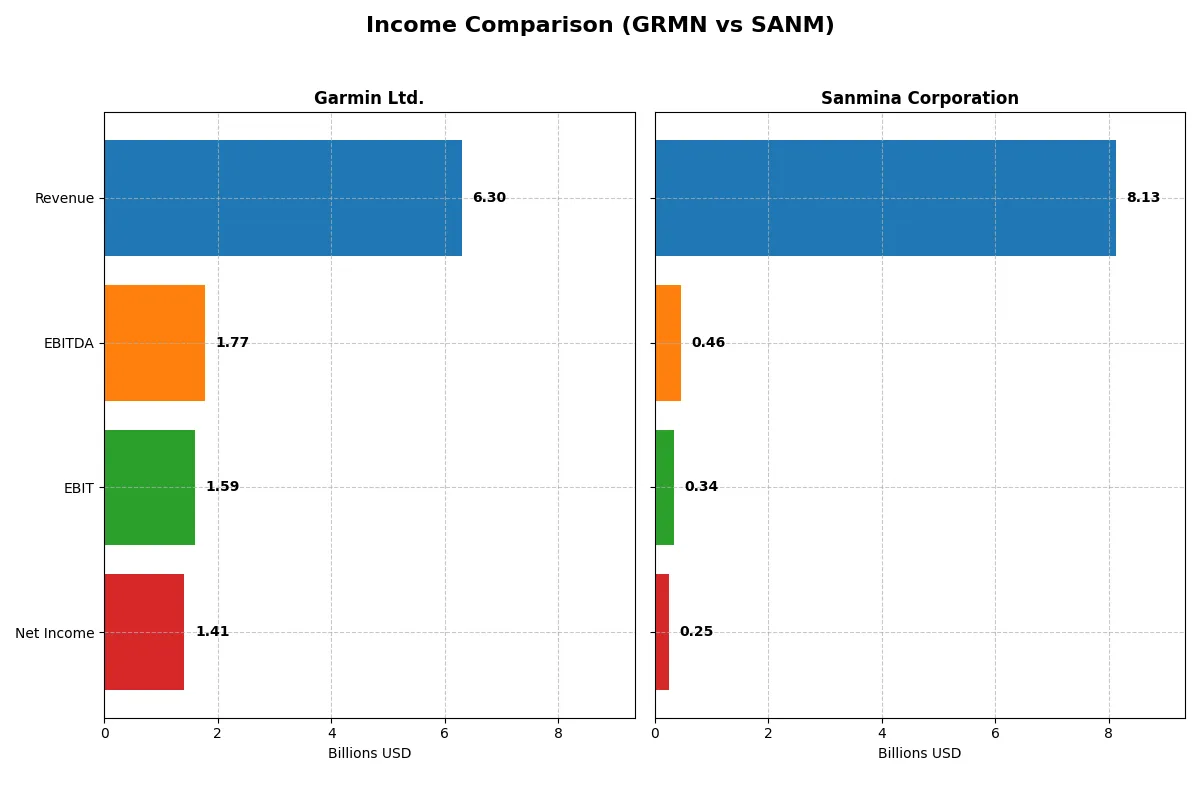
Income Statement Comparison
This data dissects the core profitability and scalability of both corporate engines to reveal who dominates the bottom line:
| Metric | Garmin Ltd. (GRMN) | Sanmina Corporation (SANM) |
|---|---|---|
| Revenue | 6.3B | 8.1B |
| Cost of Revenue | 2.6B | 7.4B |
| Operating Expenses | 2.1B | 362M |
| Gross Profit | 3.7B | 716M |
| EBITDA | 1.8B | 463M |
| EBIT | 1.6B | 344M |
| Interest Expense | 0 | 4.3M |
| Net Income | 1.4B | 246M |
| EPS | 7.35 | 4.56 |
| Fiscal Year | 2024 | 2025 |
Income Statement Analysis: The Bottom-Line Duel
This income statement comparison exposes which company runs a more efficient and profitable corporate engine through recent financial performance.
Garmin Ltd. Analysis
Garmin’s revenue surged 20% in 2024 to $6.3B, driving net income to $1.41B, up 9% year-over-year. Gross margin holds strong at 58.7%, with net margin at a healthy 22.4%. Operating efficiency accelerated sharply in 2024, with EBIT growing nearly 46%, signaling robust momentum and disciplined cost control.
Sanmina Corporation Analysis
Sanmina’s 2025 revenue grew moderately by 7.4% to $8.1B, but net income rose only 10.5% to $246M, reflecting thin margins—gross margin at 8.8%, net margin just 3%. EBIT slipped slightly despite revenue gains, showing pressure on operating efficiency amid higher costs and modest profitability improvement.
Margin Leadership vs. Scale Struggles
Garmin clearly outperforms Sanmina on profitability and margin expansion, delivering superior returns on revenue with a 22.4% net margin versus Sanmina’s 3%. Garmin’s strong margin profile and faster EBIT growth mark it as the fundamentally stronger operator. Investors seeking robust profitability and efficient growth will find Garmin’s profile more compelling.
Financial Ratios Comparison
These vital ratios act as a diagnostic tool to expose the underlying fiscal health, valuation premiums, and capital efficiency of Garmin Ltd. (GRMN) and Sanmina Corporation (SANM):
| Ratios | Garmin Ltd. (GRMN) | Sanmina Corporation (SANM) |
|---|---|---|
| ROE | 18.0% | 10.4% |
| ROIC | 16.3% | 9.0% |
| P/E | 28.5 | 25.6 |
| P/B | 5.13 | 2.67 |
| Current Ratio | 3.54 | 1.72 |
| Quick Ratio | 2.56 | 1.02 |
| D/E | 0.02 | 0.17 |
| Debt-to-Assets | 1.69% | 6.73% |
| Interest Coverage | N/A | 82.5 |
| Asset Turnover | 0.65 | 1.39 |
| Fixed Asset Turnover | 4.49 | 11.91 |
| Payout Ratio | 40.6% | 0% |
| Dividend Yield | 1.42% | 0% |
| Fiscal Year | 2024 | 2025 |
Efficiency & Valuation Duel: The Vital Signs
Financial ratios act as a company’s DNA, exposing hidden risks and operational strengths that shape investor confidence and valuation accuracy.
Garmin Ltd.
Garmin posts a strong 18% ROE and a robust 22.4% net margin, signaling operational excellence. However, its 28.5 P/E ratio and 5.13 P/B ratio suggest the stock trades at a premium. Garmin balances this with a 1.42% dividend yield, rewarding shareholders while funding significant R&D to sustain growth.
Sanmina Corporation
Sanmina delivers a moderate 10.5% ROE and a slim 3.03% net margin, indicating weaker profitability. Its 25.6 P/E is slightly more reasonable, and a 2.67 P/B ratio sits near industry norms. The company offers no dividend, instead reinvesting heavily in operations to improve margins and asset utilization, reflected in its high asset turnover ratios.
Premium Valuation vs. Operational Safety
Garmin’s superior profitability justifies its premium multiples, though elevated valuations pose valuation risk. Sanmina’s lower profitability and absence of dividends increase risk despite attractive asset efficiency. Investors seeking stable returns may prefer Garmin, while those favoring operational leverage might consider Sanmina’s growth potential.
Which one offers the Superior Shareholder Reward?
I observe Garmin Ltd. (GRMN) balances dividends and buybacks, yielding 1.4% with a 40.6% payout ratio and robust share repurchases. Sanmina Corporation (SANM) pays no dividends, focusing on reinvestment and moderate buybacks. Garmin’s model delivers sustainable income plus capital return. I favor Garmin Ltd. for superior total shareholder reward in 2026.
Comparative Score Analysis: The Strategic Profile
The radar chart reveals the fundamental DNA and trade-offs of Garmin Ltd. and Sanmina Corporation, highlighting their core financial strengths and vulnerabilities:
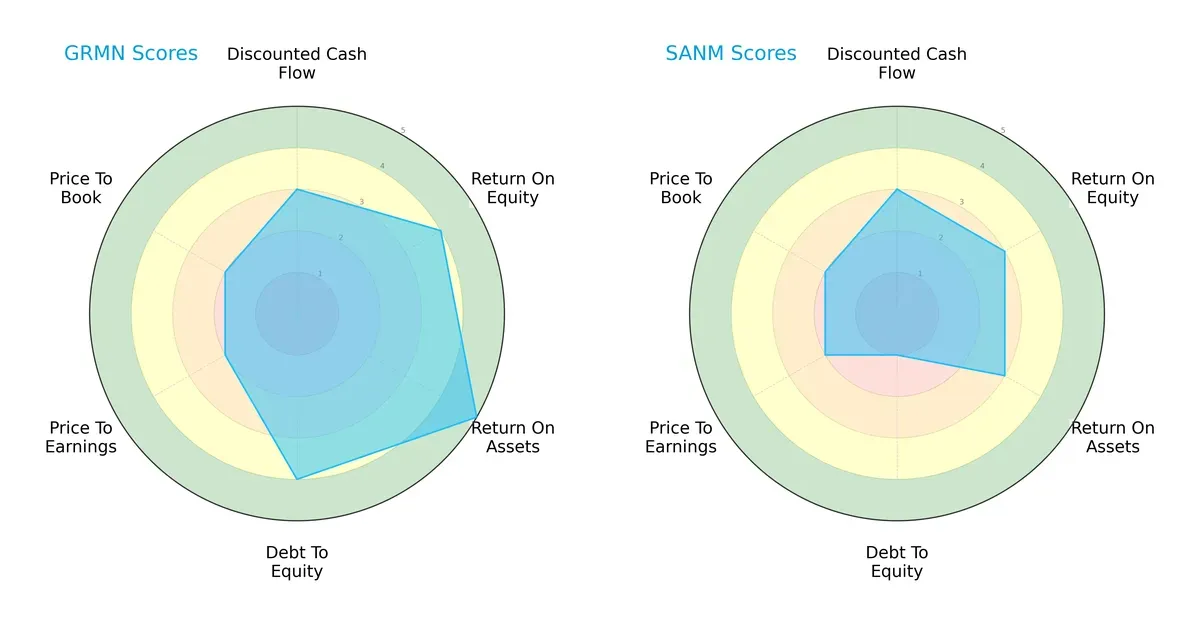
Garmin Ltd. boasts a more balanced profile with strong ROE (4) and ROA (5) scores, and a solid debt-to-equity rating (4), signaling efficient profitability and prudent leverage. Sanmina leans on moderate DCF and profitability metrics but suffers from a very unfavorable debt-to-equity score (1), increasing financial risk. Garmin’s moderate valuation scores indicate potential undervaluation, whereas Sanmina’s valuation metrics are average, reflecting less compelling price attractiveness.
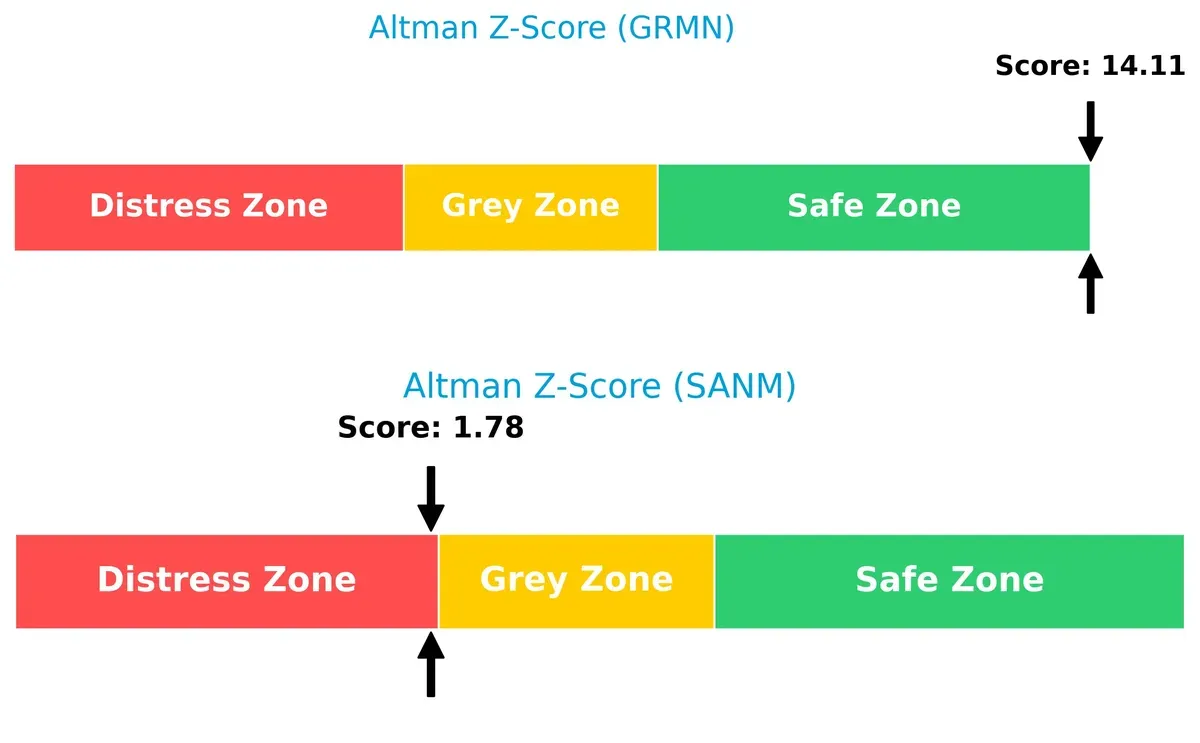
Bankruptcy Risk: Solvency Showdown
Garmin’s Altman Z-Score of 14.1 places it securely in the safe zone, while Sanmina’s 1.78 lands in the distress zone, signaling a material risk of bankruptcy in the current cycle:
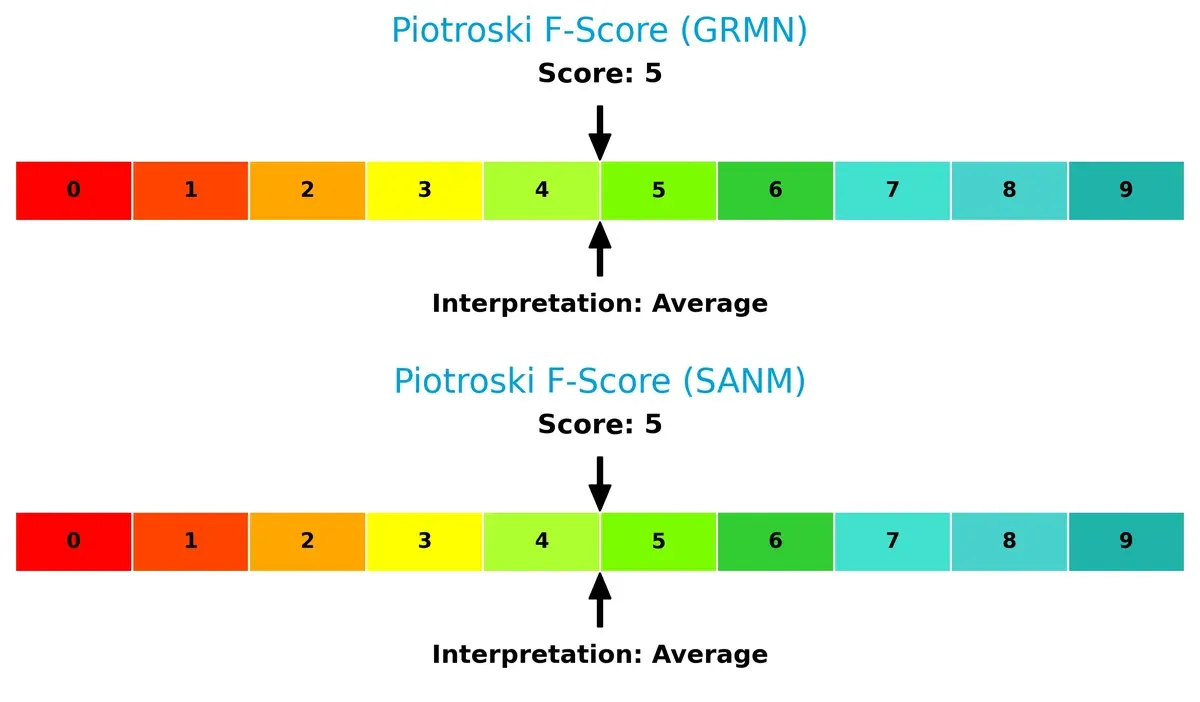
Financial Health: Quality of Operations
Both companies share an average Piotroski F-Score of 5, indicating moderate financial health but no clear leader in operational robustness or red flags at this level:
How are the two companies positioned?
This section dissects Garmin and Sanmina’s operational DNA by comparing their revenue distribution and internal strengths and weaknesses. The goal is to confront their economic moats and identify which model delivers the most resilient competitive advantage today.
Revenue Segmentation: The Strategic Mix
The following visual comparison dissects how Garmin Ltd. and Sanmina Corporation diversify their income streams and where their primary sector bets lie:
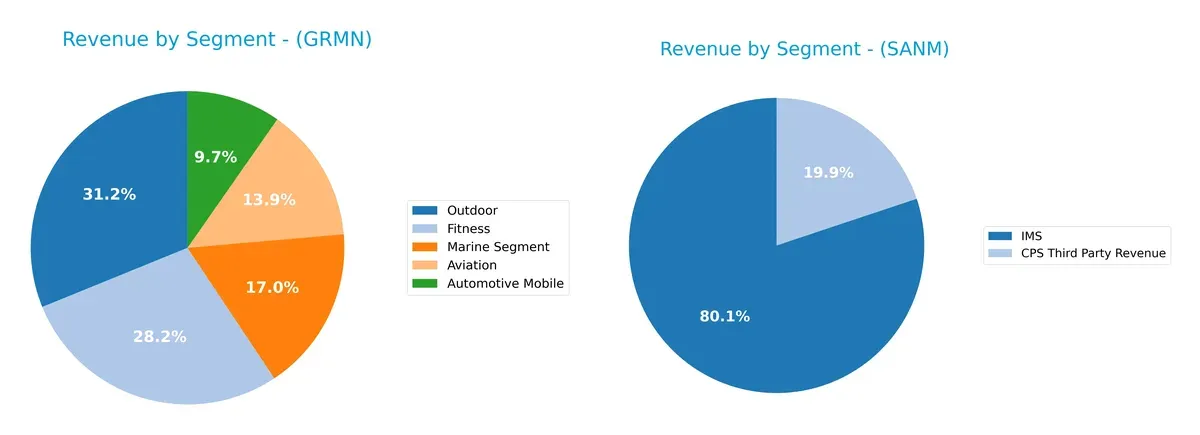
Garmin Ltd. shows a well-balanced revenue mix, with Outdoor leading at $1.96B and Fitness close behind at $1.77B in 2024. Sanmina, however, pivots heavily on its IMS segment, which dwarfs CPS Third Party Revenue at $6.5B versus $1.6B. Garmin’s diversified portfolio reduces concentration risk, while Sanmina’s dominance in IMS signals strong infrastructure lock-in but exposes it to segment-specific downturns.
Strengths and Weaknesses Comparison
This table compares the Strengths and Weaknesses of Garmin Ltd. and Sanmina Corporation:
Garmin Ltd. Strengths
- Strong profitability with 22.41% net margin and 17.98% ROE
- Excellent capital efficiency: 16.28% ROIC above 8.55% WACC
- Very low debt levels and high interest coverage
- Diversified product segments including Fitness and Outdoor
- Solid global presence with balanced Americas, EMEA, Asia Pacific revenues
Sanmina Corporation Strengths
- Favorable asset turnover at 1.39 and very strong fixed asset turnover of 11.91
- Financial leverage managed well with favorable debt ratios
- Broader global footprint with higher revenues in Americas and Asia Pacific
- Diversified revenue streams across IMS and CPS Third Party
- Maintains favorable interest coverage and current liquidity ratios
Garmin Ltd. Weaknesses
- Unfavorable price multiples: high PE at 28.5 and PB at 5.13
- Current ratio unusually high at 3.54, may indicate inefficient asset use
- Neutral asset turnover suggests room for operational improvement
- Slightly lower market share concentration outside Fitness and Outdoor
Sanmina Corporation Weaknesses
- Low profitability with 3.03% net margin and neutral ROE at 10.45%
- No dividend yield, limiting income appeal
- PE ratio still unfavorable at 25.59
- Slightly higher debt to assets ratio at 6.73%
- Neutral ROIC close to WACC indicates weaker capital returns
Both companies show diversified revenue bases and global operations but differ in profitability and capital efficiency. Garmin excels in margins and conservative leverage, while Sanmina benefits from strong asset use and broader geographic scale but struggles with profitability and dividend payouts. These contrasts shape their strategic focuses on operational efficiency versus growth and income generation.
The Moat Duel: Analyzing Competitive Defensibility
A structural moat is the sole protector of long-term profits against relentless competitive erosion. Here’s how Garmin Ltd. and Sanmina Corporation defend their turf:
Garmin Ltd.: Intangible Assets Moat
Garmin’s competitive advantage stems from its strong brand and proprietary technology. This shows in a high 25% EBIT margin and stable ROIC above WACC. New wearable and aviation products could deepen its moat in 2026.
Sanmina Corporation: Cost Advantage Moat
Sanmina relies on scale and integrated manufacturing solutions, unlike Garmin’s brand moat. However, its razor-thin 4.2% EBIT margin and declining ROIC signal weaker defensibility. Growth in cloud solutions may offer some upside.
Moat Battle: Brand Strength vs. Manufacturing Scale
Garmin’s wider moat shines through superior profitability and stable value creation. Sanmina’s cost advantage faces pressure from margin compression and declining capital efficiency. Garmin stands better poised to defend market share in 2026.
Which stock offers better returns?
Garmin Ltd. and Sanmina Corporation have shown distinct price dynamics over the past year, with Garmin accelerating its bullish momentum while Sanmina experiences a slowing uptrend.
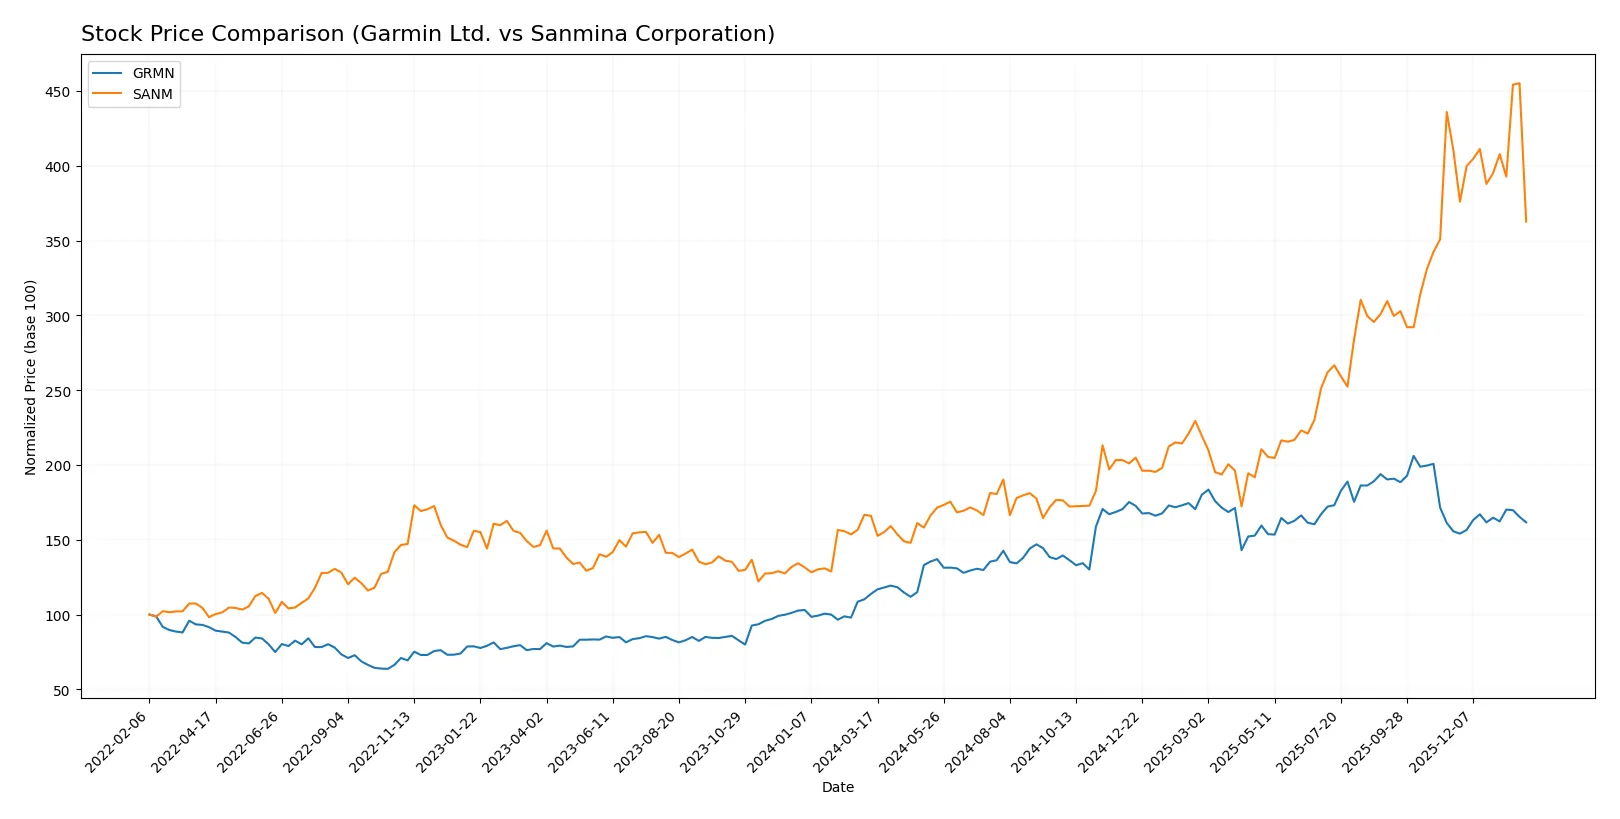
Trend Comparison
Garmin Ltd. stock rose 42.06% over the past 12 months, signaling a strong bullish trend with accelerating momentum from a low of 139.52 to a high of 257.06. Recent months show a moderate 3.87% gain with reduced volatility.
Sanmina Corporation surged 118.44% in the same period, marking a robust bullish trend despite deceleration. It swung between 57.79 and 177.83, but recently declined 11.65%, indicating short-term weakness and higher volatility.
Sanmina outperformed Garmin over the year, delivering the highest total return despite recent price softness, while Garmin maintained steadier gains with accelerating momentum.
Target Prices
Analysts present a cautiously optimistic consensus for Garmin Ltd. and Sanmina Corporation.
| Company | Target Low | Target High | Consensus |
|---|---|---|---|
| Garmin Ltd. | 193 | 310 | 240 |
| Sanmina Corporation | 200 | 200 | 200 |
Garmin’s consensus target of 240 implies roughly 19% upside from its 2026 price of 202. Sanmina’s target at 200 suggests a 41% potential rise from 142, reflecting stronger growth expectations.

Don’t Let Luck Decide Your Entry Point
Optimize your entry points with our advanced ProRealTime indicators. You’ll get efficient buy signals with precise price targets for maximum performance. Start outperforming now!
How do institutions grade them?
The following tables summarize recent institutional grades for Garmin Ltd. and Sanmina Corporation:
Garmin Ltd. Grades
Below are recent grade updates from major financial institutions for Garmin Ltd.:
| Grading Company | Action | New Grade | Date |
|---|---|---|---|
| Barclays | Upgrade | Equal Weight | 2026-01-16 |
| Tigress Financial | Maintain | Strong Buy | 2025-12-19 |
| Longbow Research | Upgrade | Buy | 2025-12-03 |
| Morgan Stanley | Maintain | Underweight | 2025-10-30 |
| Barclays | Maintain | Underweight | 2025-10-30 |
| Tigress Financial | Maintain | Strong Buy | 2025-09-30 |
| Morgan Stanley | Maintain | Underweight | 2025-09-19 |
| Morgan Stanley | Maintain | Underweight | 2025-07-31 |
| Barclays | Maintain | Underweight | 2025-07-31 |
| JP Morgan | Maintain | Neutral | 2025-07-17 |
Sanmina Corporation Grades
Below are recent grade updates from major financial institutions for Sanmina Corporation:
| Grading Company | Action | New Grade | Date |
|---|---|---|---|
| Argus Research | Maintain | Buy | 2026-01-28 |
| B of A Securities | Maintain | Neutral | 2025-07-11 |
| B of A Securities | Maintain | Neutral | 2025-06-09 |
| B of A Securities | Upgrade | Neutral | 2025-01-29 |
| Craig-Hallum | Maintain | Hold | 2024-11-05 |
| Craig-Hallum | Downgrade | Hold | 2024-04-30 |
| Sidoti & Co. | Upgrade | Buy | 2022-11-08 |
| Sidoti & Co. | Upgrade | Buy | 2022-11-07 |
| Sidoti & Co. | Downgrade | Neutral | 2022-10-31 |
| Sidoti & Co. | Downgrade | Neutral | 2022-10-30 |
Which company has the best grades?
Garmin Ltd. shows a mix of strong buy and underweight ratings, indicating divergent views. Sanmina Corporation consistently holds buy or neutral grades with fewer downgrades. Investors may interpret Garmin’s varied grades as higher uncertainty compared to Sanmina’s steadier outlook.
Risks specific to each company
In the volatile 2026 market environment, these categories highlight critical pressure points and systemic threats facing Garmin Ltd. and Sanmina Corporation:
1. Market & Competition
Garmin Ltd.
- Faces intense competition in consumer wearables and aviation tech with premium positioning but pricing pressure.
Sanmina Corporation
- Competes in highly commoditized EMS sector with thin margins and dependence on large OEM contracts.
2. Capital Structure & Debt
Garmin Ltd.
- Extremely low debt (D/E 0.02), strong interest coverage, signaling conservative leverage and financial stability.
Sanmina Corporation
- Higher leverage (D/E 0.17) and moderate debt-to-assets ratio increase financial risk despite adequate interest coverage.
3. Stock Volatility
Garmin Ltd.
- Beta near 1.0 implies average market volatility; stable trading range with moderate volume.
Sanmina Corporation
- Slightly higher beta (1.05) and recent sharp price drop (-8.3%) indicate elevated volatility and investor uncertainty.
4. Regulatory & Legal
Garmin Ltd.
- Exposure to aviation and marine regulations; compliance costs manageable with established global footprint.
Sanmina Corporation
- Operates in defense and aerospace sectors with complex regulatory oversight; legal risks from contract disputes possible.
5. Supply Chain & Operations
Garmin Ltd.
- Global supply chain for components; risks include semiconductor shortages but benefits from vertical integration.
Sanmina Corporation
- Highly sensitive to supply chain disruptions due to contract manufacturing model; logistics complexity is a key risk.
6. ESG & Climate Transition
Garmin Ltd.
- Moderate ESG focus with growing pressure on sustainability in tech manufacturing and product lifecycle.
Sanmina Corporation
- ESG risk elevated by complex global manufacturing footprint and regulatory scrutiny on environmental impact.
7. Geopolitical Exposure
Garmin Ltd.
- Swiss-based with diversified global sales reduces geopolitical risk but sensitive to trade tensions.
Sanmina Corporation
- US-based with significant international operations; geopolitical tensions could disrupt supply chains and contracts.
Which company shows a better risk-adjusted profile?
Garmin’s greatest risk lies in competitive pressure on premium pricing, while Sanmina faces critical financial leverage and operational risks. Garmin’s superior balance sheet and stable market position support a better risk-adjusted profile. Sanmina’s recent 8.3% stock decline highlights investor concern over debt and earnings volatility.
Final Verdict: Which stock to choose?
Garmin Ltd. (GRMN) stands out as a cash-generating powerhouse with a robust competitive edge rooted in consistent value creation and strong profitability. Its high liquidity signals operational resilience, yet the stretched valuation multiples warrant caution. GRMN suits investors seeking aggressive growth with a margin for premium pricing.
Sanmina Corporation (SANM) offers a strategic moat through efficient asset turnover and a lean balance sheet, supporting operational agility. While its profitability lags behind GRMN, SANM presents a safer profile with lower leverage and reasonable valuation. It fits well in a GARP portfolio aiming for growth tempered by financial discipline.
If you prioritize sustainable profitability and proven economic moats, Garmin outshines due to its superior ROIC and stable cash flows. However, if you seek exposure to potentially undervalued growth with less financial risk, Sanmina offers better stability and operational efficiency despite its weaker profitability. Each represents a distinct analytical scenario tailored to specific investor strategies.
Disclaimer: Investment carries a risk of loss of initial capital. The past performance is not a reliable indicator of future results. Be sure to understand risks before making an investment decision.
Go Further
I encourage you to read the complete analyses of Garmin Ltd. and Sanmina Corporation to enhance your investment decisions: