Home > Comparison > Technology > SNDK vs GRMN
The strategic rivalry between Sandisk Corporation and Garmin Ltd. shapes the evolution of the technology hardware sector. Sandisk operates as a capital-intensive storage device manufacturer focused on NAND flash technology. Garmin, by contrast, excels as a diversified wireless device innovator across fitness, outdoor, aviation, marine, and automotive markets. This head-to-head pits specialized hardware prowess against multi-segment innovation. This analysis will reveal which trajectory offers the superior risk-adjusted return for a balanced portfolio.
Table of contents
Companies Overview
SanDisk Corporation and Garmin Ltd. both shape the hardware landscape but target distinct niches with their tech innovations.
Sandisk Corporation: Leader in Flash Storage Solutions
Sandisk dominates the NAND flash storage industry, generating revenue mainly from solid-state drives and removable memory products. Its core strength lies in cutting-edge storage technology. In 2026, Sandisk focuses strategically on expanding embedded storage solutions, capturing growing demand in mobile and IoT devices.
Garmin Ltd.: Diverse Wireless Device Innovator
Garmin commands the market for wireless devices across fitness, outdoor, aviation, marine, and automotive sectors. It earns through a broad product portfolio including smartwatches, avionics, and navigation systems. In 2026, Garmin emphasizes integrated software platforms and wearable tech to deepen customer engagement and enhance connectivity.
Strategic Collision: Similarities & Divergences
Both companies thrive in hardware but diverge sharply in approach. Sandisk prioritizes specialized memory technologies within hardware components. Garmin pursues a holistic ecosystem blending hardware with software platforms. Their primary battleground lies in device connectivity and consumer adoption, with Sandisk focusing on embedded solutions and Garmin on multi-segment device integration. These distinct models reflect different risk profiles and growth trajectories.
Income Statement Comparison
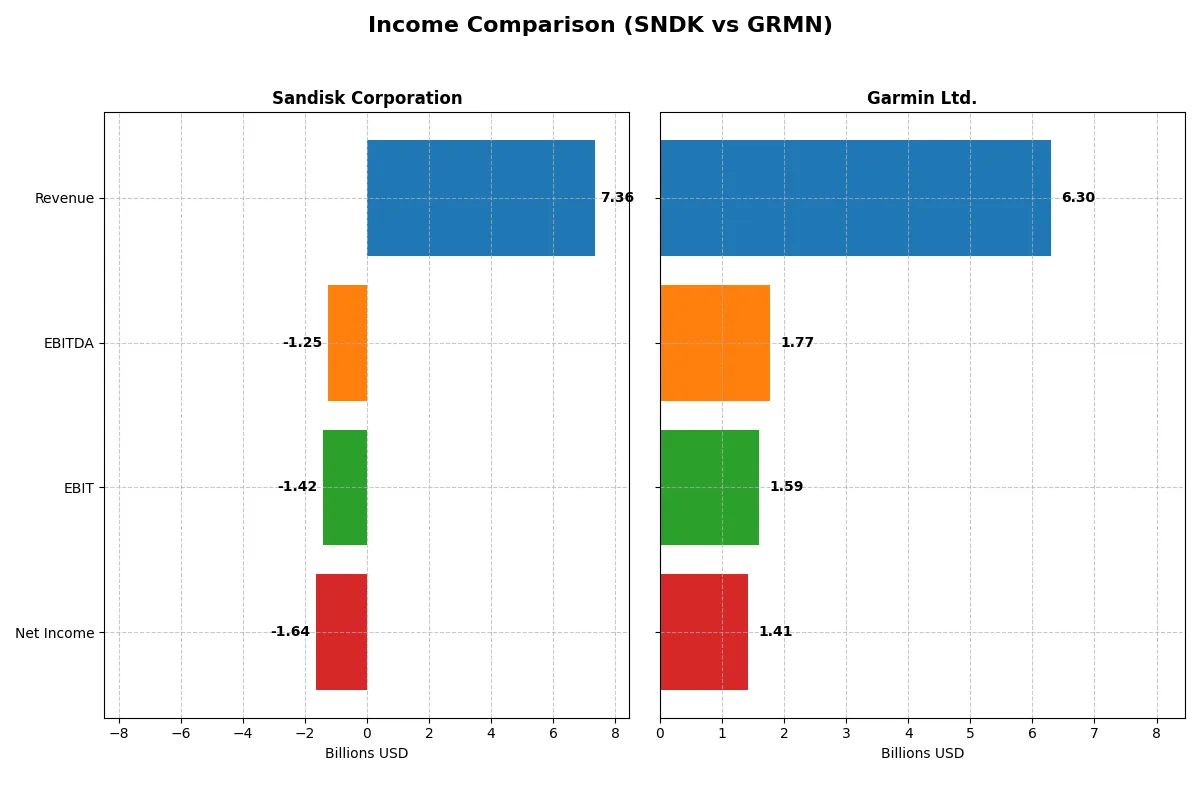
This data dissects the core profitability and scalability of both corporate engines to reveal who dominates the bottom line:
| Metric | Sandisk Corporation (SNDK) | Garmin Ltd. (GRMN) |
|---|---|---|
| Revenue | 7.36B | 6.30B |
| Cost of Revenue | 5.14B | 2.60B |
| Operating Expenses | 3.59B | 2.10B |
| Gross Profit | 2.21B | 3.70B |
| EBITDA | -1.25B | 1.77B |
| EBIT | -1.42B | 1.59B |
| Interest Expense | 63M | 0 |
| Net Income | -1.64B | 1.41B |
| EPS | -11.32 | 7.35 |
| Fiscal Year | 2025 | 2024 |
Income Statement Analysis: The Bottom-Line Duel
This income statement comparison reveals how efficiently Sandisk Corporation and Garmin Ltd. convert revenue into profit and sustain margin strength over time.
Sandisk Corporation Analysis
Sandisk’s revenue declined by 25% from 2022 to 2025 but showed a 10% rebound in the latest year to $7.36B. Despite gross margin expanding to 30%, the company reported a net loss of $1.64B in 2025, reflecting deteriorating net margins near -22%. Rising operating expenses eroded profitability, signaling weakening operational efficiency.
Garmin Ltd. Analysis
Garmin steadily grew revenue by 50% over five years, reaching $6.30B in 2024. Its gross margin held strong at nearly 59%, and net income surged 42% to $1.41B. Operating leverage improved, with EBIT margin at 25%, demonstrating robust cost control and earnings momentum despite a slight dip in net margin growth.
Margin Resilience vs. Revenue Decline
Garmin clearly outperforms Sandisk, posting consistent revenue growth and superior margin expansion across the period. Sandisk’s sharp net losses and eroding margins contrast with Garmin’s profitability and operational strength. Investors seeking stable earnings and margin resilience will find Garmin’s profile more compelling than Sandisk’s challenged turnaround.
Financial Ratios Comparison
These vital ratios act as a diagnostic tool to expose the underlying fiscal health, valuation premiums, and capital efficiency for the companies compared below:
| Ratios | Sandisk Corporation (SNDK) | Garmin Ltd. (GRMN) |
|---|---|---|
| ROE | -17.8% (2025) | 17.98% (2024) |
| ROIC | -11.9% (2025) | 16.3% (2024) |
| P/E | -4.17 (2025) | 28.5 (2024) |
| P/B | 0.74 (2025) | 5.13 (2024) |
| Current Ratio | 3.56 (2025) | 3.54 (2024) |
| Quick Ratio | 2.11 (2025) | 2.56 (2024) |
| D/E | 0.22 (2025) | 0.02 (2024) |
| Debt-to-Assets | 15.7% (2025) | 1.7% (2024) |
| Interest Coverage | -21.9 (2025) | 0 (2024) |
| Asset Turnover | 0.57 (2025) | 0.65 (2024) |
| Fixed Asset Turnover | 11.88 (2025) | 4.49 (2024) |
| Payout ratio | 0% (2025) | 40.6% (2024) |
| Dividend yield | 0% (2025) | 1.42% (2024) |
| Fiscal Year | 2025 | 2024 |
Efficiency & Valuation Duel: The Vital Signs
Financial ratios act as a company’s DNA, revealing hidden risks and operational excellence essential to investor decision-making.
Sandisk Corporation
Sandisk displays deeply negative profitability with ROE at -17.8% and net margin at -22.3%, signaling operational struggles. Its P/E and P/B ratios appear favorable, suggesting an undervalued stock. The company pays no dividend, reinvesting heavily in R&D to fuel growth despite a stretched cash conversion cycle and mixed liquidity metrics.
Garmin Ltd.
Garmin boasts strong profitability, with a 17.98% ROE and 22.4% net margin, reflecting efficient operations. However, its valuation is stretched, showing a high P/E of 28.5 and P/B of 5.13. Garmin sustains shareholder returns with a 1.42% dividend yield and maintains solid balance sheet health, supporting stable cash flow generation.
Premium Valuation vs. Operational Safety
Garmin offers a balanced profile with robust profitability and reliable shareholder returns, despite a premium valuation. Sandisk is cheaper but carries significant profitability and liquidity risks. Investors prioritizing growth and operational strength may prefer Garmin, while those seeking value might scrutinize Sandisk’s turnaround potential.
Which one offers the Superior Shareholder Reward?
I observe that Garmin Ltd. (GRMN) delivers superior shareholder reward compared to Sandisk Corporation (SNDK). Garmin pays a consistent dividend with yields around 1.4%-3.8% and maintains payout ratios near 40%-45%, supported by robust free cash flow coverage above 80%. Its buyback activity is less transparent but supported by strong operating cash flow of 7.5/share and free cash flow of 6.4/share in 2024. In contrast, Sandisk pays no dividends, suffers negative free cash flow (-0.8 to -3.3/share recently), and posts persistent losses. Sandisk’s buyback potential is constrained by weak profitability and negative earnings. Garmin’s disciplined dividend policy combined with sustainable free cash flow and moderate leverage offers a more attractive, balanced total return profile in 2026.
Comparative Score Analysis: The Strategic Profile
The radar chart reveals the core financial DNA and trade-offs of Sandisk Corporation and Garmin Ltd., highlighting their distinct strategic strengths and weaknesses:
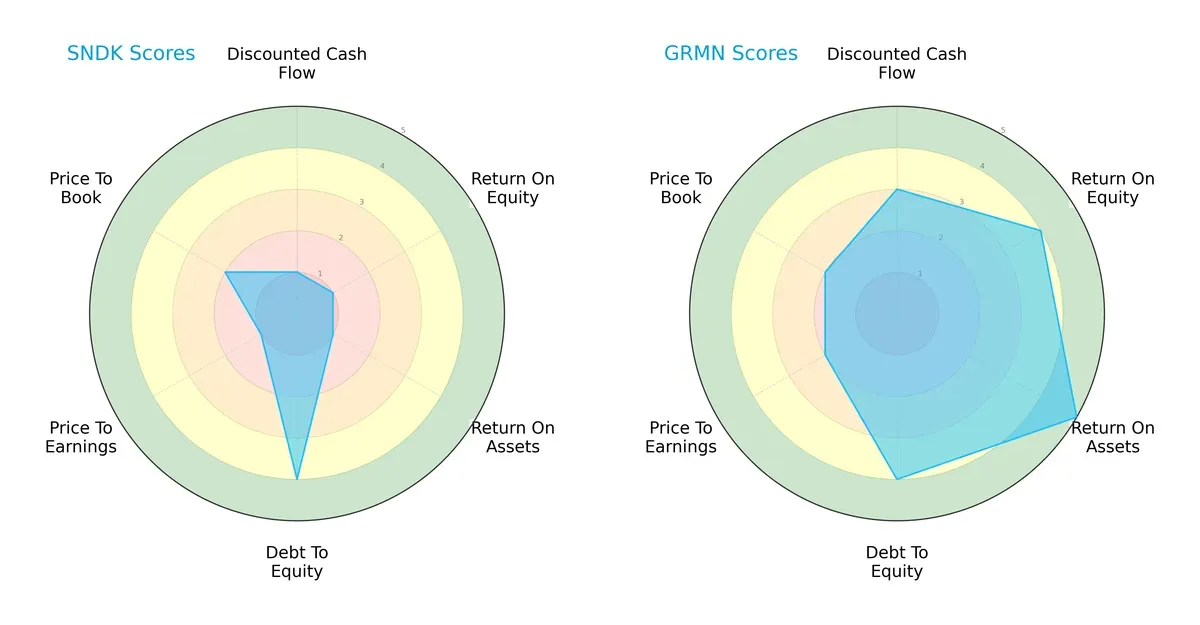
Garmin Ltd. outperforms Sandisk with a more balanced profile across DCF (3 vs. 1), ROE (4 vs. 1), and ROA (5 vs. 1), signaling superior profitability and asset efficiency. Both have strong debt-to-equity scores (4), but Sandisk trails with weaker valuation metrics (P/E 1 vs. 2, P/B 2 vs. 2). Garmin relies on consistent operational strength, while Sandisk leans on a conservative balance sheet but struggles on returns.
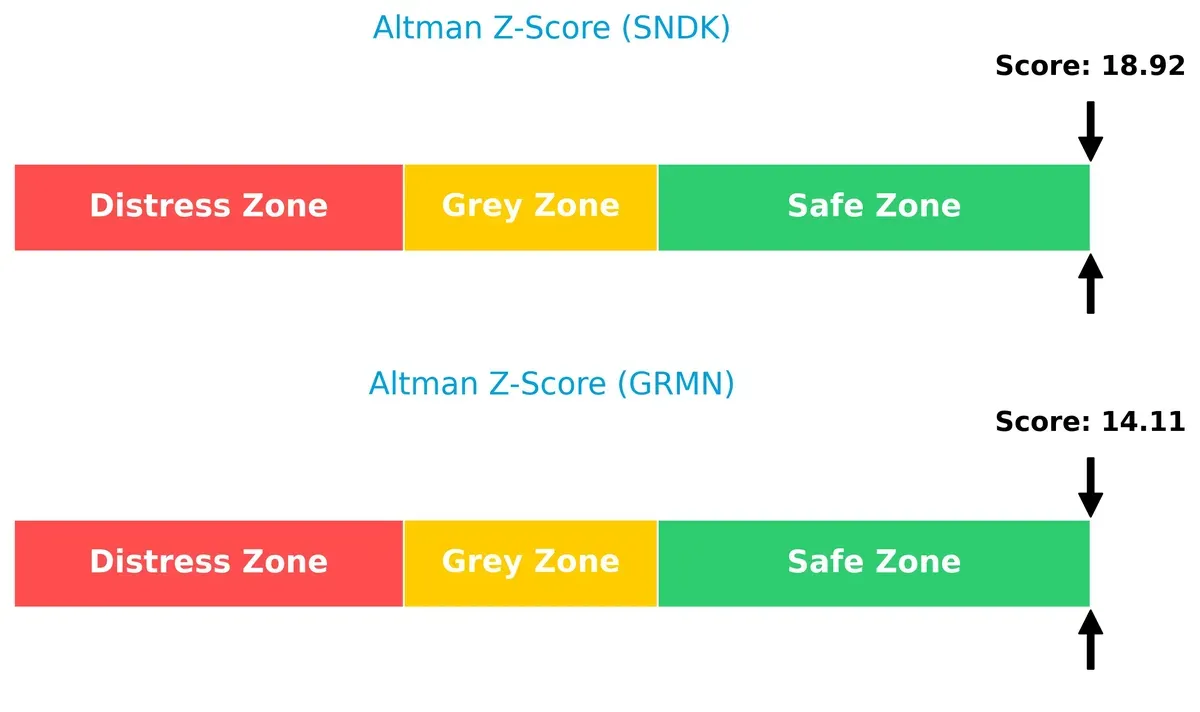
Bankruptcy Risk: Solvency Showdown
The Altman Z-Scores position both firms firmly in the safe zone, with Sandisk at 18.9 and Garmin at 14.1, indicating robust long-term solvency and low bankruptcy risk in this cycle:
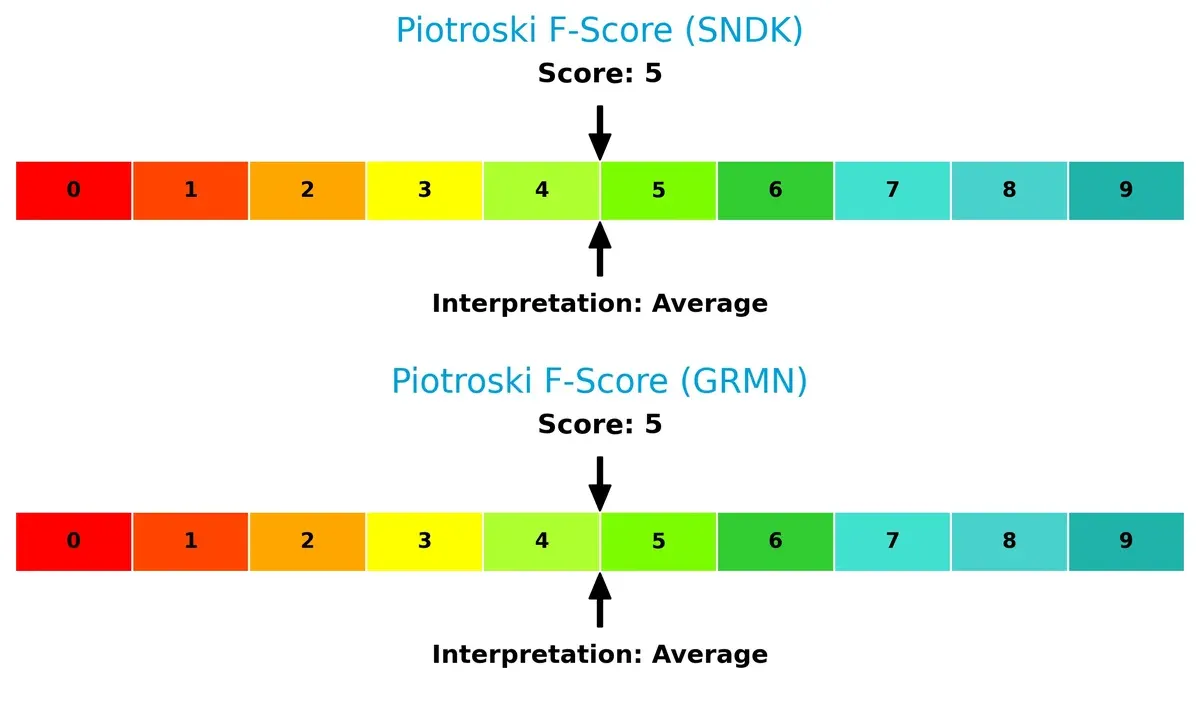
Financial Health: Quality of Operations
Both companies demonstrate average financial health with Piotroski F-Scores of 5 each, suggesting moderate operational quality but leaving room for improvement in internal metrics:
How are the two companies positioned?
This section dissects Sandisk and Garmin’s operational DNA through revenue segmentation and internal strengths and weaknesses. The goal is to confront their economic moats to reveal which model offers the most resilient, sustainable advantage today.
Revenue Segmentation: The Strategic Mix
This visual comparison dissects how Sandisk Corporation and Garmin Ltd. diversify their income streams and reveals where their primary sector bets lie:
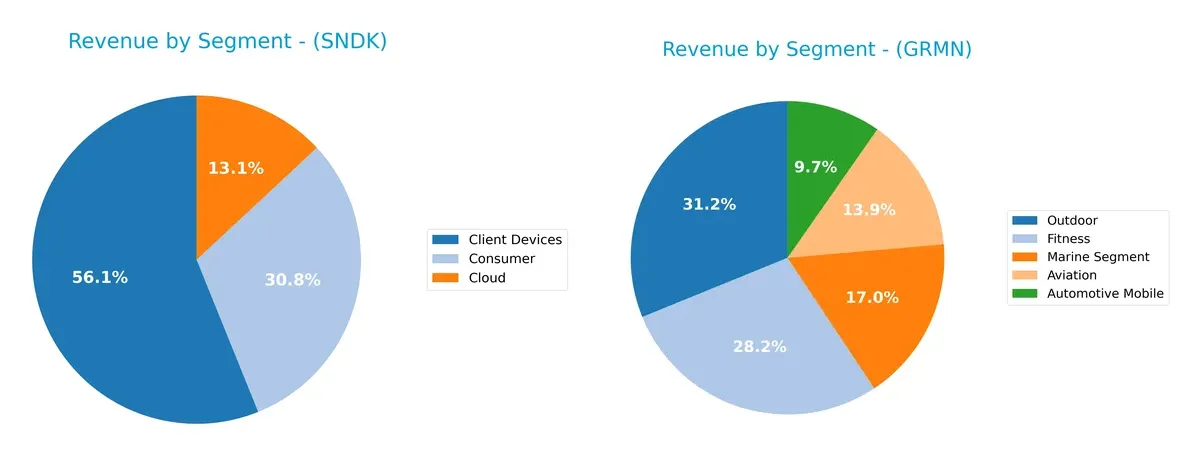
Sandisk’s revenue pivots mainly on Client Devices at $4.13B, anchoring its portfolio with Consumer at $2.27B and Cloud at $960M. Garmin displays a more diversified mix, with Outdoor leading at $1.96B and Fitness at $1.77B, plus significant contributions from Marine ($1.07B), Aviation ($877M), and Automotive Mobile ($611M). Garmin’s spread reduces concentration risk, while Sandisk’s focus on Client Devices signals dependence on a core ecosystem.
Strengths and Weaknesses Comparison
This table compares the Strengths and Weaknesses of Sandisk Corporation and Garmin Ltd.:
Sandisk Corporation Strengths
- Strong diversification across Client Devices, Cloud, and Consumer segments
- Solid quick ratio at 2.11 indicating good short-term liquidity
- Low debt-to-assets at 15.73% supporting financial stability
- High fixed asset turnover at 11.88 reflecting efficient asset use
Garmin Ltd. Strengths
- Robust profitability with net margin at 22.41% and ROE at 17.98%
- Favorable ROIC of 16.28% exceeding WACC at 8.55%
- Very low debt-to-assets at 1.69% with excellent interest coverage
- Diversified product segments including Automotive, Aviation, Fitness, Marine, Outdoor
- Wide global presence with large Americas and EMEA revenues
Sandisk Corporation Weaknesses
- Negative net margin (-22.31%) and ROE (-17.81%) signaling operational challenges
- High WACC at 26.32% raising capital costs
- Negative interest coverage ratio at -22.48 indicating financial stress
- Current ratio at 3.56 flagged unfavorable despite high quick ratio
- No dividend yield reducing shareholder income
Garmin Ltd. Weaknesses
- Elevated PE of 28.5 and PB of 5.13 suggesting high valuation risk
- Current ratio at 3.54 marked unfavorable despite strong quick ratio
- Dividend yield low at 1.42% classified neutral
- Moderate asset turnover at 0.65 limiting sales efficiency
Both companies show clear strengths aligned with their operational focus and financial health. Sandisk struggles with profitability and cost of capital, highlighting the need for operational improvements. Garmin demonstrates strong profitability and financial stability but faces valuation and liquidity concerns that may affect investor perception.
The Moat Duel: Analyzing Competitive Defensibility
A structural moat stands as the sole shield for long-term profits against relentless competition erosion:
Sandisk Corporation: Cost Advantage Under Pressure
Sandisk relies on cost advantage through NAND flash tech but shows declining ROIC and negative margins, signaling weakening profitability. New markets in 2026 may struggle to restore this moat.
Garmin Ltd.: Diversified Product Ecosystem
Garmin’s moat stems from its diversified product ecosystem and strong brand loyalty, reflected in high ROIC and stable margins. Its expansion into wearables and avionics bolsters resilience in 2026.
Cost Efficiency vs. Ecosystem Diversification
Garmin holds a wider and more durable moat than Sandisk, supported by consistent value creation and margin strength. Garmin stands better equipped to defend market share amid evolving tech demands.
Which stock offers better returns?
The past year saw Sandisk Corporation’s stock surge dramatically, while Garmin Ltd. posted steady gains with less volatility.
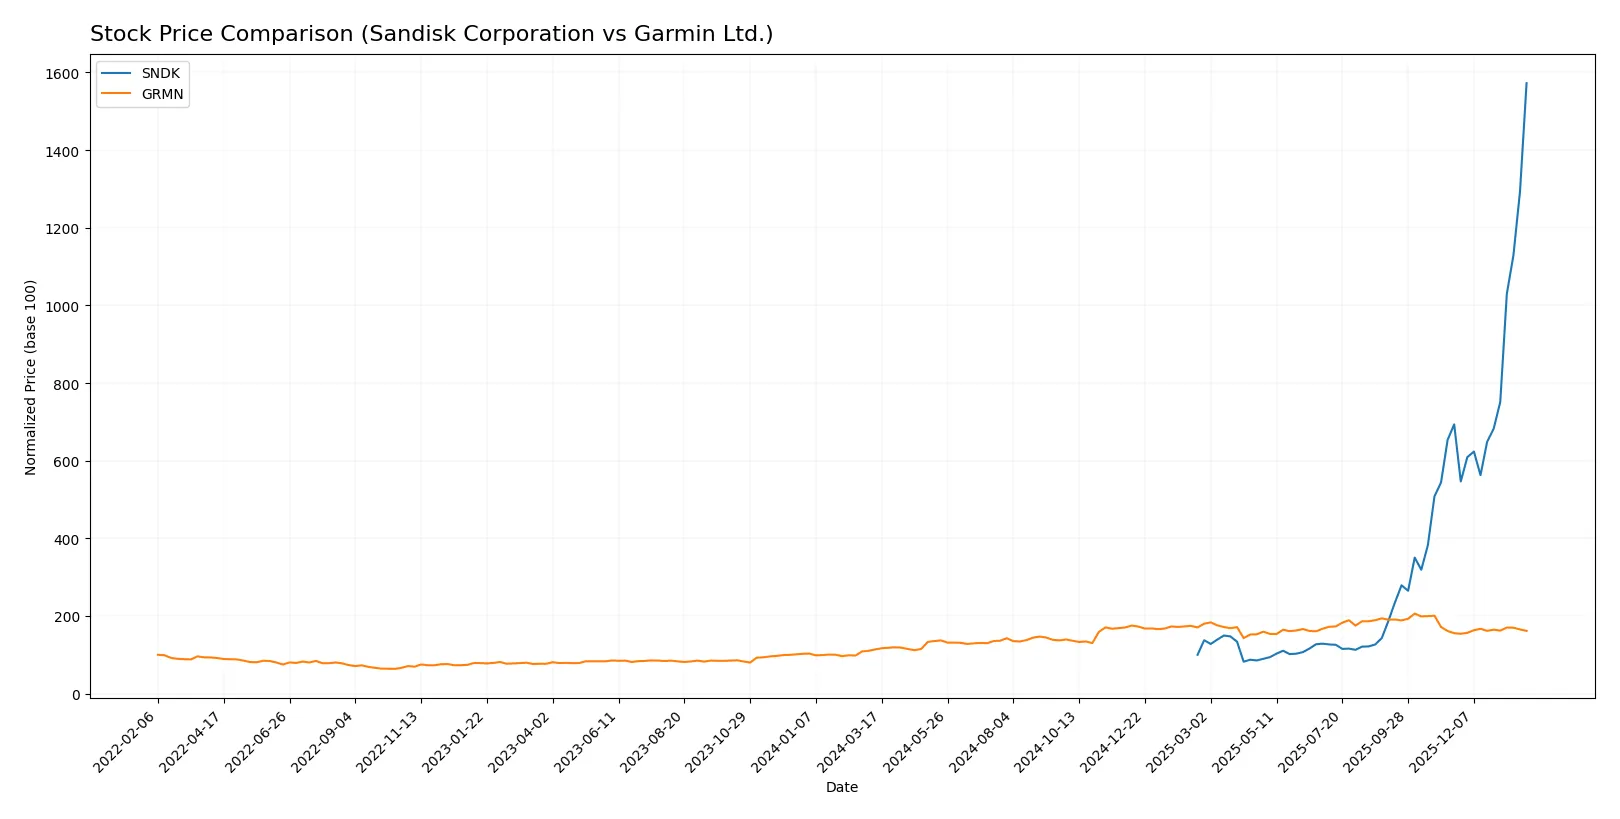
Trend Comparison
Sandisk Corporation’s stock rose 1472.31% over the past year, showing a strong bullish trend with accelerating momentum and a high volatility of 125.16. The price ranged between 30.11 and 576.25, highlighting significant market interest.
Garmin Ltd.’s stock increased 42.06% over the same period, maintaining a bullish trend with acceleration but lower volatility at 28.33. The price moved between 139.52 and 257.06, reflecting steadier growth.
Comparing both, Sandisk delivered the highest market performance with a vastly superior percentage gain and stronger acceleration relative to Garmin.
Target Prices
Analysts present a broad target price range for Sandisk Corporation and Garmin Ltd., reflecting diverse market outlooks.
| Company | Target Low | Target High | Consensus |
|---|---|---|---|
| Sandisk Corporation | 220 | 1000 | 615 |
| Garmin Ltd. | 193 | 310 | 240 |
The consensus target for Sandisk sits about 7% above its current 576 price, signaling moderate upside potential. Garmin’s consensus target of 240 offers a roughly 19% premium over its current 202 price, indicating stronger expected appreciation.

Don’t Let Luck Decide Your Entry Point
Optimize your entry points with our advanced ProRealTime indicators. You’ll get efficient buy signals with precise price targets for maximum performance. Start outperforming now!
How do institutions grade them?
Sandisk Corporation Grades
Here are the recent grades and recommendations from leading financial institutions for Sandisk Corporation:
| Grading Company | Action | New Grade | Date |
|---|---|---|---|
| Jefferies | Maintain | Buy | 2026-01-30 |
| RBC Capital | Maintain | Sector Perform | 2026-01-30 |
| Goldman Sachs | Maintain | Buy | 2026-01-30 |
| Morgan Stanley | Maintain | Overweight | 2026-01-30 |
| Cantor Fitzgerald | Maintain | Overweight | 2026-01-30 |
| Wedbush | Maintain | Outperform | 2026-01-30 |
| Citigroup | Maintain | Buy | 2026-01-20 |
| Wells Fargo | Maintain | Equal Weight | 2026-01-15 |
| Benchmark | Maintain | Buy | 2026-01-15 |
| Bernstein | Maintain | Outperform | 2026-01-14 |
Garmin Ltd. Grades
Below are the recent grades and recommendations from financial firms for Garmin Ltd.:
| Grading Company | Action | New Grade | Date |
|---|---|---|---|
| Barclays | Upgrade | Equal Weight | 2026-01-16 |
| Tigress Financial | Maintain | Strong Buy | 2025-12-19 |
| Longbow Research | Upgrade | Buy | 2025-12-03 |
| Morgan Stanley | Maintain | Underweight | 2025-10-30 |
| Barclays | Maintain | Underweight | 2025-10-30 |
| Tigress Financial | Maintain | Strong Buy | 2025-09-30 |
| Morgan Stanley | Maintain | Underweight | 2025-09-19 |
| Morgan Stanley | Maintain | Underweight | 2025-07-31 |
| Barclays | Maintain | Underweight | 2025-07-31 |
| JP Morgan | Maintain | Neutral | 2025-07-17 |
Which company has the best grades?
Sandisk Corporation consistently receives strong buy and outperform ratings from multiple top-tier firms. Garmin Ltd. shows mixed grades with some strong buys but also several underweight ratings. Investors might view Sandisk’s grades as a more confident institutional endorsement.
Risks specific to each company
The following categories highlight critical pressure points and systemic threats facing Sandisk Corporation and Garmin Ltd. in the complex 2026 market environment:
1. Market & Competition
Sandisk Corporation
- Faces intense competition in NAND flash storage with volatile pricing and rapid tech shifts.
Garmin Ltd.
- Competes in diversified segments but faces pressure from tech innovation and consumer trends.
2. Capital Structure & Debt
Sandisk Corporation
- Maintains low debt-to-equity (0.22) with moderate leverage, but interest coverage is negative, signaling risk.
Garmin Ltd.
- Very low debt-to-equity (0.02) and infinite interest coverage show strong balance sheet resilience.
3. Stock Volatility
Sandisk Corporation
- Exhibits extremely high beta (~4.89), implying significant price swings and investor risk.
Garmin Ltd.
- Beta near 1.01 indicates stable stock behavior aligned with the market average.
4. Regulatory & Legal
Sandisk Corporation
- US-based tech firm potentially exposed to tightening data storage and semiconductor regulations.
Garmin Ltd.
- Swiss multinational faces complex regulatory environments across aviation, marine, and wearable tech sectors.
5. Supply Chain & Operations
Sandisk Corporation
- Dependence on NAND flash supply chains vulnerable to semiconductor shortages and geopolitical disruptions.
Garmin Ltd.
- Diverse manufacturing and distribution help mitigate supply chain risks but complexity remains high.
6. ESG & Climate Transition
Sandisk Corporation
- Increasing pressure to reduce carbon footprint in semiconductor manufacturing processes.
Garmin Ltd.
- Faces ESG scrutiny across product lines; opportunities in sustainability-focused outdoor and fitness markets.
7. Geopolitical Exposure
Sandisk Corporation
- US-centric operations exposed to China-US tech tensions affecting supply and sales.
Garmin Ltd.
- Broad global footprint includes exposure to Europe, Asia, and Americas with varied geopolitical risks.
Which company shows a better risk-adjusted profile?
Garmin’s strongest risk is moderate valuation pressure with elevated P/E and P/B ratios. For Sandisk, negative profitability and interest coverage stand out as critical risks. Garmin’s stable capital structure and lower stock volatility create a superior risk-adjusted profile. Sandisk’s high beta and poor earnings amplify investor caution.
Final Verdict: Which stock to choose?
Sandisk Corporation’s superpower lies in its potential for rapid revenue growth and a robust cash conversion cycle, signaling operational agility. However, its persistent value destruction and negative profitability metrics remain a point of vigilance. It might suit portfolios aiming for high-risk, aggressive growth plays willing to weather volatility.
Garmin Ltd. commands a strategic moat through consistent value creation and stable profitability, underpinned by strong returns on invested capital and a solid balance sheet. Its defensive financial profile offers better stability compared to Sandisk. It appears well-aligned with GARP (Growth at a Reasonable Price) investors seeking steady growth with moderated risk.
If you prioritize aggressive growth and can absorb near-term profitability challenges, Sandisk might be the compelling choice due to its operational momentum and market rebound. However, if you seek sustainable value creation and financial resilience, Garmin outshines with superior stability and a proven competitive advantage, justifying its premium valuation.
Disclaimer: Investment carries a risk of loss of initial capital. The past performance is not a reliable indicator of future results. Be sure to understand risks before making an investment decision.
Go Further
I encourage you to read the complete analyses of Sandisk Corporation and Garmin Ltd. to enhance your investment decisions: