Garmin Ltd. and Novanta Inc. are two prominent players in the technology hardware sector, each excelling in specialized markets such as wireless devices and photonics components. Both companies leverage innovation to address diverse industrial and consumer needs, creating overlap in high-tech manufacturing and solutions. In this article, I will analyze their strengths and market positions to help you decide which company represents a more compelling investment opportunity in 2026.
Table of contents
Companies Overview
I will begin the comparison between Garmin and Novanta by providing an overview of these two companies and their main differences.
Garmin Overview
Garmin Ltd. is a Switzerland-based technology company that designs, develops, manufactures, and markets a broad range of wireless devices worldwide. Its product portfolio spans fitness, outdoor, aviation, marine, and automotive segments, offering specialized devices such as smartwatches, avionics, chartplotters, and navigation systems. Founded in 1989, Garmin operates across multiple regions and employs approximately 21,800 people, positioning itself as a diversified player in hardware and equipment.
Novanta Overview
Novanta Inc., headquartered in Bedford, Massachusetts, is a U.S.-based technology company focused on photonics, vision, and precision motion components for medical and industrial markets. The company provides laser-based solutions, medical devices, and precision motors under various brands. Founded in 1968 and employing around 3,000 staff, Novanta serves original equipment manufacturers globally, concentrating on specialized, high-technology hardware and subsystems.
Key similarities and differences
Both Garmin and Novanta operate within the technology sector, specializing in hardware, equipment, and parts, but they target different end markets. Garmin has a broad consumer and professional product range, including fitness, outdoor, and automotive devices, while Novanta focuses on high-precision photonics and motion components for medical and industrial applications. Garmin’s workforce is significantly larger, reflecting its diversified product portfolio compared to Novanta’s specialized technology offerings.
Income Statement Comparison
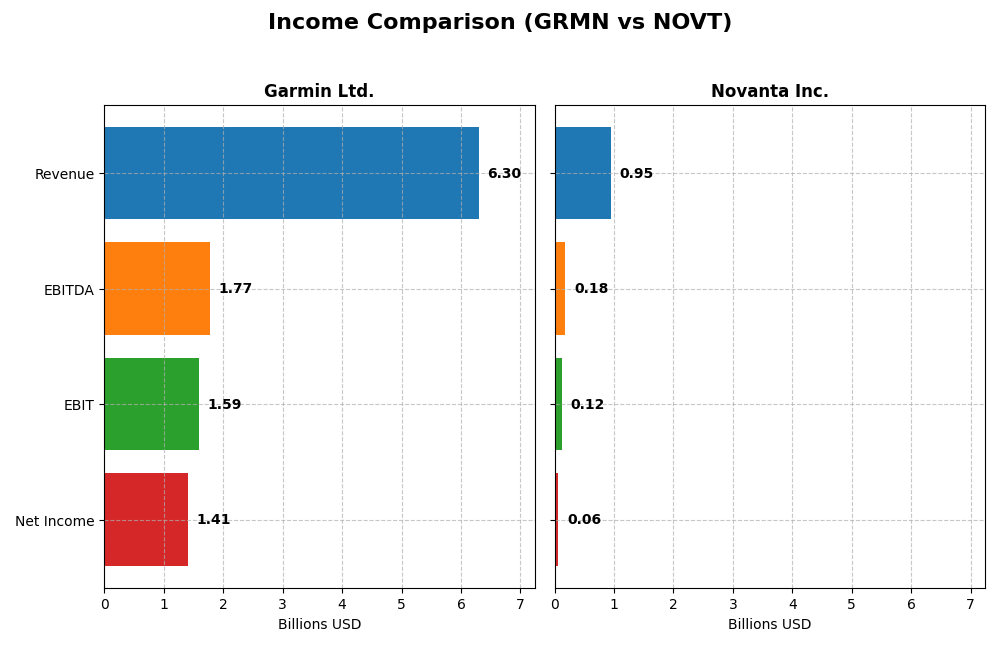
Below is a side-by-side comparison of key income statement metrics for Garmin Ltd. and Novanta Inc. for the fiscal year 2024.
| Metric | Garmin Ltd. (GRMN) | Novanta Inc. (NOVT) |
|---|---|---|
| Market Cap | 41.2B | 4.7B |
| Revenue | 6.30B | 949M |
| EBITDA | 1.77B | 180M |
| EBIT | 1.59B | 124M |
| Net Income | 1.41B | 64.1M |
| EPS | 7.35 | 1.78 |
| Fiscal Year | 2024 | 2024 |
Income Statement Interpretations
Garmin Ltd.
Garmin Ltd. showed strong revenue growth from 2020 to 2024, increasing from 4.19B to 6.30B USD, with net income rising from 992M to 1.41B USD. Margins remained robust, with a gross margin of 58.7% and an EBIT margin of 25.31% in 2024. The latest year saw a 20.44% revenue increase and a 45.95% EBIT growth, although net margin slightly declined by 9.13%.
Novanta Inc.
Novanta Inc. experienced steady revenue growth from 590M USD in 2020 to 949M USD in 2024, with net income increasing from 45M to 64M USD. Margins were more moderate, with a 44.41% gross margin and a 13.09% EBIT margin in 2024. Revenue growth slowed to 7.67% in the latest year, with net margin dropping 18.32% and EPS declining by 12.38%.
Which one has the stronger fundamentals?
Garmin Ltd. exhibits stronger fundamentals with higher and more consistent revenue and net income growth, superior margins, and a favorable overall income statement evaluation. Novanta shows positive growth but with more modest margins and recent declines in net margin and EPS. Garmin’s financial metrics suggest a more resilient profit structure despite a slight net margin dip in 2024.
Financial Ratios Comparison
The table below presents the most recent financial ratios for Garmin Ltd. and Novanta Inc., reflecting their fiscal year 2024 performance for a clear side-by-side comparison.
| Ratios | Garmin Ltd. (GRMN) | Novanta Inc. (NOVT) |
|---|---|---|
| ROE | 17.98% | 8.59% |
| ROIC | 16.28% | 7.19% |
| P/E | 28.50 | 85.70 |
| P/B | 5.13 | 7.37 |
| Current Ratio | 3.54 | 2.58 |
| Quick Ratio | 2.56 | 1.72 |
| D/E (Debt-to-Equity) | 0.02 | 0.63 |
| Debt-to-Assets | 1.69% | 33.92% |
| Interest Coverage | 0 (not available) | 3.51 |
| Asset Turnover | 0.65 | 0.68 |
| Fixed Asset Turnover | 4.49 | 6.08 |
| Payout Ratio | 40.55% | 0% |
| Dividend Yield | 1.42% | 0% |
Interpretation of the Ratios
Garmin Ltd.
Garmin Ltd. shows mostly favorable ratios, with strong net margin at 22.41% and return on equity near 18%, indicating efficient profitability and capital use. However, some concerns include a high price-to-earnings ratio of 28.5 and a current ratio of 3.54, which may reflect overvaluation and liquidity management issues. Garmin pays dividends with a neutral yield of 1.42%, supported by free cash flow, but investors should monitor payout sustainability and share buybacks.
Novanta Inc.
Novanta Inc. exhibits mixed ratios, with neutral net margin of 6.75% and unfavorable return on equity at 8.59%. Its weighted average cost of capital at 10.82% and high price-to-earnings ratio of 85.7 also raise caution. The company does not pay dividends, likely due to reinvestment needs or growth focus, as evidenced by negative free cash flow to equity and prioritization of R&D, indicating a cautious stance on shareholder returns.
Which one has the best ratios?
Garmin Ltd. presents a more favorable overall ratio profile, with a majority of positive profitability and financial health indicators, despite some valuation and liquidity concerns. Novanta Inc. shows a slightly unfavorable ratio picture, with weaker profitability and no dividend returns, reflecting higher risk or growth stage. Based strictly on ratios, Garmin appears stronger financially.
Strategic Positioning
This section compares the strategic positioning of Garmin Ltd. and Novanta Inc. including market position, key segments, and exposure to technological disruption:
Garmin Ltd.
- Established market leader in hardware with diverse segments; moderate competition
- Diversified segments: fitness, outdoor, aviation, marine, automotive mobile
- Moderate exposure to tech disruption; emphasizes integrated avionics and wearables
Novanta Inc.
- Smaller market cap with higher beta, facing competitive pressure in specialized industrial markets
- Focused on photonics, vision, precision motion; key drivers in medical and industrial OEM components
- Exposure to innovation in photonics and robotics; growing in advanced surgery and precision medicine
Garmin Ltd. vs Novanta Inc. Positioning
Garmin shows a diversified business model across multiple consumer and industrial segments, offering stability but facing broad competition. Novanta is more concentrated in high-tech niche markets, with growth potential but higher volatility and focused industrial reliance.
Which has the best competitive advantage?
Garmin exhibits a favorable moat with stable value creation and efficient capital use, while Novanta shows a slightly unfavorable moat, currently shedding value despite improving profitability trends.
Stock Comparison
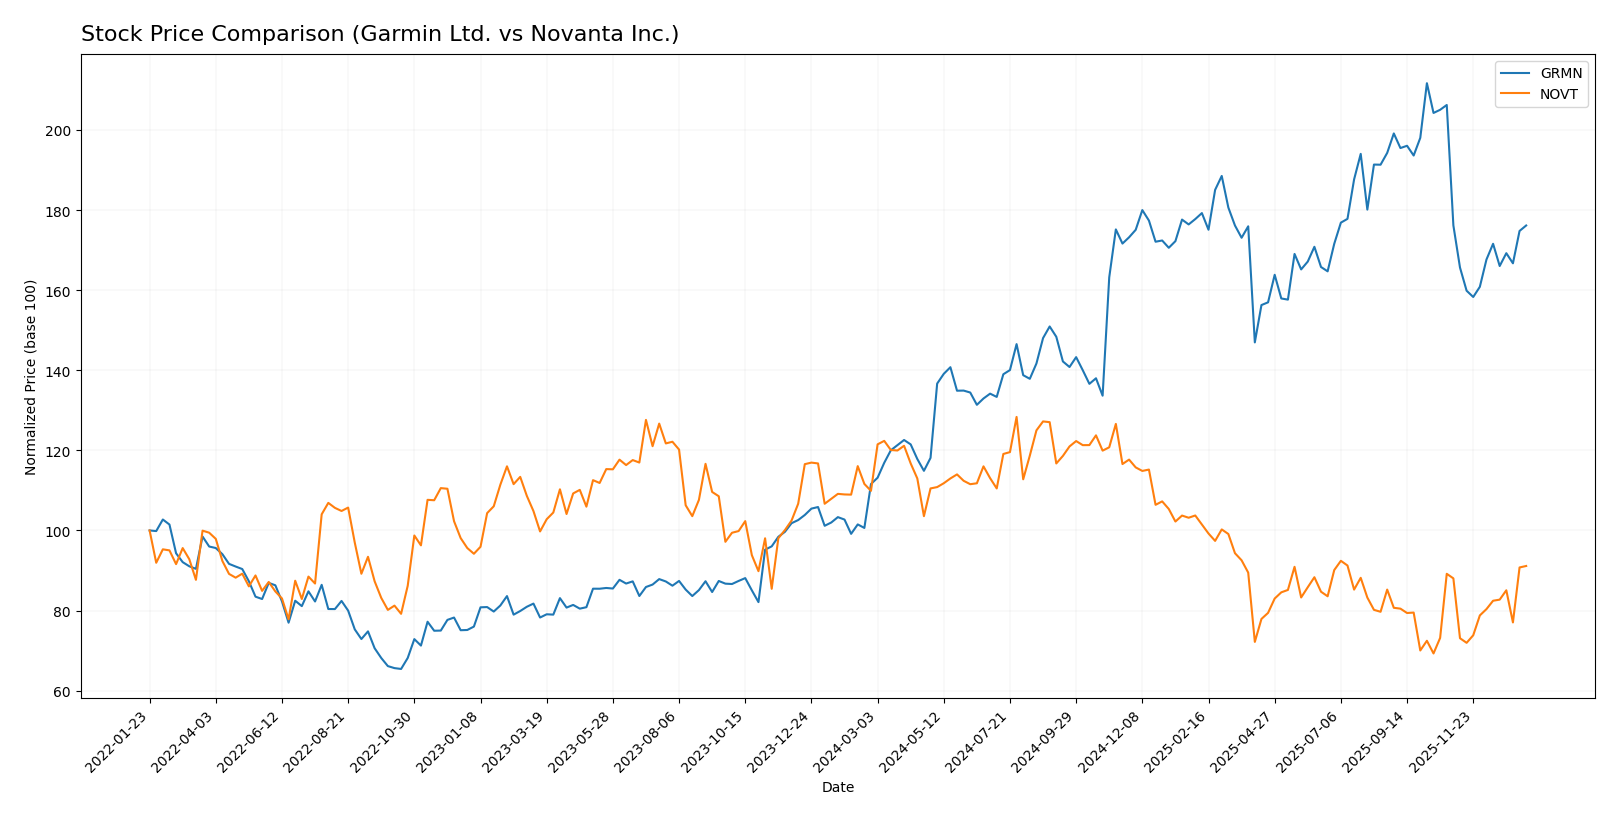
The stock price movements of Garmin Ltd. (GRMN) and Novanta Inc. (NOVT) over the past 12 months reveal contrasting trends, with GRMN showing strong upward momentum and NOVT experiencing a notable decline followed by recent recovery signs.
Trend Analysis
Garmin Ltd. (GRMN) exhibited a bullish trend over the past 12 months, with a 57.86% price increase and accelerating momentum, reaching a high of 257.06. Recent weeks show a neutral trend with minimal change (-0.01%).
Novanta Inc. (NOVT) faced a bearish trend over the past year, declining by 17.07% despite acceleration in the downtrend and a high volatility of 25.04. Recently, NOVT’s trend has turned slightly bullish, gaining 3.51% from November 2025 to January 2026.
Comparing the two, Garmin Ltd. clearly outperformed Novanta Inc. over the last year, delivering the highest market return with sustained acceleration and stronger price gains.
Target Prices
Analysts present a varied but optimistic target price consensus for Garmin Ltd. and Novanta Inc.
| Company | Target High | Target Low | Consensus |
|---|---|---|---|
| Garmin Ltd. | 310 | 193 | 237 |
| Novanta Inc. | 160 | 160 | 160 |
Garmin’s consensus target price of 237 suggests a moderate upside from the current 213.93, reflecting confidence in its diversified product segments. Novanta’s firm target at 160 indicates expectations of steady growth above its current 131.47 stock price.
Analyst Opinions Comparison
This section compares analysts’ ratings and financial scores for Garmin Ltd. and Novanta Inc.:
Rating Comparison
Garmin Ltd. Rating
- Rating: A- indicating a very favorable assessment
- Discounted Cash Flow Score: Moderate at 3
- ROE Score: Favorable at 4
- ROA Score: Very favorable at 5
- Debt To Equity Score: Favorable at 4
- Overall Score: Favorable at 4
Novanta Inc. Rating
- Rating: C+ reflecting a moderate evaluation
- Discounted Cash Flow Score: Moderate at 3
- ROE Score: Moderate at 3
- ROA Score: Moderate at 3
- Debt To Equity Score: Very unfavorable at 1
- Overall Score: Moderate at 2
Which one is the best rated?
Garmin Ltd. holds a better overall rating (A-) and higher scores in ROE, ROA, debt to equity, and overall score compared to Novanta Inc., which shows moderate to very unfavorable scores in key financial metrics.
Scores Comparison
The following table compares the Altman Z-Score and Piotroski Score for Garmin Ltd. and Novanta Inc.:
GRMN Scores
- Altman Z-Score: 14.62, indicating a safe zone with very low bankruptcy risk.
- Piotroski Score: 5, classified as average financial strength.
NOVT Scores
- Altman Z-Score: 5.35, indicating a safe zone with low bankruptcy risk.
- Piotroski Score: 6, classified as average financial strength.
Which company has the best scores?
Garmin Ltd. has a much higher Altman Z-Score than Novanta Inc., indicating stronger financial stability. However, Novanta scores slightly better on the Piotroski scale, though both are in the average range.
Grades Comparison
Here is a comparison of the recent grades assigned to Garmin Ltd. and Novanta Inc. by recognized grading companies:
Garmin Ltd. Grades
The following table presents Garmin’s recent grades from notable financial analysts and firms:
| Grading Company | Action | New Grade | Date |
|---|---|---|---|
| Tigress Financial | Maintain | Strong Buy | 2025-12-19 |
| Longbow Research | Upgrade | Buy | 2025-12-03 |
| Barclays | Maintain | Underweight | 2025-10-30 |
| Morgan Stanley | Maintain | Underweight | 2025-10-30 |
| Tigress Financial | Maintain | Strong Buy | 2025-09-30 |
| Morgan Stanley | Maintain | Underweight | 2025-09-19 |
| Morgan Stanley | Maintain | Underweight | 2025-07-31 |
| Barclays | Maintain | Underweight | 2025-07-31 |
| JP Morgan | Maintain | Neutral | 2025-07-17 |
| JP Morgan | Maintain | Neutral | 2025-05-01 |
Garmin’s grades show a polarized pattern, with some firms maintaining a Strong Buy while others consistently rate it Underweight, reflecting mixed analyst sentiment.
Novanta Inc. Grades
The table below summarizes Novanta’s recent grades from established grading companies:
| Grading Company | Action | New Grade | Date |
|---|---|---|---|
| Baird | Maintain | Neutral | 2025-08-11 |
| Baird | Maintain | Neutral | 2025-03-03 |
| Baird | Maintain | Neutral | 2024-11-06 |
| Baird | Maintain | Neutral | 2024-08-07 |
| Baird | Maintain | Neutral | 2023-05-11 |
| Baird | Maintain | Neutral | 2023-05-10 |
| William Blair | Upgrade | Outperform | 2022-05-11 |
| William Blair | Upgrade | Outperform | 2022-05-10 |
| Berenberg | Maintain | Hold | 2020-11-13 |
| Baird | Maintain | Neutral | 2020-05-13 |
Novanta’s grades are predominantly Neutral, with occasional Outperform ratings dating back several years, indicating generally cautious but stable analyst sentiment.
Which company has the best grades?
Garmin Ltd. has received a wider range of grades, including Strong Buy and Buy ratings, but also several Underweight assessments. Novanta Inc. consistently holds Neutral grades with fewer Buy signals. Garmin’s mixed ratings imply greater analyst divergence, potentially indicating higher volatility or uncertainty for investors compared to Novanta’s steadier profile.
Strengths and Weaknesses
Below is a comparison table highlighting the key strengths and weaknesses of Garmin Ltd. (GRMN) and Novanta Inc. (NOVT) based on their recent financial and operational data.
| Criterion | Garmin Ltd. (GRMN) | Novanta Inc. (NOVT) |
|---|---|---|
| Diversification | Highly diversified revenue streams across Automotive Mobile, Aviation, Fitness, Marine, and Outdoor segments, reducing dependence on any single market. | Moderate diversification with focus on Precision Manufacturing, Robotics, Advanced Surgery, and Precision Medicine segments. Narrower industrial focus. |
| Profitability | Strong profitability with net margin at 22.41%, ROE 17.98%, and ROIC 16.28%, indicating efficient capital use and value creation. | Lower profitability: net margin 6.75%, ROE 8.59%, ROIC 7.19%, showing modest returns and ongoing challenges. |
| Innovation | Stable innovation with consistent investment in fitness and outdoor technology, maintaining competitive edge in consumer electronics. | Innovation growing, supported by increasing ROIC trend, especially in robotics and advanced surgery, but overall value creation remains negative. |
| Global presence | Established global presence with strong brand recognition in multiple consumer and industrial markets worldwide. | Global presence growing but more niche, focusing on specialized medical and industrial equipment markets. |
| Market Share | Strong market share in fitness wearables and GPS navigation, supported by diversified segments and stable demand. | Smaller market share concentrated in precision technologies with competitive pressures in niche markets. |
Key takeaway: Garmin Ltd. demonstrates a favorable overall position with strong profitability, broad diversification, and stable innovation, making it a value creator. Novanta Inc., while showing promising innovation growth, currently struggles with profitability and value destruction, suggesting higher risk but potential for improvement.
Risk Analysis
Below is a table summarizing key risks for Garmin Ltd. (GRMN) and Novanta Inc. (NOVT) based on their latest financial and market data for 2024.
| Metric | Garmin Ltd. (GRMN) | Novanta Inc. (NOVT) |
|---|---|---|
| Market Risk | Moderate (Beta 1.01) | High (Beta 1.60) |
| Debt level | Very Low (D/E 0.02) | Moderate (D/E 0.63) |
| Regulatory Risk | Moderate (Global tech sector) | Moderate (Medical/Industrial tech) |
| Operational Risk | Low (Diverse product lines) | Moderate (Niche photonics/vision) |
| Environmental Risk | Moderate (Global supply chain) | Moderate (Manufacturing footprint) |
| Geopolitical Risk | Moderate (Swiss HQ, global sales) | Moderate (US HQ, global markets) |
Garmin’s low debt and stable financial health reduce default risk, while Novanta’s higher beta and debt raise sensitivity to market swings and financial strain. Market volatility and sector-specific regulations are the most impactful risks for both. Garmin’s diversified segments offer operational resilience, whereas Novanta’s specialized focus increases exposure to industry shifts.
Which Stock to Choose?
Garmin Ltd. (GRMN) shows strong income growth with a 20.44% revenue increase in 2024 and favorable profitability ratios, including a 22.41% net margin and 17.98% ROE. Its debt levels are low with a net debt to EBITDA of -1.08, and it holds a very favorable A- rating supported by solid financial health and an economic moat.
Novanta Inc. (NOVT) has moderate income growth, with a 7.67% revenue increase in 2024 and a lower net margin of 6.75%. Its financial ratios are mixed, with neutral to unfavorable scores in ROE and debt metrics, including a net debt to EBITDA of 1.98. NOVT holds a C+ rating with a slightly unfavorable overall financial profile despite showing a growing ROIC trend.
Investors seeking companies with stable profitability and strong financial metrics might find Garmin’s profile favorable, while those open to higher risk and focused on growth potential could interpret Novanta’s improving ROIC and recent price acceleration as signals worth monitoring. The choice may depend on individual risk tolerance and investment strategy.
Disclaimer: Investment carries a risk of loss of initial capital. The past performance is not a reliable indicator of future results. Be sure to understand risks before making an investment decision.
Go Further
I encourage you to read the complete analyses of Garmin Ltd. and Novanta Inc. to enhance your investment decisions: