In the dynamic world of technology hardware, Garmin Ltd. and MKS Inc. stand out as influential players with distinct yet overlapping market footprints. Garmin, a leader in GPS and wearable devices, contrasts with MKS’s specialization in precision instruments and process control solutions for manufacturing. Both companies drive innovation in their sectors, offering unique growth potential. This article will explore which company presents a more compelling opportunity for your investment portfolio.
Table of contents
Companies Overview
I will begin the comparison between Garmin Ltd. and MKS Inc. by providing an overview of these two companies and their main differences.
Garmin Ltd. Overview
Garmin Ltd. is a Swiss technology company specializing in the design, development, manufacturing, and marketing of wireless devices across multiple segments, including fitness, outdoor, aviation, marine, and automotive. With a market cap of 41B USD and 21,800 employees, Garmin operates globally and offers integrated hardware and software solutions such as smartwatches, avionics, and marine electronics. It is listed on the NYSE under the ticker GRMN.
MKS Inc. Overview
MKS Inc. is a U.S.-based technology firm providing instruments, systems, and process control solutions primarily for semiconductor, industrial, life sciences, and defense markets. With a market cap of 13B USD and 10,200 employees, MKS offers vacuum and pressure control, laser and photonics products, and manufacturing equipment. It is listed on NASDAQ as MKSI and focuses on precision control and measurement technologies.
Key similarities and differences
Both Garmin and MKS operate in the technology sector within the hardware, equipment, and parts industry. Garmin offers a diverse range of consumer and professional devices with integrated software platforms, while MKS focuses on specialized instrumentation and process control systems for industrial and scientific applications. Garmin’s business spans consumer and aviation markets, whereas MKS targets semiconductor and high-tech manufacturing sectors, reflecting distinct end-market focuses despite some overlap in hardware technology.
Income Statement Comparison
This table compares the latest fiscal year income statement metrics of Garmin Ltd. and MKS Inc. to provide a clear view of their financial performance in 2024.

| Metric | Garmin Ltd. (GRMN) | MKS Inc. (MKSI) |
|---|---|---|
| Market Cap | 41.2B | 13.0B |
| Revenue | 6.30B | 3.59B |
| EBITDA | 1.77B | 870M |
| EBIT | 1.59B | 522M |
| Net Income | 1.41B | 190M |
| EPS | 7.35 | 2.82 |
| Fiscal Year | 2024 | 2024 |
Income Statement Interpretations
Garmin Ltd.
Garmin Ltd. shows a robust upward trend in revenue, rising from $4.19B in 2020 to $6.30B in 2024, with net income growing from $992M to $1.41B over the same period. Margins are generally stable with a gross margin of 58.7% and an EBIT margin of 25.31% in 2024. The latest year saw strong revenue growth of 20.44%, but net margin declined slightly by 9.13%, despite an 8.79% EPS increase.
MKS Inc.
MKS Inc. experienced revenue growth from $2.33B in 2020 to $3.59B in 2024, though the last year saw a slight decline of 0.99%. Net income is volatile, dropping from $350M in 2020 to a loss of $1.84B in 2023, then recovering to $190M in 2024. Margins remain modest, with a gross margin of 47.63% and a net margin of 5.3% in 2024. EBIT improved significantly in 2024 with a 134.66% growth.
Which one has the stronger fundamentals?
Garmin Ltd. demonstrates stronger fundamentals, with consistent revenue and net income growth, favorable margins, and controlled expenses. MKS Inc. shows mixed results, with recent volatility in net income and weaker margins despite some recovery in 2024. Garmin’s stable profitability and margin trends contrast with MKS’s fluctuating performance and narrower net margins.
Financial Ratios Comparison
The table below presents the most recent key financial ratios for Garmin Ltd. and MKS Inc. based on their fiscal year 2024 data, providing a snapshot of their profitability, liquidity, leverage, efficiency, and shareholder returns.
| Ratios | Garmin Ltd. (GRMN) | MKS Inc. (MKSI) |
|---|---|---|
| ROE | 17.98% | 8.18% |
| ROIC | 16.28% | 6.31% |
| P/E | 28.5 | 37.0 |
| P/B | 5.13 | 3.03 |
| Current Ratio | 3.54 | 3.19 |
| Quick Ratio | 2.56 | 2.04 |
| D/E | 0.02 | 2.06 |
| Debt-to-Assets | 1.69% | 55.65% |
| Interest Coverage | 0 (not reported) | 1.44 |
| Asset Turnover | 0.65 | 0.42 |
| Fixed Asset Turnover | 4.49 | 3.55 |
| Payout ratio | 40.55% | 31.05% |
| Dividend yield | 1.42% | 0.84% |
Interpretation of the Ratios
Garmin Ltd.
Garmin Ltd. shows predominantly favorable financial ratios, including a strong net margin of 22.41% and a robust return on equity of 17.98%, though its price-to-earnings and price-to-book ratios appear high. The company maintains a dividend yield of 1.42% with a balanced payout, supported by solid free cash flow coverage, indicating steady shareholder returns without excessive risk.
MKS Inc.
MKS Inc. presents several unfavorable ratios, such as a low return on equity of 8.18% and a high debt-to-equity ratio of 2.06, reflecting financial leverage concerns. Its dividend yield is modest at 0.84%, but weaker coverage and higher weighted average cost of capital suggest challenges in sustaining shareholder returns and managing debt efficiently.
Which one has the best ratios?
Garmin Ltd.’s financial ratios are generally more favorable, with stronger profitability and better balance sheet metrics compared to MKS Inc., which struggles with leverage and profitability issues. Garmin’s dividend and cash flow situation also appears more sustainable, positioning it ahead in this ratio comparison.
Strategic Positioning
This section compares the strategic positioning of Garmin Ltd. and MKS Inc., focusing on market position, key segments, and exposure to technological disruption:
Garmin Ltd.
- Established global presence in hardware with broad competitive pressures in multiple segments.
- Diversified segments including fitness, outdoor, aviation, marine, and automotive mobile products.
- Faces moderate technological disruption with continuous innovation in wireless and avionics systems.
MKS Inc.
- Operates in specialized hardware with high beta indicating volatile market conditions.
- Focuses on vacuum, photonics, and equipment solutions serving semiconductor and industrial markets.
- Exposed to advanced manufacturing and photonics technology disruption requiring constant innovation.
Garmin Ltd. vs MKS Inc. Positioning
Garmin adopts a diversified business model across several consumer and professional hardware markets, spreading risk but facing broad competitive pressures. MKS concentrates on niche industrial and semiconductor segments, which may allow deeper specialization but increases dependency on specific technologies and markets.
Which has the best competitive advantage?
Garmin demonstrates a favorable economic moat with consistent value creation and stable profitability. In contrast, MKS is shedding value with a declining ROIC trend, indicating weaker competitive advantage and profitability challenges.
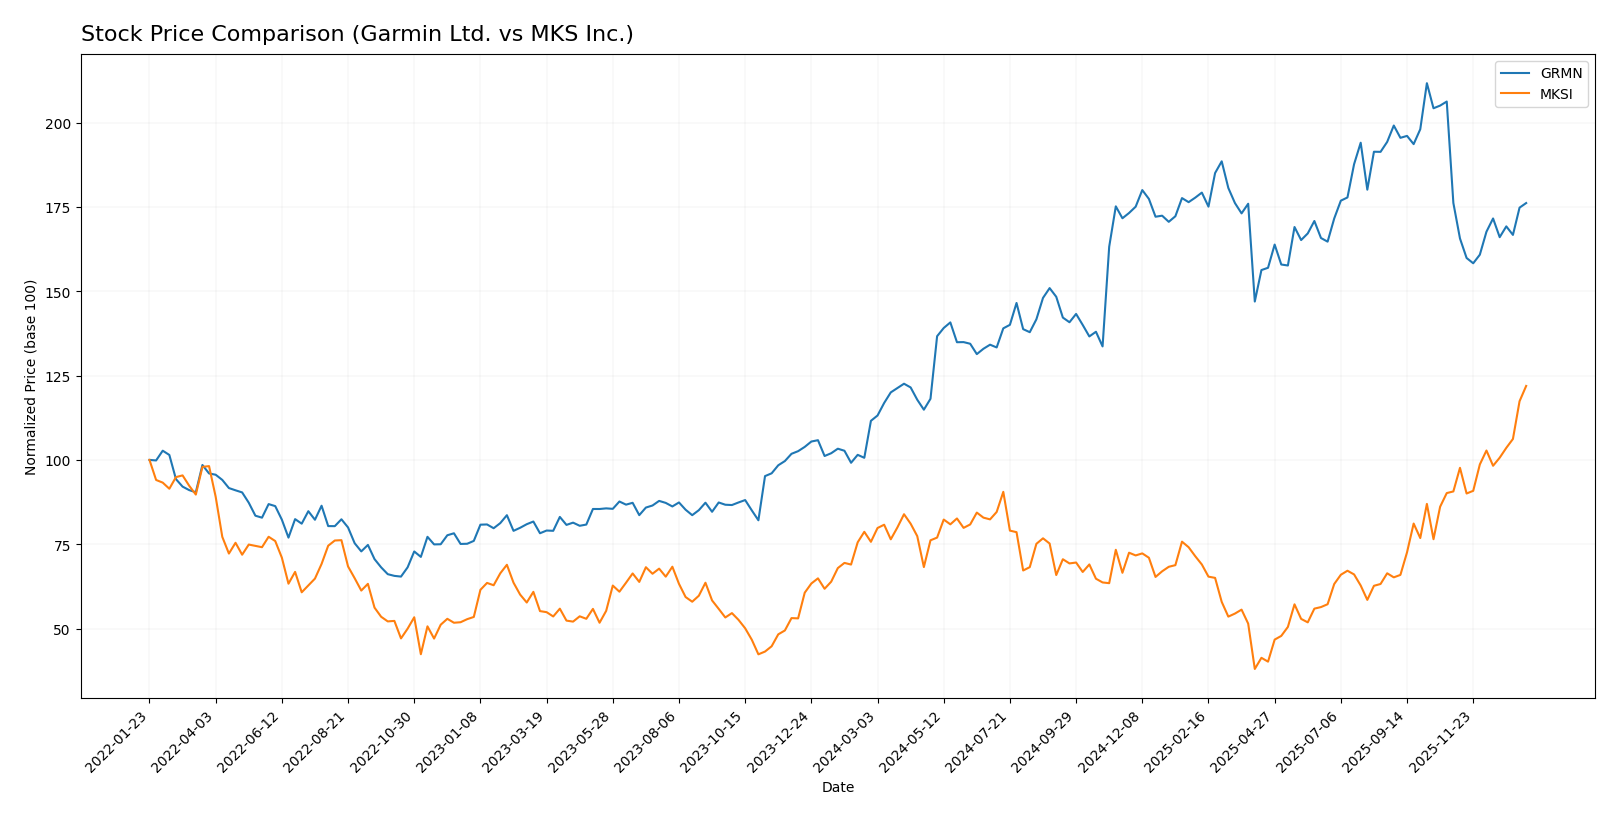
Stock Comparison
The stock price chart highlights significant bullish trends for Garmin Ltd. and MKS Inc. over the past year, with strong price gains and notable trading volume dynamics shaping their market performance.
Trend Analysis
Garmin Ltd. exhibited a bullish trend over the past 12 months with a 57.86% price increase accompanied by acceleration and high volatility (29.55 std deviation). Recent movement shows a near-neutral change (-0.01%) with low volatility.
MKS Inc. showed a bullish trend with a 61.03% price increase over 12 months, also accelerating but with slightly lower volatility (24.4 std deviation). Recent gains were strong at 34.49%, indicating robust upward momentum.
Comparing trends, MKS Inc. delivered the highest market performance with a 61.03% gain, slightly outperforming Garmin Ltd., whose recent trend has flattened near zero.
Target Prices
The current analyst consensus presents a balanced outlook with clear target ranges for Garmin Ltd. and MKS Inc.
| Company | Target High | Target Low | Consensus |
|---|---|---|---|
| Garmin Ltd. | 310 | 193 | 237 |
| MKS Inc. | 215 | 136 | 176.17 |
Analysts see Garmin Ltd. trading moderately above its current price of $213.93, while MKS Inc.’s consensus target at $176.17 suggests a slight downside from its current $193.28. Overall, expectations reflect cautious optimism.
Analyst Opinions Comparison
This section compares analysts’ ratings and grades for Garmin Ltd. and MKS Inc.:
Rating Comparison
Garmin Ltd. Rating
- Rating: A-, indicating a very favorable overall status.
- Discounted Cash Flow Score: Moderate at 3 out of 5.
- ROE Score: Favorable at 4, showing efficient profit generation.
- ROA Score: Very favorable at 5, excellent asset utilization.
- Debt To Equity Score: Favorable at 4, indicating lower financial risk.
- Overall Score: Favorable at 4, reflecting strong financial standing.
MKS Inc. Rating
- Rating: B-, also very favorable but lower than Garmin.
- Discounted Cash Flow Score: Moderate at 3 out of 5.
- ROE Score: Moderate at 3, less efficient than Garmin.
- ROA Score: Moderate at 3, moderate asset utilization.
- Debt To Equity Score: Very unfavorable at 1, higher financial risk.
- Overall Score: Moderate at 2, weaker financial standing.
Which one is the best rated?
Based on the provided data, Garmin Ltd. holds a stronger overall rating and higher scores in ROE, ROA, and debt-to-equity metrics compared to MKS Inc., which shows a notably weaker debt-to-equity score and lower overall score.
Scores Comparison
The following table presents a comparison of the Altman Z-Score and Piotroski Score for Garmin Ltd. and MKS Inc.:
Garmin Ltd. Scores
- Altman Z-Score: 14.62, indicating a safe zone.
- Piotroski Score: 5, reflecting average financial strength.
MKS Inc. Scores
- Altman Z-Score: 2.22, indicating a grey zone.
- Piotroski Score: 7, reflecting strong financial strength.
Which company has the best scores?
Garmin Ltd. has a significantly higher Altman Z-Score, placing it in the safe zone, while MKS Inc. has a stronger Piotroski Score. The scores show a mixed picture of financial health between the two companies.
Grades Comparison
Here is the grades comparison of Garmin Ltd. and MKS Inc. from various reliable grading companies:
Garmin Ltd. Grades
The following table shows recent grades assigned to Garmin Ltd. by reputable financial firms:
| Grading Company | Action | New Grade | Date |
|---|---|---|---|
| Tigress Financial | Maintain | Strong Buy | 2025-12-19 |
| Longbow Research | Upgrade | Buy | 2025-12-03 |
| Barclays | Maintain | Underweight | 2025-10-30 |
| Morgan Stanley | Maintain | Underweight | 2025-10-30 |
| Tigress Financial | Maintain | Strong Buy | 2025-09-30 |
| Morgan Stanley | Maintain | Underweight | 2025-09-19 |
| Morgan Stanley | Maintain | Underweight | 2025-07-31 |
| Barclays | Maintain | Underweight | 2025-07-31 |
| JP Morgan | Maintain | Neutral | 2025-07-17 |
| JP Morgan | Maintain | Neutral | 2025-05-01 |
Overall, Garmin Ltd.’s grades show a mix of strong buy signals from Tigress Financial and buy from Longbow Research, counterbalanced by consistent underweight ratings from Barclays and Morgan Stanley, indicating a divergent analyst sentiment.
MKS Inc. Grades
The following table displays recent grades for MKS Inc. from recognized grading firms:
| Grading Company | Action | New Grade | Date |
|---|---|---|---|
| B of A Securities | Maintain | Buy | 2026-01-13 |
| Needham | Maintain | Buy | 2026-01-13 |
| Mizuho | Maintain | Outperform | 2025-12-17 |
| Citigroup | Maintain | Buy | 2025-11-12 |
| Wells Fargo | Maintain | Equal Weight | 2025-11-07 |
| Keybanc | Maintain | Overweight | 2025-11-07 |
| Benchmark | Maintain | Buy | 2025-11-07 |
| Needham | Maintain | Buy | 2025-11-06 |
| Mizuho | Maintain | Outperform | 2025-10-16 |
| Needham | Maintain | Buy | 2025-10-13 |
MKS Inc. consistently receives buy and outperform ratings, with only one equal weight rating, reflecting a broadly positive consensus from analysts.
Which company has the best grades?
MKS Inc. holds the better grades overall, with multiple buy and outperform ratings compared to Garmin Ltd.’s mixed signals, including several underweight ratings. This disparity may influence investor confidence and perceived risk profiles.
Strengths and Weaknesses
Below is a comparative overview of Garmin Ltd. (GRMN) and MKS Inc. (MKSI) based on key investment criteria including diversification, profitability, innovation, global presence, and market share.
| Criterion | Garmin Ltd. (GRMN) | MKS Inc. (MKSI) |
|---|---|---|
| Diversification | Highly diversified across Automotive Mobile, Aviation, Fitness, Marine, and Outdoor segments | Moderate diversification mainly in Product and Service segments, with specialized divisions in photonics and vacuum solutions |
| Profitability | Strong profitability evidenced by 22.41% net margin and 17.98% ROE, creating value with ROIC > WACC | Moderate profitability with 5.3% net margin and 8.18% ROE, but ROIC < WACC indicating value destruction |
| Innovation | Consistent investment reflected in stable ROIC trend and product development across fitness and outdoor domains | Innovation challenged by declining ROIC and unfavorable financial ratios, indicating profitability and efficiency issues |
| Global presence | Established global footprint with consistent revenue growth in multiple segments | Global presence in specialized markets but financial performance suggests operational challenges |
| Market Share | Strong market position in fitness and outdoor tech markets with revenues exceeding $1.7B in fitness segment alone | Niche market player with $3.1B in product sales but facing profitability pressures and high debt levels |
Key takeaways: Garmin shows a solid competitive advantage with diversified revenue streams and strong profitability, making it a favorable investment choice. In contrast, MKS struggles with declining profitability and value destruction despite its niche market presence, suggesting higher investment risk.
Risk Analysis
Below is a comparative table highlighting key risks for Garmin Ltd. and MKS Inc. based on the most recent data from 2024.
| Metric | Garmin Ltd. (GRMN) | MKS Inc. (MKSI) |
|---|---|---|
| Market Risk | Moderate (Beta 1.01) | High (Beta 1.92) |
| Debt Level | Very Low (D/E 0.02) | High (D/E 2.06) |
| Regulatory Risk | Moderate | Moderate |
| Operational Risk | Low | Moderate |
| Environmental Risk | Moderate | Moderate |
| Geopolitical Risk | Moderate (Global sales exposure) | Moderate (US based, global markets) |
Garmin’s most impactful risks are moderate market volatility and geopolitical exposure, but its very low debt level and strong financial stability reduce overall risk. MKS faces higher market and financial risks due to elevated leverage and weaker profitability, increasing vulnerability during economic downturns.
Which Stock to Choose?
Garmin Ltd. (GRMN) shows a favorable income evolution with a 20.44% revenue growth in 2024 and strong profitability indicators, including a 22.41% net margin and solid return on equity at 17.98%. The company maintains very low debt levels, reflected in net debt to EBITDA of -1.08 and a favorable debt-to-equity ratio, supported by a very favorable overall rating of A-.
MKS Inc. (MKSI) presents mixed income trends with a slight revenue decline of -0.99% in 2024 but notable EBIT and net margin growth over the past year. Profitability ratios are moderate to unfavorable, with an 8.18% ROE and a net margin of 5.3%. The company carries significant debt, with net debt to EBITDA at 4.67 and a high debt-to-assets ratio of 55.65%, corresponding to a lower rating of B-.
For investors, Garmin’s strong rating and consistent value creation, indicated by ROIC exceeding WACC and a favorable income statement, might appeal to those prioritizing financial stability and quality investing. Conversely, MKS’s recent earnings growth coupled with higher leverage could be of interest to risk-tolerant investors focused on potential turnaround or growth plays.
Disclaimer: Investment carries a risk of loss of initial capital. The past performance is not a reliable indicator of future results. Be sure to understand risks before making an investment decision.
Go Further
I encourage you to read the complete analyses of Garmin Ltd. and MKS Inc. to enhance your investment decisions: