Garmin Ltd. and MicroVision, Inc. operate in the hardware and technology sector but focus on distinct yet overlapping innovation areas. Garmin is a global leader in GPS navigation and wearable tech, while MicroVision specializes in cutting-edge lidar sensors and augmented reality displays. This comparison explores their market positions and growth strategies to help investors identify which company presents the most compelling investment opportunity today. Let’s dive in and find out which stock could enhance your portfolio.
Table of contents
Companies Overview
I will begin the comparison between Garmin Ltd. and MicroVision, Inc. by providing an overview of these two companies and their main differences.
Garmin Ltd. Overview
Garmin Ltd. is a Swiss-based technology company specializing in designing, developing, and manufacturing wireless devices across diverse sectors including fitness, outdoor, aviation, marine, and automotive. Founded in 1989, Garmin maintains a global presence with a broad product portfolio that includes smartwatches, GPS navigators, avionics, and marine electronics, serving multiple markets through various retail and OEM channels.
MicroVision, Inc. Overview
MicroVision, Inc. is a US-based technology firm focused on developing lidar sensors for automotive safety and autonomous driving, alongside micro-display technologies for augmented reality headsets and smart home systems. Founded in 1993, MicroVision leverages laser beam scanning and MEMS technology to provide high-contrast imaging and long-range lidar solutions, primarily selling to original equipment manufacturers and design manufacturers.
Key similarities and differences
Both Garmin and MicroVision operate within the technology sector and hardware equipment industry, developing specialized devices involving advanced technology. However, Garmin’s business model is diversified across multiple consumer and professional markets worldwide, while MicroVision concentrates on niche lidar and display technologies primarily for automotive and AR applications. Garmin’s scale is significantly larger, with over 21,800 employees and a market cap exceeding 41B USD, compared to MicroVision’s 185 employees and a market cap under 300M USD.
Income Statement Comparison
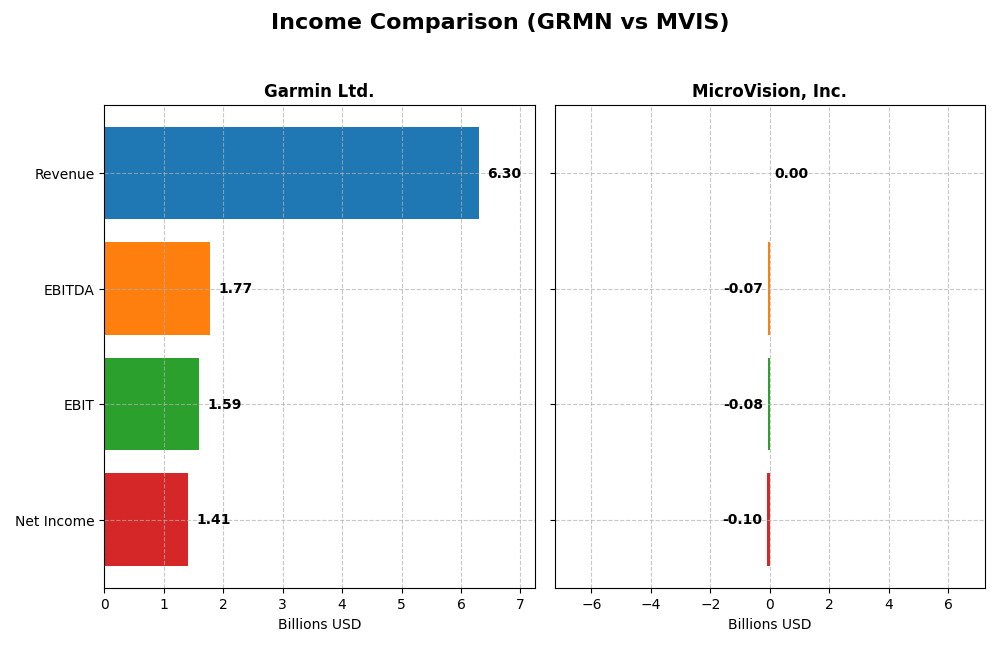
This table presents a side-by-side comparison of key income statement metrics for Garmin Ltd. and MicroVision, Inc. for the fiscal year 2024.
| Metric | Garmin Ltd. (GRMN) | MicroVision, Inc. (MVIS) |
|---|---|---|
| Market Cap | 41.2B | 291M |
| Revenue | 6.3B | 4.7M |
| EBITDA | 1.77B | -71.0M |
| EBIT | 1.59B | -75.2M |
| Net Income | 1.41B | -97.0M |
| EPS | 7.35 | -0.46 |
| Fiscal Year | 2024 | 2024 |
Income Statement Interpretations
Garmin Ltd.
Garmin Ltd. experienced steady growth from 2020 to 2024, with revenue rising from $4.19B to $6.30B and net income increasing from $992M to $1.41B. Margins largely remained favorable, highlighted by a gross margin of 58.7% and an EBIT margin of 25.31% in 2024. The latest year showed a 20.44% revenue increase and a strong 45.95% EBIT growth, though net margin slightly declined by 9.13%.
MicroVision, Inc.
MicroVision, Inc. showed mixed results over the 2020-2024 period. Revenue grew overall from $3.1M to $4.7M but declined by 35.31% in the most recent year. The company continues to report negative margins, including a gross margin of -60.35% and an EBIT margin of -1601.26% in 2024. Despite a 14.85% EBIT growth last year, net income remains deeply negative at -$97M, with deteriorating net margins.
Which one has the stronger fundamentals?
Garmin Ltd. demonstrates stronger fundamentals with consistent revenue and net income growth, healthy profit margins, and positive earnings per share trends. In contrast, MicroVision struggles with significant losses, negative margins, and volatile revenue, reflecting weaker operational efficiency and profitability. Overall, Garmin’s income statement performance is markedly more favorable.
Financial Ratios Comparison
The table below presents the most recent key financial ratios for Garmin Ltd. and MicroVision, Inc. as of fiscal year 2024, facilitating a straightforward side-by-side comparison.
| Ratios | Garmin Ltd. (GRMN) | MicroVision, Inc. (MVIS) |
|---|---|---|
| ROE | 17.98% | -198.72% |
| ROIC | 16.28% | -83.73% |
| P/E | 28.50 | -2.83 |
| P/B | 5.13 | 5.63 |
| Current Ratio | 3.54 | 1.79 |
| Quick Ratio | 2.56 | 1.74 |
| D/E (Debt-to-Equity) | 0.02 | 1.06 |
| Debt-to-Assets | 1.69% | 42.62% |
| Interest Coverage | 0 (not reported) | -19.19 |
| Asset Turnover | 0.65 | 0.04 |
| Fixed Asset Turnover | 4.49 | 0.20 |
| Payout Ratio | 40.55% | 0% |
| Dividend Yield | 1.42% | 0% |
Interpretation of the Ratios
Garmin Ltd.
Garmin Ltd. shows predominantly favorable financial ratios, including a strong net margin of 22.41%, ROE at 17.98%, and ROIC of 16.28%. Some concerns arise from its elevated PE of 28.5, PB of 5.13, and a high current ratio of 3.54, which are considered unfavorable. The company pays dividends, with a stable yield of 1.42%, supported by free cash flow and moderate payout risks.
MicroVision, Inc.
MicroVision displays mostly unfavorable ratios, including a deeply negative net margin of -2063.78% and a negative ROE of -198.72%, indicating poor profitability and efficiency. Favorable points include a current ratio of 1.79 and PE of -2.83, reflecting valuation challenges. The company does not pay dividends, likely due to negative earnings and a focus on R&D, as shown by its very high research expense ratio.
Which one has the best ratios?
Garmin Ltd. clearly holds the advantage with a majority of favorable ratios and stable shareholder returns, while MicroVision’s financials indicate significant distress and inefficiency. Garmin’s balance of profitability, returns, and dividend payments contrast sharply with MicroVision’s ongoing losses and lack of distributions, making Garmin’s ratios comparatively stronger.
Strategic Positioning
This section compares the strategic positioning of Garmin Ltd. and MicroVision, Inc., focusing on market position, key segments, and exposure to technological disruption:
Garmin Ltd.
- Leading in multiple hardware segments with significant market cap and moderate competition pressure.
- Diverse segments including fitness, outdoor, marine, aviation, and automotive mobile driving revenues.
- Moderate exposure with established product lines in GPS and avionics; less reliant on rapidly changing tech.
MicroVision, Inc.
- Smaller market cap with niche focus in lidar and AR sensor technology, facing higher competitive pressure.
- Concentrated on lidar sensors for automotive safety, AR headsets, and display technologies.
- High exposure due to dependence on emerging lidar and AR technologies, with innovation critical for growth.
Garmin Ltd. vs MicroVision, Inc. Positioning
Garmin has a diversified business model spanning multiple hardware and technology segments, providing stable revenue streams. MicroVision is more concentrated in advanced lidar and AR technologies, with higher innovation risk but potential for growth in emerging markets.
Which has the best competitive advantage?
Garmin demonstrates a favorable economic moat with consistent value creation and stable profitability. MicroVision shows a slightly unfavorable moat, shedding value despite a growing ROIC trend, indicating weaker competitive advantage at present.
Stock Comparison
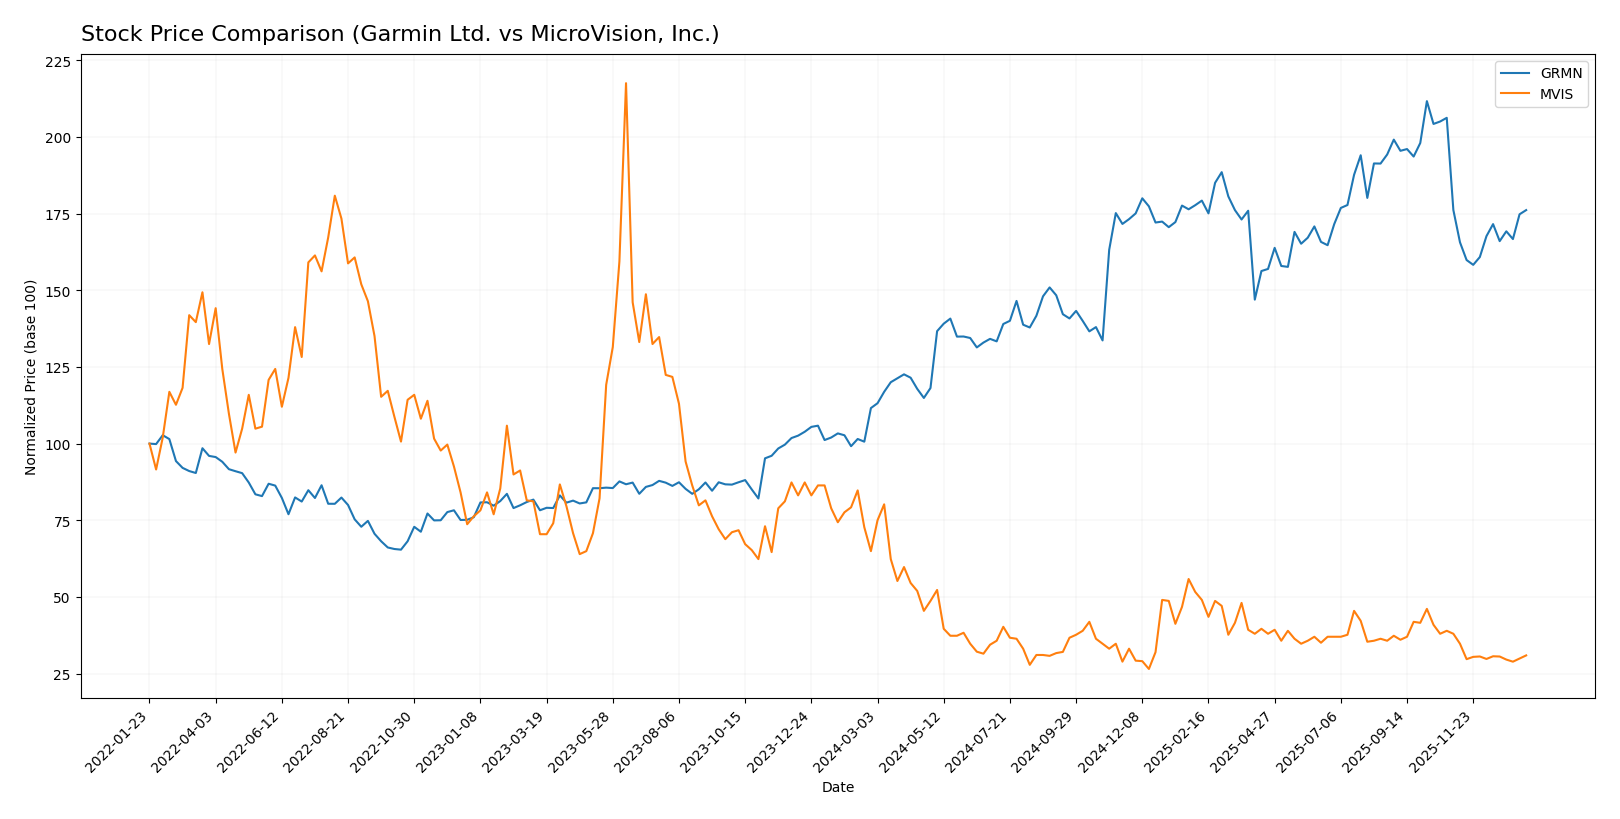
The stock price movements of Garmin Ltd. and MicroVision, Inc. over the past 12 months reveal contrasting trajectories, with Garmin showing strong gains and acceleration, while MicroVision faces a sustained decline with deceleration.
Trend Analysis
Garmin Ltd. (GRMN) experienced a bullish trend over the past year, with a 57.86% price increase and acceleration in momentum. The stock’s volatility was significant, with a standard deviation of 29.55, hitting a high of 257.06 and a low of 135.51.
MicroVision, Inc. (MVIS) showed a bearish trend over the same period, with a 52.36% price decline and deceleration. The stock’s volatility remained low, with a standard deviation of 0.29, and the price ranged between 0.82 and 2.47.
Comparing both stocks, Garmin Ltd. delivered the highest market performance with a strong bullish trend, while MicroVision, Inc. lagged with a marked bearish trajectory.
Target Prices
The current analyst consensus shows a varied outlook for Garmin Ltd. and MicroVision, Inc.
| Company | Target High | Target Low | Consensus |
|---|---|---|---|
| Garmin Ltd. | 310 | 193 | 237 |
| MicroVision, Inc. | 5 | 5 | 5 |
Analysts expect Garmin’s stock to appreciate moderately above its current price of 213.93 USD, with a consensus target of 237 USD. MicroVision’s target of 5 USD indicates a substantial potential upside from the current price near 0.95 USD.
Analyst Opinions Comparison
This section compares analysts’ ratings and financial grades for Garmin Ltd. and MicroVision, Inc.:
Rating Comparison
Garmin Ltd. Rating
- Rating: A-, classified as Very Favorable by analysts.
- Discounted Cash Flow Score: 3, indicating a Moderate valuation based on future cash flow.
- ROE Score: 4, showing Favorable efficiency in generating profit from shareholders’ equity.
- ROA Score: 5, marked as Very Favorable for asset utilization effectiveness.
- Debt To Equity Score: 4, Favorable financial risk profile with manageable debt levels.
- Overall Score: 4, Favorable comprehensive financial standing.
MicroVision, Inc. Rating
- Rating: C-, classified as Very Unfavorable by analysts.
- Discounted Cash Flow Score: 1, pointing to a Very Unfavorable valuation.
- ROE Score: 1, reflecting Very Unfavorable profit generation efficiency.
- ROA Score: 1, considered Very Unfavorable in asset utilization.
- Debt To Equity Score: 2, Moderate financial risk profile with higher debt reliance.
- Overall Score: 1, Very Unfavorable overall financial performance.
Which one is the best rated?
Garmin Ltd. holds a clearly superior position with an A- rating and favorable to very favorable scores across all key metrics. MicroVision, Inc. is rated much lower with a C- rating and predominantly very unfavorable scores, except for moderate debt-to-equity and price-to-book scores.
Scores Comparison
Here is a comparison of the Altman Z-Score and Piotroski Score for Garmin Ltd. and MicroVision, Inc.:
Garmin Ltd. Scores
- Altman Z-Score: 14.62, indicating a safe financial zone, very low risk of bankruptcy.
- Piotroski Score: 5, reflecting average financial strength and moderate investment quality.
MicroVision, Inc. Scores
- Altman Z-Score: -6.63, placing the company in the distress zone, high bankruptcy risk.
- Piotroski Score: 1, showing very weak financial health and poor investment potential.
Which company has the best scores?
Garmin Ltd. has significantly better scores, with a very safe Altman Z-Score and an average Piotroski Score, compared to MicroVision’s distress zone Altman Z-Score and very weak Piotroski Score.
Grades Comparison
Here is a comparison of the recent grades assigned to Garmin Ltd. and MicroVision, Inc. by recognized grading companies:
Garmin Ltd. Grades
This table summarizes the latest grades from various financial institutions for Garmin Ltd.
| Grading Company | Action | New Grade | Date |
|---|---|---|---|
| Tigress Financial | Maintain | Strong Buy | 2025-12-19 |
| Longbow Research | Upgrade | Buy | 2025-12-03 |
| Barclays | Maintain | Underweight | 2025-10-30 |
| Morgan Stanley | Maintain | Underweight | 2025-10-30 |
| Tigress Financial | Maintain | Strong Buy | 2025-09-30 |
| Morgan Stanley | Maintain | Underweight | 2025-09-19 |
| Morgan Stanley | Maintain | Underweight | 2025-07-31 |
| Barclays | Maintain | Underweight | 2025-07-31 |
| JP Morgan | Maintain | Neutral | 2025-07-17 |
| JP Morgan | Maintain | Neutral | 2025-05-01 |
Overall, Garmin’s grades show a mixed trend with strong buy ratings from Tigress Financial contrasting with underweight and neutral ratings from Morgan Stanley, Barclays, and JP Morgan.
MicroVision, Inc. Grades
Below are the recent grades from financial firms covering MicroVision, Inc.
| Grading Company | Action | New Grade | Date |
|---|---|---|---|
| D. Boral Capital | Maintain | Buy | 2025-12-16 |
| D. Boral Capital | Maintain | Buy | 2025-11-12 |
| WestPark Capital | Maintain | Buy | 2025-10-21 |
| WestPark Capital | Maintain | Buy | 2025-09-05 |
| D. Boral Capital | Maintain | Buy | 2025-09-02 |
| WestPark Capital | Maintain | Buy | 2025-08-27 |
| D. Boral Capital | Maintain | Buy | 2025-08-11 |
| D. Boral Capital | Maintain | Buy | 2025-05-21 |
| D. Boral Capital | Maintain | Buy | 2025-05-13 |
| WestPark Capital | Maintain | Buy | 2025-03-27 |
MicroVision’s grades exhibit consistent buy recommendations from both D. Boral Capital and WestPark Capital, reflecting stable positive sentiment.
Which company has the best grades?
MicroVision, Inc. has received uniformly positive buy ratings, while Garmin Ltd. shows a divided outlook with some strong buy ratings but also several underweight and neutral assessments. This divergence may influence investor sentiment differently regarding risk and opportunity.
Strengths and Weaknesses
Below is a comparative overview of Garmin Ltd. (GRMN) and MicroVision, Inc. (MVIS) based on diversification, profitability, innovation, global presence, and market share using the most recent data.
| Criterion | Garmin Ltd. (GRMN) | MicroVision, Inc. (MVIS) |
|---|---|---|
| Diversification | Highly diversified across Automotive, Fitness, Outdoor, Aviation, and Marine segments with revenues ranging from $610M to $1.96B in 2024 | Limited diversification; revenue mainly from Product ($4.1M) and License/Royalty ($0.48M) in 2024 |
| Profitability | Strong profitability with net margin 22.4%, ROIC 16.3%, and positive ROE 18% (2024) | Severe losses with net margin -2064%, negative ROIC -83.7%, and negative ROE -199% (2024) |
| Innovation | Stable innovation supporting consistent revenue growth and a favorable economic moat | Innovation improving with growing ROIC but still value destructive overall; profitability increasing from a low base |
| Global presence | Established global player with solid market segments and stable profitability | Smaller, emerging company with limited global footprint and fluctuating revenues |
| Market Share | Significant share in GPS and fitness markets with stable segment growth | Niche or emerging markets with volatile revenue streams and low market penetration |
Key takeaways: Garmin shows strong diversification, solid profitability, and a favorable moat, making it a relatively safer investment. MicroVision remains risky due to heavy losses despite some improving innovation metrics, warranting cautious monitoring before investing.
Risk Analysis
Below is a comparison table highlighting key risks for Garmin Ltd. and MicroVision, Inc. as of 2024:
| Metric | Garmin Ltd. (GRMN) | MicroVision, Inc. (MVIS) |
|---|---|---|
| Market Risk | Moderate (Beta 1.013) | Higher (Beta 1.274) |
| Debt level | Very low (Debt/Equity 0.02) | High (Debt/Equity 1.06) |
| Regulatory Risk | Moderate (Global operations) | Elevated (Tech & automotive lidar regulatory hurdles) |
| Operational Risk | Low (Diverse product lines) | High (Small team, tech development risks) |
| Environmental Risk | Moderate (Hardware industry) | Moderate (Tech manufacturing) |
| Geopolitical Risk | Moderate (European base) | Moderate (US-based, global sales) |
Garmin shows lower financial and operational risks with a strong balance sheet and diversification, while MicroVision faces significant financial distress, high debt, and operational risks. The most impactful risk for MicroVision is its financial instability and technology development challenges, which pose a high default probability.
Which Stock to Choose?
Garmin Ltd. (GRMN) has shown favorable income evolution with 20.44% revenue growth in 2024 and an overall 50.41% increase since 2020. Its profitability ratios are strong, including a 22.41% net margin and 17.98% ROE, supported by low debt and a very favorable rating of A-.
MicroVision, Inc. (MVIS) presents unfavorable income trends, including a -35.31% revenue decline in 2024 and deeply negative profitability metrics, such as a -2063.78% net margin and -198.72% ROE. The company carries higher leverage and a significantly weaker rating of C-, indicating financial distress.
Investors with a risk-averse profile may find Garmin’s stable profitability, strong financial ratios, and favorable rating more appealing, while those with a higher risk tolerance interested in turnaround potential might consider MicroVision despite its current challenges and unfavorable financials.
Disclaimer: Investment carries a risk of loss of initial capital. The past performance is not a reliable indicator of future results. Be sure to understand risks before making an investment decision.
Go Further
I encourage you to read the complete analyses of Garmin Ltd. and MicroVision, Inc. to enhance your investment decisions: