Garmin Ltd. and Mesa Laboratories, Inc. operate in the hardware and technology sectors, each delivering innovative solutions across health, safety, and precision instrumentation markets. Garmin excels in wearable tech and navigation systems, while Mesa focuses on life sciences tools and calibration products. Their overlapping emphasis on quality and technological advancement makes this comparison compelling. Join me as we explore which company presents the most promising opportunity for your investment portfolio.

Table of contents
Companies Overview
I will begin the comparison between Garmin Ltd. and Mesa Laboratories, Inc. by providing an overview of these two companies and their main differences.
Garmin Ltd. Overview
Garmin Ltd. is a Swiss technology company specializing in designing, developing, and manufacturing wireless devices across multiple segments including fitness, outdoor, aviation, marine, and automotive. The company offers a broad portfolio ranging from smartwatches and GPS navigators to avionics and marine electronics. Garmin operates globally, serving markets in the Americas, Asia Pacific, Europe, and beyond, with a market cap of approximately 41.2B USD.
Mesa Laboratories, Inc. Overview
Mesa Laboratories, based in Colorado, USA, develops and sells life sciences tools and quality control products primarily for healthcare and pharmaceutical sectors. Its business segments cover sterilization control, biopharmaceutical development, calibration solutions, and clinical genomics. With a market cap near 466M USD, Mesa targets specialized markets such as hospital sterilization and genomic testing, focusing on high-precision laboratory and diagnostic equipment.
Key similarities and differences
Both companies operate in the technology sector within the hardware and equipment industry, but Garmin has a diversified product range addressing consumer electronics and professional avionics and marine markets. Mesa Laboratories concentrates on niche life sciences and healthcare tools, offering specialized instrumentation and control products. Garmin’s global footprint and large scale contrast with Mesa’s focused, smaller-scale operations targeting medical and laboratory environments.
Income Statement Comparison
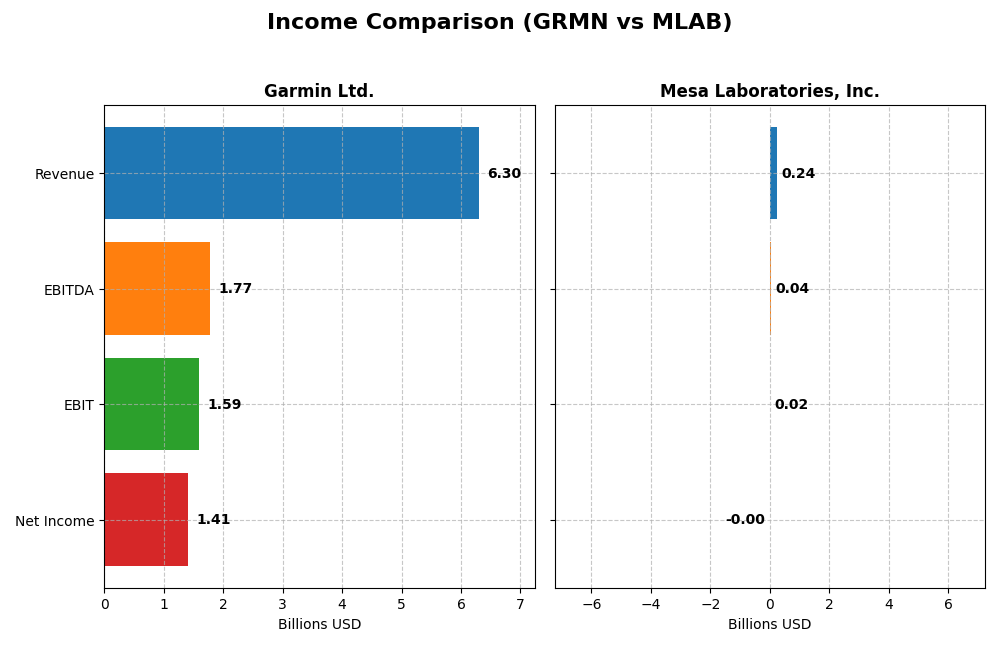
The table below presents a side-by-side comparison of the most recent full fiscal year income statement metrics for Garmin Ltd. and Mesa Laboratories, Inc.
| Metric | Garmin Ltd. (GRMN) | Mesa Laboratories, Inc. (MLAB) |
|---|---|---|
| Market Cap | 41.2B | 466M |
| Revenue | 6.30B | 241M |
| EBITDA | 1.77B | 42M |
| EBIT | 1.59B | 18M |
| Net Income | 1.41B | -2M |
| EPS | 7.35 | -0.36 |
| Fiscal Year | 2024 | 2025 |
Income Statement Interpretations
Garmin Ltd.
Garmin Ltd. showed consistent revenue growth from $4.19B in 2020 to $6.30B in 2024, with net income rising from $992M to $1.41B. Margins remained strong, with a gross margin around 58.7% and an EBIT margin above 25%. The 2024 fiscal year marked a favorable 20.44% revenue increase, though net margin slightly declined by 9.13%.
Mesa Laboratories, Inc.
Mesa Laboratories experienced revenue growth from $134M in 2021 to $241M in 2025, with net income fluctuating and turning negative at -$2M in 2025. Gross margin improved to 62.61%, while EBIT margin was moderate at 7.39%. The latest year showed a positive 11.47% revenue growth and a rebound in net margin, yet overall net income declined over the period.
Which one has the stronger fundamentals?
Garmin Ltd. demonstrates stronger fundamentals with robust revenue and net income growth, high profitability margins, and favorable overall income statement evaluations. Mesa Laboratories, despite revenue growth and improving margins, faces challenges with negative net income recently and weaker net margin trends, indicating less consistent profitability.
Financial Ratios Comparison
The table below presents the most recent financial ratios for Garmin Ltd. and Mesa Laboratories, Inc., providing a snapshot of their operational efficiency, profitability, liquidity, and leverage as of their latest fiscal year.
| Ratios | Garmin Ltd. (2024) | Mesa Laboratories, Inc. (2025) |
|---|---|---|
| ROE | 17.98% | -1.24% |
| ROIC | 16.28% | -1.45% |
| P/E | 28.5 | -326.3 |
| P/B | 5.13 | 4.03 |
| Current Ratio | 3.54 | 0.63 |
| Quick Ratio | 2.56 | 0.47 |
| D/E | 0.021 | 1.14 |
| Debt-to-Assets | 1.69% | 41.88% |
| Interest Coverage | 0 | 1.38 |
| Asset Turnover | 0.65 | 0.56 |
| Fixed Asset Turnover | 4.49 | 7.45 |
| Payout ratio | 40.55% | -175.68% |
| Dividend yield | 1.42% | 0.54% |
Interpretation of the Ratios
Garmin Ltd.
Garmin Ltd. exhibits strong profitability with favorable net margin (22.41%), ROE (17.98%), and ROIC (16.28%). Liquidity ratios show mixed signals: a high current ratio (3.54) but unfavorable, while the quick ratio is favorable at 2.56. Low leverage and infinite interest coverage indicate solid financial health. Dividend yield is neutral at 1.42%, supported by consistent payouts and manageable risks.
Mesa Laboratories, Inc.
Mesa Laboratories shows weak profitability with negative net margin (-0.82%), ROE (-1.24%), and ROIC (-1.45%), signaling operational challenges. Liquidity is low, with current and quick ratios well below 1, and debt levels indicate higher financial risk. Dividend yield is low at 0.54%, reflecting limited shareholder returns amid ongoing losses and possible reinvestment efforts.
Which one has the best ratios?
Garmin Ltd. holds a more favorable overall ratio profile, with a majority of ratios indicating financial strength, profitability, and stability. In contrast, Mesa Laboratories faces multiple unfavorable ratios, particularly in profitability and liquidity, resulting in an unfavorable global ratio evaluation.
Strategic Positioning
This section compares the strategic positioning of Garmin Ltd. and Mesa Laboratories, Inc. including market position, key segments, and exposure to technological disruption:
Garmin Ltd.
- Large market cap with broad global presence, competing in diverse technology hardware segments.
- Diverse segments including Outdoor, Fitness, Marine, Aviation, and Automotive Mobile business.
- Exposure to innovation in wireless devices, avionics, and wearable tech, facing evolving tech trends.
Mesa Laboratories, Inc.
- Smaller market cap focused on niche life sciences and quality control products, with less competitive pressure.
- Concentrated segments in Sterilization Control, Biopharmaceutical Development, Calibration Solutions, Clinical Genomics.
- Focus on specialized laboratory and genomic tools, with moderate technological disruption risk in medical fields.
Garmin Ltd. vs Mesa Laboratories, Inc. Positioning
Garmin adopts a diversified approach spanning multiple hardware segments globally, providing broad market exposure. Mesa Laboratories concentrates on specialized life sciences tools and services, limiting scale but focusing on niche expertise and specific verticals.
Which has the best competitive advantage?
Garmin shows a favorable moat with value creation and stable profitability. Mesa Laboratories has a very unfavorable moat, shedding value with declining profitability, indicating Garmin holds a stronger competitive advantage based on ROIC versus WACC analysis.
Stock Comparison
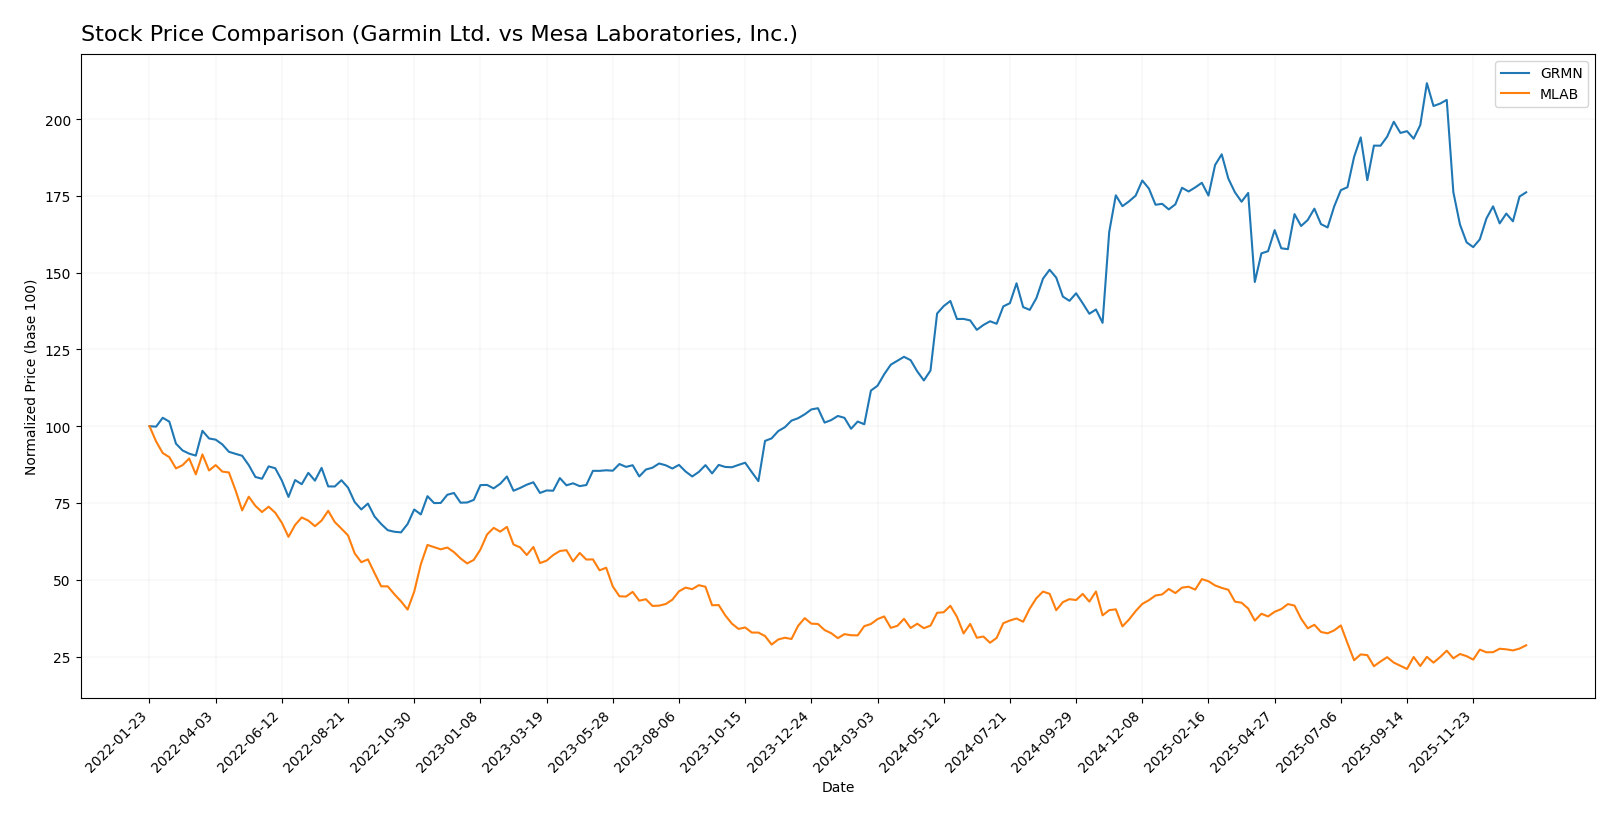
The stock price dynamics over the past 12 months reveal contrasting trajectories, with Garmin Ltd. showing strong bullish momentum and Mesa Laboratories, Inc. experiencing a bearish trend, highlighting divergent market performances.
Trend Analysis
Garmin Ltd. (GRMN) exhibited a 57.86% price increase over the past year, marking a bullish trend with accelerating momentum and high volatility, reaching a peak price of 257.06.
Mesa Laboratories, Inc. (MLAB) faced a 19.46% decline over the same period, indicating a bearish trend despite recent acceleration and a modest price rebound since November 2025.
Comparing both, Garmin Ltd. delivered superior market performance with a significant positive return, while Mesa Laboratories showed a negative overall trend, reflecting divergent investor sentiment.
Target Prices
Analysts provide a clear consensus on target prices for Garmin Ltd. and Mesa Laboratories, Inc.
| Company | Target High | Target Low | Consensus |
|---|---|---|---|
| Garmin Ltd. | 310 | 193 | 237 |
| Mesa Laboratories, Inc. | 83 | 83 | 83 |
Garmin’s target consensus at 237 suggests moderate upside potential from its current price of 213.93 USD. Mesa Laboratories’ consensus target matches closely with its current price of 84.36 USD, indicating a stable valuation outlook.
Analyst Opinions Comparison
This section compares analysts’ ratings and grades for Garmin Ltd. and Mesa Laboratories, Inc.:
Rating Comparison
Garmin Ltd. Rating
- Rating: A-, indicating a very favorable overall assessment.
- Discounted Cash Flow Score: 3 (Moderate valuation outlook).
- ROE Score: 4, reflecting efficient profit generation.
- ROA Score: 5, demonstrating very effective asset utilization.
- Debt To Equity Score: 4, suggesting favorable financial risk.
- Overall Score: 4, a favorable summary of financial health.
Mesa Laboratories, Inc. Rating
- Rating: C+, showing a very favorable but lower overall rating.
- Discounted Cash Flow Score: 5 (Very favorable valuation outlook).
- ROE Score: 1, indicating very unfavorable profit efficiency.
- ROA Score: 1, showing very unfavorable asset utilization.
- Debt To Equity Score: 1, indicating very unfavorable financial risk.
- Overall Score: 2, a moderate financial standing.
Which one is the best rated?
Garmin Ltd. holds a stronger overall rating and better scores in ROE, ROA, and debt-to-equity, while Mesa Laboratories scores higher only in discounted cash flow valuation. Garmin is better rated based on available data.
Scores Comparison
Here is a comparison of the Altman Z-Score and Piotroski Score for Garmin Ltd. and Mesa Laboratories, Inc.:
Garmin Ltd. Scores
- Altman Z-Score: 14.62, indicating a safe zone from bankruptcy risk.
- Piotroski Score: 5, representing an average financial strength.
Mesa Laboratories, Inc. Scores
- Altman Z-Score: 1.36, indicating a distress zone with high bankruptcy risk.
- Piotroski Score: 5, representing an average financial strength.
Which company has the best scores?
Based on the provided scores, Garmin Ltd. shows a significantly stronger Altman Z-Score, placing it in a safe zone, while Mesa Laboratories is in the distress zone. Both companies have the same average Piotroski Score.
Grades Comparison
Here is a detailed comparison of the latest available grades for Garmin Ltd. and Mesa Laboratories, Inc.:
Garmin Ltd. Grades
The table below summarizes recent grades issued by recognized financial institutions for Garmin Ltd.:
| Grading Company | Action | New Grade | Date |
|---|---|---|---|
| Tigress Financial | Maintain | Strong Buy | 2025-12-19 |
| Longbow Research | Upgrade | Buy | 2025-12-03 |
| Barclays | Maintain | Underweight | 2025-10-30 |
| Morgan Stanley | Maintain | Underweight | 2025-10-30 |
| Tigress Financial | Maintain | Strong Buy | 2025-09-30 |
Garmin’s grades show a mixed but generally cautious outlook, with strong buy ratings from Tigress Financial contrasting with underweight ratings from Barclays and Morgan Stanley.
Mesa Laboratories, Inc. Grades
The table below summarizes recent grades issued by recognized financial institutions for Mesa Laboratories, Inc.:
| Grading Company | Action | New Grade | Date |
|---|---|---|---|
| Wells Fargo | Maintain | Equal Weight | 2025-12-15 |
| Wells Fargo | Upgrade | Equal Weight | 2025-08-08 |
| Wells Fargo | Maintain | Underweight | 2025-05-30 |
| Evercore ISI Group | Maintain | Outperform | 2024-10-01 |
Mesa Laboratories’ ratings trend around a neutral to moderately positive stance, with consistent “Outperform” ratings from Evercore ISI Group and a recent upgrade to equal weight by Wells Fargo.
Which company has the best grades?
Both companies have consensus ratings of “Hold,” but Garmin Ltd. has received more polarized grades, including some strong buy ratings. Mesa Laboratories shows steadier, moderately positive ratings. This divergence may influence investor perceptions of risk and growth potential differently.
Strengths and Weaknesses
Below is a comparative table outlining the key strengths and weaknesses of Garmin Ltd. (GRMN) and Mesa Laboratories, Inc. (MLAB) based on their latest financial and operational data.
| Criterion | Garmin Ltd. (GRMN) | Mesa Laboratories, Inc. (MLAB) |
|---|---|---|
| Diversification | Highly diversified across Automotive Mobile, Aviation, Fitness, Marine, and Outdoor segments with multi-billion revenues in each. | Less diversified; revenue mainly from Product and Service lines, with some biopharmaceutical and calibration solutions. |
| Profitability | Strong profitability: net margin 22.41%, ROIC 16.28%, ROE 17.98%. | Negative profitability: net margin -0.82%, ROIC -1.45%, ROE -1.24%. |
| Innovation | Consistent investment in innovation maintaining a favorable economic moat and stable profitability. | Declining ROIC and profitability indicate challenges in sustaining innovation and competitive advantage. |
| Global presence | Global footprint supported by diverse product lines serving multiple industries worldwide. | More niche market presence; limited global scale compared to Garmin. |
| Market Share | Solid market share in fitness and outdoor segments with strong brand recognition. | Smaller market share and less competitive positioning reflected by financial struggles. |
Garmin Ltd. demonstrates significant strengths in diversification, profitability, and global presence, maintaining a favorable economic moat. In contrast, Mesa Laboratories shows financial and operational weaknesses, including declining profitability and limited diversification, posing higher investment risks.
Risk Analysis
Below is a comparative table presenting key risk factors for Garmin Ltd. (GRMN) and Mesa Laboratories, Inc. (MLAB) based on the most recent data available.
| Metric | Garmin Ltd. (GRMN) | Mesa Laboratories, Inc. (MLAB) |
|---|---|---|
| Market Risk | Moderate (Beta 1.01) | Lower (Beta 0.89) |
| Debt level | Very Low (D/E 0.02) | High (D/E 1.14) |
| Regulatory Risk | Moderate | Moderate |
| Operational Risk | Moderate | Moderate |
| Environmental Risk | Moderate | Moderate |
| Geopolitical Risk | Moderate (Global Ops) | Moderate (US-based) |
Garmin shows low financial leverage and solid operational performance, lowering bankruptcy risk (Altman Z-Score 14.6, safe zone). However, its valuations (PE and PB ratios) appear stretched, which may impact market risk. Mesa Labs faces higher financial risk due to significant debt and weak profitability, placing it in the distress zone (Altman Z-Score 1.36). Its operational and market risks are more contained but financial instability is a notable concern.
Which Stock to Choose?
Garmin Ltd. (GRMN) shows steady income growth with a 50.41% revenue increase over five years, strong profitability indicated by a 22.41% net margin, and low debt levels reflected in a 0.02 debt-to-equity ratio. Its financial ratios are mostly favorable, supported by a very favorable rating A-, and a safe-zone Altman Z-Score of 14.62. The company’s ROIC exceeds its WACC by 7.77%, signaling value creation and stable profitability.
Mesa Laboratories, Inc. (MLAB) presents mixed financials with 79.92% revenue growth over five years but negative net margin at -0.82%, and elevated debt as the debt-to-equity ratio stands at 1.14. Its financial ratios are largely unfavorable, despite a very favorable overall rating C+, the Altman Z-Score at 1.36 places it in the distress zone. The company’s ROIC is well below WACC, indicating value destruction and declining profitability.
For investors prioritizing financial stability and consistent value creation, Garmin’s strong ratings and income profile might appear more favorable. Conversely, those with higher risk tolerance seeking potential growth opportunities could interpret Mesa’s improving revenue trend and recent positive price momentum as worth monitoring. The choice could depend on the investor’s appetite for risk and investment strategy.
Disclaimer: Investment carries a risk of loss of initial capital. The past performance is not a reliable indicator of future results. Be sure to understand risks before making an investment decision.
Go Further
I encourage you to read the complete analyses of Garmin Ltd. and Mesa Laboratories, Inc. to enhance your investment decisions: