Garmin Ltd. and Keysight Technologies, Inc. are two prominent players in the hardware and equipment sector, each driving innovation in distinct yet overlapping technology markets. Garmin specializes in GPS-based devices across fitness, outdoor, aviation, marine, and automotive applications, while Keysight focuses on electronic design and test solutions for communications, aerospace, and semiconductor industries. This comparison aims to clarify which company offers the most compelling investment opportunity in today’s dynamic tech landscape. Let’s explore which stock deserves a place in your portfolio.
Table of contents
Companies Overview
I will begin the comparison between Garmin Ltd. and Keysight Technologies, Inc. by providing an overview of these two companies and their main differences.
Garmin Overview
Garmin Ltd. is a Swiss technology company focused on designing, developing, manufacturing, marketing, and distributing wireless devices globally. Its product range includes fitness and outdoor watches, aviation avionics, marine navigation, and automotive infotainment systems. Garmin operates across multiple segments, leveraging web and mobile platforms to enhance user connectivity and experience in fitness, outdoor, aviation, marine, and automotive markets.
Keysight Overview
Keysight Technologies, Inc. is a U.S.-based technology firm delivering electronic design and test solutions to industries such as communications, aerospace, defense, automotive, and semiconductors. Its offerings include electronic design automation software, RF and microwave test equipment, and industrial test products. Keysight supports customers through direct sales and partnerships, providing product support, training, and consulting to enhance design and testing capabilities globally.
Key similarities and differences
Both Garmin and Keysight operate in the technology sector with a focus on hardware and equipment, serving global markets. Garmin emphasizes consumer and professional wireless devices across fitness, outdoor, aviation, marine, and automotive segments, while Keysight specializes in electronic design and testing solutions primarily for industrial and commercial clients. Their business models differ in product scope and target industries, with Garmin focusing on end-user devices and Keysight on design and test infrastructure.
Income Statement Comparison
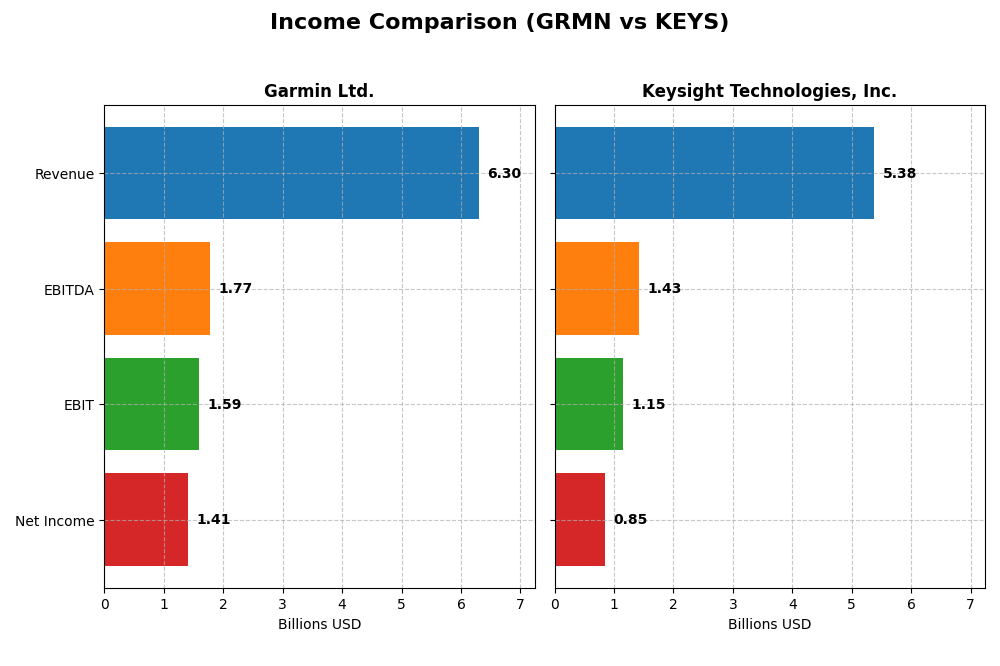
This table presents a side-by-side comparison of key income statement metrics for Garmin Ltd. and Keysight Technologies, Inc. based on their most recent fiscal years.
| Metric | Garmin Ltd. (GRMN) | Keysight Technologies, Inc. (KEYS) |
|---|---|---|
| Market Cap | 41.2B USD | 36.0B USD |
| Revenue | 6.30B USD | 5.38B USD |
| EBITDA | 1.77B USD | 1.43B USD |
| EBIT | 1.59B USD | 1.15B USD |
| Net Income | 1.41B USD | 846M USD |
| EPS | 7.35 USD | 4.90 USD |
| Fiscal Year | 2024 | 2025 |
Income Statement Interpretations
Garmin Ltd.
Garmin Ltd. demonstrated strong revenue growth of 50.4% from 2020 to 2024, with net income rising 42.2% over the same period. Margins are generally favorable, with a gross margin of 58.7% and EBIT margin of 25.3%, although net margin slightly declined by 5.4%. In 2024, revenue grew 20.4% and EBIT surged nearly 46%, while net margin dipped marginally, reflecting solid operational leverage.
Keysight Technologies, Inc.
Keysight Technologies showed moderate revenue growth of 8.8% from 2021 to 2025, with net income decreasing by 5.4% over the period. Margins remain favorable, with a gross margin of 62.1% and EBIT margin of 21.4%, alongside a net margin of 15.7%. The latest fiscal year recorded a 7.95% revenue increase and a robust 21.2% EBIT growth, accompanied by a notable 27.6% net margin improvement.
Which one has the stronger fundamentals?
Both companies exhibit favorable income statement fundamentals, with Garmin showing stronger revenue and net income growth and higher EBIT margins. Keysight maintains a higher gross margin but faces declining net income over the overall period. Garmin’s more significant growth and margin stability suggest comparatively stronger fundamentals, despite slight recent net margin compression.
Financial Ratios Comparison
This table presents the most recent key financial ratios for Garmin Ltd. (GRMN) and Keysight Technologies, Inc. (KEYS) based on their latest fiscal year data.
| Ratios | Garmin Ltd. (2024) | Keysight Technologies (2025) |
|---|---|---|
| ROE | 17.98% | 14.40% |
| ROIC | 16.28% | 7.98% |
| P/E | 28.5 | 37.41 |
| P/B | 5.13 | 5.39 |
| Current Ratio | 3.54 | 2.35 |
| Quick Ratio | 2.56 | 1.78 |
| D/E (Debt-to-Equity) | 0.021 | 0.51 |
| Debt-to-Assets | 1.69% | 26.31% |
| Interest Coverage | 0 (not reported) | 9.88 |
| Asset Turnover | 0.65 | 0.48 |
| Fixed Asset Turnover | 4.49 | 5.21 |
| Payout ratio | 40.55% | 0% |
| Dividend yield | 1.42% | 0% |
Interpretation of the Ratios
Garmin Ltd.
Garmin’s financial ratios are generally strong, with favorable net margin (22.41%), ROE (17.98%), and ROIC (16.28%). Concerns include an unfavorable P/E of 28.5, high P/B at 5.13, and a current ratio of 3.54, indicating potential overcapitalization. The company pays dividends with a moderate yield of 1.42%, supported by free cash flow, suggesting sustainable shareholder returns.
Keysight Technologies, Inc.
Keysight shows mixed ratio strength, with a favorable net margin of 15.74% and solid interest coverage at 11.98. However, ROE and ROIC are neutral, and P/E and P/B ratios are unfavorable at 37.41 and 5.39 respectively. The company does not pay dividends, likely focusing on reinvestment and R&D to sustain growth, consistent with its slightly favorable overall ratio evaluation.
Which one has the best ratios?
Garmin Ltd. exhibits a higher proportion of favorable ratios (57.14%) compared to Keysight’s 42.86%, with stronger profitability and capital structure metrics. Keysight’s higher leverage and mixed profitability indicators weigh on its profile. Overall, Garmin’s ratios present a more favorable financial position for investors considering stability and dividend payments.
Strategic Positioning
This section compares the strategic positioning of Garmin Ltd. and Keysight Technologies, Inc. regarding Market position, Key segments, and Exposure to technological disruption:
Garmin Ltd.
- Established market position in hardware with moderate competitive pressure, market cap of 41B USD.
- Diverse segments including Fitness, Outdoor, Marine, Aviation, and Automotive Mobile driving revenues.
- Exposure through integration of cutting-edge avionics and connectivity, moderate disruption risk.
Keysight Technologies, Inc.
- Large market presence in electronic design and test solutions, market cap of 36B USD, facing high competition.
- Focused on Communications and Electronic Industrial Solutions segments, key drivers in test and measurement tools.
- High exposure to technological disruption due to rapid innovation in electronic design and communication tools.
Garmin Ltd. vs Keysight Technologies, Inc. Positioning
Garmin Ltd. employs a diversified business model across multiple segments, providing stable revenue streams but facing moderate disruption. Keysight concentrates on electronic design and test equipment, with greater susceptibility to rapid technological changes but focused expertise in its sectors.
Which has the best competitive advantage?
Garmin Ltd. shows a favorable moat with ROIC exceeding WACC by 7.77%, indicating value creation and stable profitability. Keysight Technologies exhibits a very unfavorable moat with declining ROIC, suggesting value destruction and weakening competitive advantage.
Stock Comparison
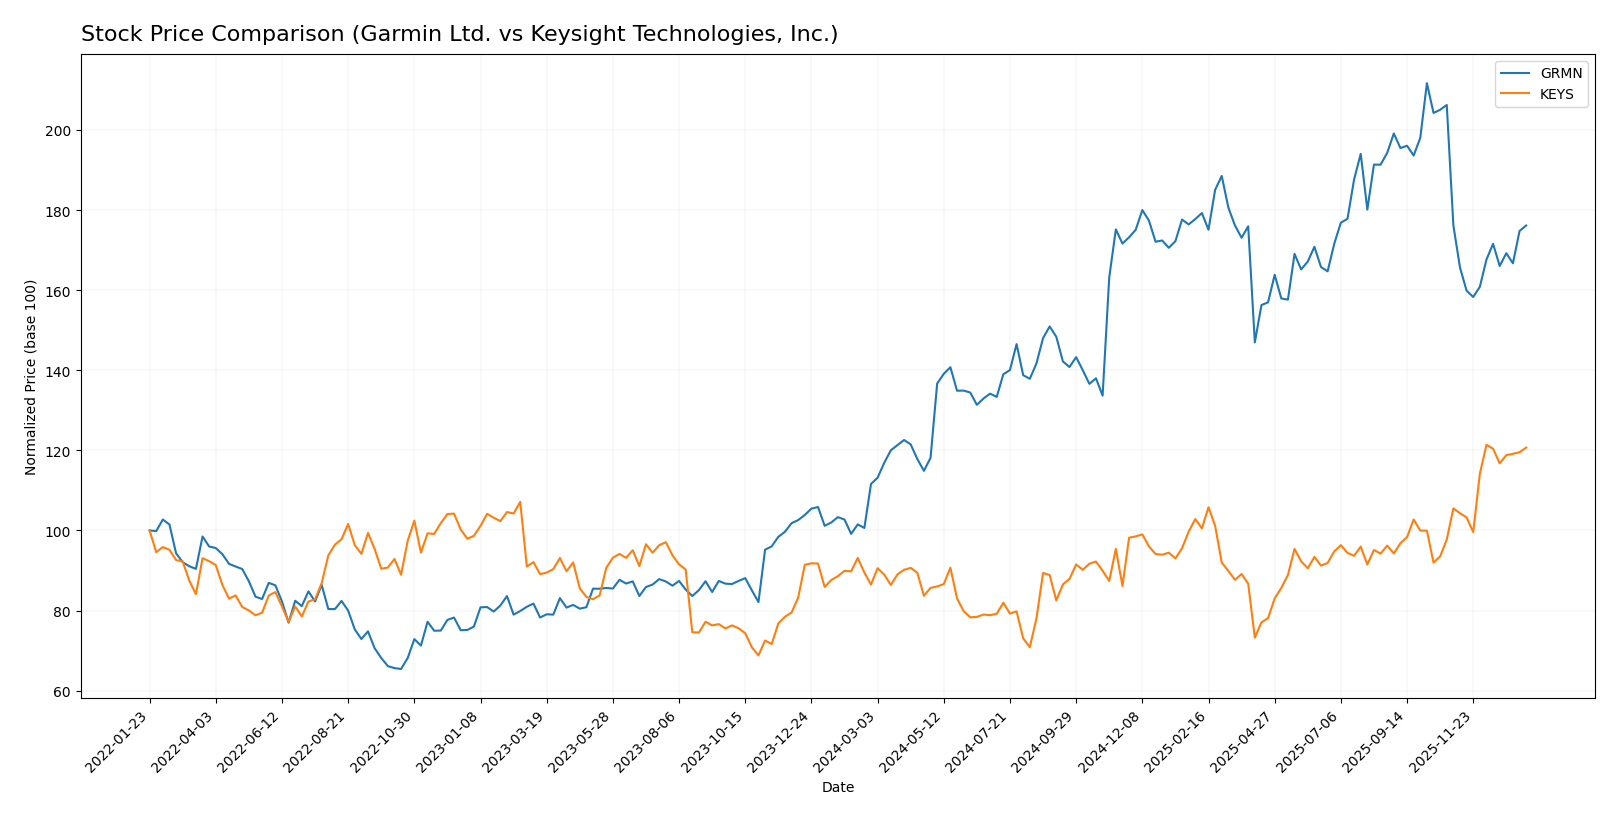
The stock price movements of Garmin Ltd. and Keysight Technologies, Inc. over the past year reveal distinct bullish trends marked by notable price appreciations and differing recent trading dynamics.
Trend Analysis
Garmin Ltd. shows a bullish trend with a 57.86% price increase over the past year, accompanied by accelerating momentum and a high volatility level indicated by a 29.55 std deviation. The stock reached a high of 257.06 and a low of 135.51.
Keysight Technologies, Inc. also exhibits a bullish trend with a 39.56% price increase and accelerating momentum. Its volatility is lower than Garmin’s, with an 18.51 std deviation, reaching a high of 210.49 and a low of 122.87.
Comparing both, Garmin Ltd. delivered the highest market performance with a larger overall price increase, despite recent neutral short-term movement, while Keysight maintains positive recent momentum.
Target Prices
The consensus target prices for Garmin Ltd. and Keysight Technologies, Inc. indicate moderate upside potential for both stocks.
| Company | Target High | Target Low | Consensus |
|---|---|---|---|
| Garmin Ltd. | 310 | 193 | 237 |
| Keysight Technologies, Inc. | 232 | 210 | 225.13 |
Analysts expect Garmin’s stock to trade above its current price of $213.93, with a consensus target of $237, suggesting moderate growth. Keysight’s consensus target of $225.13 also points to modest upside from its current price of $209.30.
Analyst Opinions Comparison
This section compares analysts’ ratings and grades for Garmin Ltd. and Keysight Technologies, Inc.:
Rating Comparison
Garmin Ltd. Rating
- Rating: A- indicating a very favorable overall assessment.
- Discounted Cash Flow Score: 3, showing a moderate appraisal of future cash flows.
- ROE Score: 4, favorable efficiency in generating profit from equity.
- ROA Score: 5, very favorable utilization of assets to generate earnings.
- Debt To Equity Score: 4, indicating favorable financial risk management.
- Overall Score: 4, reflecting a favorable summary of the company’s financial standing.
Keysight Technologies, Inc. Rating
- Rating: B also indicating a very favorable overall assessment.
- Discounted Cash Flow Score: 3, reflecting a moderate view on future cash flows.
- ROE Score: 4, also favorable in profit generation from shareholders’ equity.
- ROA Score: 4, favorable asset utilization for earnings.
- Debt To Equity Score: 2, showing a moderate level of financial risk.
- Overall Score: 3, reflecting a moderate summary of the company’s financial standing.
Which one is the best rated?
Garmin Ltd. holds higher overall and asset utilization scores, plus better debt management, compared to Keysight, which scores lower on financial risk and overall assessment. Based strictly on these metrics, Garmin is better rated.
Scores Comparison
Here is the comparison of the Altman Z-Score and Piotroski Score for Garmin Ltd. and Keysight Technologies, Inc.:
Garmin Ltd. Scores
- Altman Z-Score: 14.6, indicating a strong safe zone.
- Piotroski Score: 5, reflecting an average financial health.
Keysight Technologies Scores
- Altman Z-Score: 5.9, also in a safe zone but lower.
- Piotroski Score: 4, showing an average financial health.
Which company has the best scores?
Garmin Ltd. has a significantly higher Altman Z-Score, indicating stronger financial stability compared to Keysight. Both companies have average Piotroski Scores, with Garmin slightly ahead by one point.
Grades Comparison
I present below the recent grades from reputable financial institutions for both Garmin Ltd. and Keysight Technologies, Inc.:
Garmin Ltd. Grades
The following table summarizes recent ratings for Garmin Ltd. from recognized grading companies:
| Grading Company | Action | New Grade | Date |
|---|---|---|---|
| Tigress Financial | Maintain | Strong Buy | 2025-12-19 |
| Longbow Research | Upgrade | Buy | 2025-12-03 |
| Barclays | Maintain | Underweight | 2025-10-30 |
| Morgan Stanley | Maintain | Underweight | 2025-10-30 |
| Tigress Financial | Maintain | Strong Buy | 2025-09-30 |
| Morgan Stanley | Maintain | Underweight | 2025-09-19 |
| Morgan Stanley | Maintain | Underweight | 2025-07-31 |
| Barclays | Maintain | Underweight | 2025-07-31 |
| JP Morgan | Maintain | Neutral | 2025-07-17 |
| JP Morgan | Maintain | Neutral | 2025-05-01 |
Garmin Ltd.’s ratings reveal a polarized view, with Tigress Financial favoring a strong buy, while Morgan Stanley and Barclays maintain an underweight stance.
Keysight Technologies, Inc. Grades
Below are recent ratings for Keysight Technologies, Inc. from established grading companies:
| Grading Company | Action | New Grade | Date |
|---|---|---|---|
| Morgan Stanley | Maintain | Equal Weight | 2025-12-17 |
| Jefferies | Maintain | Hold | 2025-12-10 |
| Baird | Maintain | Outperform | 2025-11-26 |
| Barclays | Maintain | Overweight | 2025-11-25 |
| JP Morgan | Maintain | Overweight | 2025-11-25 |
| Jefferies | Maintain | Hold | 2025-11-25 |
| Citigroup | Maintain | Buy | 2025-11-25 |
| UBS | Maintain | Buy | 2025-11-25 |
| Wells Fargo | Maintain | Overweight | 2025-11-25 |
| Susquehanna | Maintain | Positive | 2025-11-25 |
Grades for Keysight Technologies mostly indicate positive sentiment, with multiple overweight and buy ratings, and no downgrades recorded.
Which company has the best grades?
Keysight Technologies holds a stronger consensus with predominantly buy and overweight grades, reflecting more bullish investor sentiment compared to Garmin Ltd., whose grades show significant divergence including underweight opinions. This divergence may influence investors’ risk assessments and portfolio allocation decisions accordingly.
Strengths and Weaknesses
Below is a comparison of key strengths and weaknesses for Garmin Ltd. (GRMN) and Keysight Technologies, Inc. (KEYS) based on their recent financial performance and market position.
| Criterion | Garmin Ltd. (GRMN) | Keysight Technologies, Inc. (KEYS) |
|---|---|---|
| Diversification | Strong product diversification across Automotive Mobile, Aviation, Fitness, Marine, and Outdoor segments with balanced revenue streams. | Moderate diversification with two main segments: Communications Solutions and Electronic Industrial Solutions. |
| Profitability | High profitability with a net margin of 22.41% and ROIC at 16.28%, outperforming WACC, creating shareholder value. | Moderate profitability; net margin at 15.74% but ROIC at 7.98% below WACC, indicating value erosion. |
| Innovation | Consistent investment in product innovation supporting stable ROIC and competitive advantage. | Innovation efforts present but declining ROIC trend suggests challenges in sustaining competitive edge. |
| Global presence | Established global reach with diversified markets in fitness, automotive, and outdoor sectors. | Global market presence primarily in technology and industrial solutions, with growing but volatile demand. |
| Market Share | Solid market share supported by competitive moat and favorable financial ratios. | Market share under pressure due to declining profitability and unfavorable valuation multiples. |
Garmin demonstrates a strong economic moat with diversified revenue and consistent value creation, making it a favorable investment. In contrast, Keysight faces profitability challenges and a declining ROIC trend, signaling caution despite some favorable financial metrics.
Risk Analysis
Below is a comparative table of key risks for Garmin Ltd. (GRMN) and Keysight Technologies, Inc. (KEYS) based on the most recent financial and market data available in 2026:
| Metric | Garmin Ltd. (GRMN) | Keysight Technologies, Inc. (KEYS) |
|---|---|---|
| Market Risk | Beta 1.01, moderate volatility | Beta 1.18, higher volatility |
| Debt level | Very low debt-to-equity 0.02 (favorable) | Moderate debt-to-equity 0.51 (neutral) |
| Regulatory Risk | Moderate, tech sector compliance | Moderate, diverse regulatory environments |
| Operational Risk | Global supply chain dependencies | High tech complexity and innovation pace |
| Environmental Risk | Moderate, global manufacturing footprint | Moderate, with increasing sustainability focus |
| Geopolitical Risk | Exposure to Asia-Pacific and Europe | US-based but global operations, some exposure |
Garmin’s low debt and stable beta indicate lower financial and market risks compared to Keysight, which shows higher leverage and volatility. Both face operational and regulatory risks typical for tech hardware firms, but geopolitical tensions and supply chain disruptions remain the most impactful uncertainties. Caution is advised, especially for Keysight due to its higher market sensitivity and debt.
Which Stock to Choose?
Garmin Ltd. (GRMN) shows strong income growth with a 20.44% revenue increase in 2024 and a favorable profitability profile, including a 22.41% net margin and high returns on equity and invested capital. Its financial ratios are largely favorable, supported by low debt levels and a very favorable A- rating, indicating robust financial health and value creation.
Keysight Technologies, Inc. (KEYS) presents moderate income growth of 7.95% in 2025 with favorable profitability metrics like a 15.74% net margin, though returns on capital are neutral to slightly favorable. Its financial ratios reveal some challenges with higher debt and mixed valuation metrics, but it maintains a very favorable B rating reflective of stable but less pronounced financial strength.
For investors prioritizing value creation and stable profitability, Garmin’s strong rating and consistent income and ratio performance might appear more suitable. Conversely, those with a tolerance for moderate growth and exposure to a company with improving income trends could find Keysight’s profile slightly favorable, reflecting differing risk and growth appetites.
Disclaimer: Investment carries a risk of loss of initial capital. The past performance is not a reliable indicator of future results. Be sure to understand risks before making an investment decision.
Go Further
I encourage you to read the complete analyses of Garmin Ltd. and Keysight Technologies, Inc. to enhance your investment decisions: