Garmin Ltd. and Jabil Inc. are both key players in the hardware and equipment sector, yet they operate with distinct business models and market focuses. Garmin excels in wireless devices and specialized navigation technology, while Jabil leads in electronics manufacturing services across diverse industries. Their shared innovation-driven approach and industry overlap make them compelling subjects for comparison. In this article, I will help you decide which company presents the most attractive investment opportunity today.
Table of contents
Companies Overview
I will begin the comparison between Garmin Ltd. and Jabil Inc. by providing an overview of these two companies and their main differences.
Garmin Ltd. Overview
Garmin Ltd. designs, develops, manufactures, markets, and distributes wireless devices globally, focusing on fitness, outdoor, aviation, marine, and automotive segments. The company offers diverse products such as running watches, avionics solutions, and marine electronics. Based in Switzerland, Garmin operates in the technology sector with a market cap of $41.2B and employs 21,800 people.
Jabil Inc. Overview
Jabil Inc. provides comprehensive manufacturing services worldwide, specializing in electronics design, production, and product management across two segments: Electronics Manufacturing Services and Diversified Manufacturing Services. Headquartered in Florida, Jabil serves multiple industries including 5G, automotive, and healthcare. It has a market cap of $25.5B and employs 138,000 people in the technology sector.
Key similarities and differences
Both Garmin and Jabil operate in the technology sector within hardware and equipment industries, but Garmin focuses on developing branded wireless devices across consumer and professional markets, while Jabil offers contract manufacturing and design services to diverse industries. Garmin’s business model centers on product innovation and direct sales, whereas Jabil operates as a service provider specializing in manufacturing and supply chain solutions.
Income Statement Comparison
The table below compares the most recent fiscal year income statement metrics for Garmin Ltd. and Jabil Inc., providing a snapshot of their financial performance.

| Metric | Garmin Ltd. (GRMN) | Jabil Inc. (JBL) |
|---|---|---|
| Market Cap | 41.2B | 25.5B |
| Revenue | 6.30B | 29.8B |
| EBITDA | 1.77B | 1.81B |
| EBIT | 1.59B | 1.14B |
| Net Income | 1.41B | 657M |
| EPS | 7.35 | 6.00 |
| Fiscal Year | 2024 | 2025 |
Income Statement Interpretations
Garmin Ltd.
Garmin Ltd. demonstrated strong revenue growth from 2020 to 2024, rising from $4.19B to $6.30B, with net income increasing from $992M to $1.41B. Margins remained robust, including a favorable gross margin of 58.7% and an EBIT margin of 25.31%. The 2024 fiscal year showed a healthy 20.44% revenue growth and a 45.95% jump in EBIT, though net margin declined slightly by 9.13%.
Jabil Inc.
Jabil’s revenue showed modest growth from $29.3B in 2021 to $29.8B in 2025, while net income declined from $696M to $657M over the same period. Margins were relatively weak, with a gross margin of 8.88% and a net margin of 2.2%, both rated neutral. The latest year saw a small 3.18% revenue increase, but EBIT fell by 40.96% and net margin dropped sharply by 54.13%.
Which one has the stronger fundamentals?
Garmin Ltd. displays stronger fundamentals, supported by consistent revenue and net income growth, high and stable margins, and favorable profitability metrics. In contrast, Jabil faces challenges with flat revenue, declining net income, and weaker margins. Garmin’s overall income statement evaluation is favorable, whereas Jabil’s is unfavorable, signaling a divergence in financial health and operational efficiency.
Financial Ratios Comparison
The table below presents a side-by-side comparison of key financial ratios for Garmin Ltd. and Jabil Inc. based on their most recent fiscal year data.
| Ratios | Garmin Ltd. (2024) | Jabil Inc. (2025) |
|---|---|---|
| ROE | 17.98% | 43.42% |
| ROIC | 16.28% | 16.06% |
| P/E | 28.5 | 34.14 |
| P/B | 5.13 | 14.82 |
| Current Ratio | 3.54 | 1.00 |
| Quick Ratio | 2.56 | 0.66 |
| D/E | 0.02 | 2.22 |
| Debt-to-Assets | 1.69% | 18.15% |
| Interest Coverage | 0 (not reported) | 4.84 |
| Asset Turnover | 0.65 | 1.61 |
| Fixed Asset Turnover | 4.49 | 9.01 |
| Payout ratio | 40.55% | 5.48% |
| Dividend yield | 1.42% | 0.16% |
Interpretation of the Ratios
Garmin Ltd.
Garmin Ltd. shows predominantly favorable financial ratios, including strong net margin (22.41%) and return on equity (17.98%), alongside a low debt-to-equity ratio (0.02), signaling solid financial health. However, some ratios like price-to-earnings (28.5) and price-to-book (5.13) appear stretched. The company pays a dividend with a moderate yield of 1.42%, supported by free cash flow coverage, indicating a sustainable shareholder return policy.
Jabil Inc.
Jabil Inc. presents mixed ratio results. While return on equity is very strong at 43.42%, net margin is weak at 2.2%, and leverage ratios such as debt-to-equity (2.22) raise concerns. The current and quick ratios suggest liquidity constraints. Jabil pays a low dividend yield of 0.16%, which appears less supported by cash flow, reflecting cautious distribution amid operational challenges and reinvestment focus.
Which one has the best ratios?
Garmin Ltd. holds a more favorable overall ratio profile with balanced profitability, liquidity, and leverage metrics. Jabil Inc.’s ratios reveal strengths in equity returns but are offset by weaker margins and higher leverage, suggesting greater financial risk. Thus, Garmin’s ratios generally indicate a stronger financial position relative to Jabil.
Strategic Positioning
This section compares the strategic positioning of Garmin Ltd. and Jabil Inc. regarding market position, key segments, and exposure to technological disruption:
Garmin Ltd.
- Strong market position with diverse hardware products, facing moderate competitive pressure.
- Focuses on fitness, outdoor, aviation, marine, and automotive segments driving diversified sales.
- Moderate exposure to disruption through innovation in wearable and avionics technologies.
Jabil Inc.
- Large electronics manufacturing services provider with higher competitive pressure and beta.
- Operates in Electronics and Diversified Manufacturing Services across multiple industrial sectors.
- High exposure to technological disruption due to reliance on advanced electronics manufacturing.
Garmin Ltd. vs Jabil Inc. Positioning
Garmin follows a diversified product strategy across fitness, outdoor, marine, aviation, and automotive markets, offering stability but moderate disruption risk. Jabil concentrates on manufacturing services in electronics and industrial sectors, benefiting from growing ROIC but facing higher market volatility.
Which has the best competitive advantage?
Jabil exhibits a very favorable moat with growing ROIC, indicating a durable competitive advantage and increasing profitability. Garmin also creates value with a favorable moat but shows a neutral ROIC trend, suggesting a less dynamic competitive position.
Stock Comparison
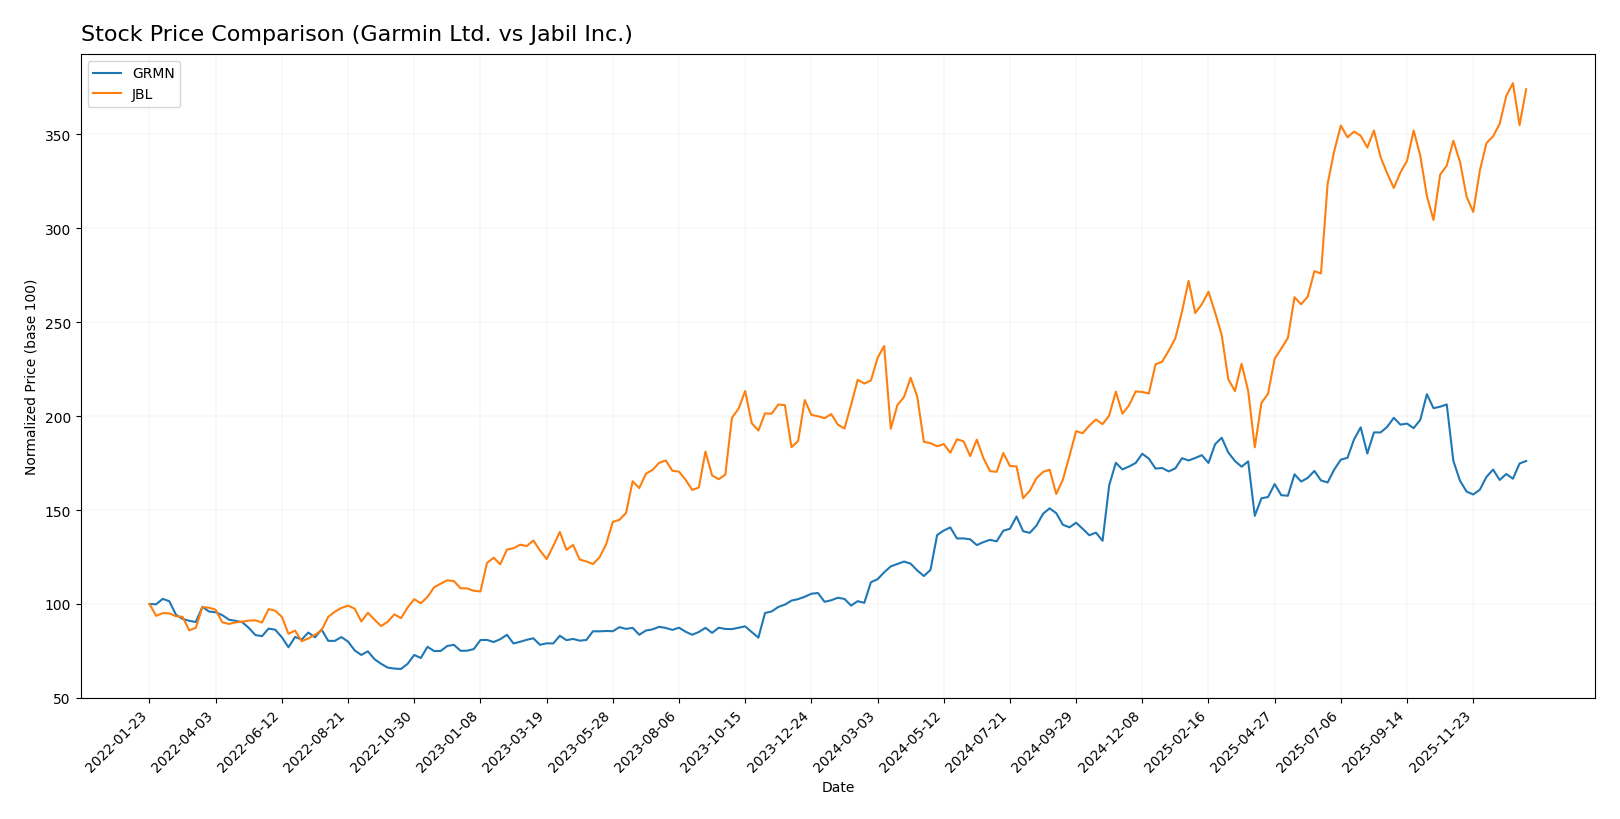
The stock price movements of Garmin Ltd. and Jabil Inc. over the past 12 months exhibit strong bullish trends with notable acceleration phases, reflecting substantial gains and dynamic trading activity.
Trend Analysis
Garmin Ltd. has experienced a 57.86% price increase over the past year, marking a bullish trend with accelerating growth. The stock’s volatility is reflected in a 29.55 standard deviation, peaking at 257.06 and bottoming at 135.51.
Jabil Inc. shows a 70.84% price rise over the same period, also indicating a bullish trend with acceleration. It has a higher volatility, with a standard deviation of 42.66, reaching a high of 240.39 and a low of 99.62.
Comparing both, Jabil Inc. has delivered the highest market performance with a 70.84% increase, outperforming Garmin Ltd.’s 57.86% gain during the past year.
Target Prices
Analysts provide clear target price consensus for Garmin Ltd. and Jabil Inc., reflecting their outlooks on both stocks.
| Company | Target High | Target Low | Consensus |
|---|---|---|---|
| Garmin Ltd. | 310 | 193 | 237 |
| Jabil Inc. | 283 | 244 | 260.5 |
The consensus target for Garmin Ltd. at 237 is about 11% above its current price of 213.93 USD, suggesting moderate upside potential. Jabil Inc.’s consensus target of 260.5 exceeds its current price of 238.35 USD by roughly 9%, indicating positive analyst expectations for growth.
Analyst Opinions Comparison
This section compares analysts’ ratings and financial scores for Garmin Ltd. and Jabil Inc.:
Rating Comparison
Garmin Ltd. Rating
- Rating: A- indicating a very favorable overall rating.
- Discounted Cash Flow Score: Moderate at 3, indicating fair valuation.
- Return on Equity Score: Favorable at 4, showing efficient profit generation.
- Return on Assets Score: Very favorable at 5, strong asset utilization.
- Debt To Equity Score: Favorable at 4, suggesting a strong balance sheet.
- Overall Score: Favorable at 4, reflecting solid financial standing.
Jabil Inc. Rating
- Rating: B- also marked as very favorable overall.
- Discounted Cash Flow Score: Moderate at 3, similar valuation assessment.
- Return on Equity Score: Very favorable at 5, indicating higher efficiency.
- Return on Assets Score: Moderate at 3, less efficient asset use.
- Debt To Equity Score: Very unfavorable at 1, indicating higher financial risk.
- Overall Score: Moderate at 3, showing average financial health.
Which one is the best rated?
Based strictly on the provided data, Garmin Ltd. holds a better overall rating (A-) and superior scores in return on assets, debt to equity, and overall financial standing compared to Jabil Inc., which has a lower overall score and unfavorable debt metrics.
Scores Comparison
Here is a comparison of the Altman Z-Score and Piotroski Score for Garmin Ltd. and Jabil Inc.:
Garmin Ltd. Scores
- Altman Z-Score: 14.62, indicating a strong financial safety in the safe zone.
- Piotroski Score: 5, reflecting average financial strength.
Jabil Inc. Scores
- Altman Z-Score: 3.09, also in the safe zone but much closer to the threshold.
- Piotroski Score: 8, showing very strong financial health.
Which company has the best scores?
Jabil Inc. has a lower but still safe Altman Z-Score and a notably higher Piotroski Score than Garmin Ltd., indicating stronger financial health based on these metrics.
Grades Comparison
The following tables summarize the recent grades assigned to Garmin Ltd. and Jabil Inc. by recognized financial institutions:
Garmin Ltd. Grades
This table presents the latest grades from established financial analysts for Garmin Ltd.:
| Grading Company | Action | New Grade | Date |
|---|---|---|---|
| Tigress Financial | Maintain | Strong Buy | 2025-12-19 |
| Longbow Research | Upgrade | Buy | 2025-12-03 |
| Barclays | Maintain | Underweight | 2025-10-30 |
| Morgan Stanley | Maintain | Underweight | 2025-10-30 |
| Tigress Financial | Maintain | Strong Buy | 2025-09-30 |
| Morgan Stanley | Maintain | Underweight | 2025-09-19 |
| Morgan Stanley | Maintain | Underweight | 2025-07-31 |
| Barclays | Maintain | Underweight | 2025-07-31 |
| JP Morgan | Maintain | Neutral | 2025-07-17 |
| JP Morgan | Maintain | Neutral | 2025-05-01 |
The grades for Garmin show a polarized trend, with several “Underweight” ratings balanced by “Strong Buy” and “Buy” recommendations, indicating mixed analyst sentiment.
Jabil Inc. Grades
This table outlines the recent grades awarded to Jabil Inc. by credible financial grading companies:
| Grading Company | Action | New Grade | Date |
|---|---|---|---|
| JP Morgan | Maintain | Overweight | 2025-12-18 |
| UBS | Maintain | Neutral | 2025-12-18 |
| Barclays | Maintain | Overweight | 2025-12-18 |
| B of A Securities | Maintain | Buy | 2025-12-10 |
| Barclays | Maintain | Overweight | 2025-09-26 |
| B of A Securities | Maintain | Buy | 2025-09-26 |
| JP Morgan | Maintain | Overweight | 2025-07-17 |
| B of A Securities | Maintain | Buy | 2025-06-20 |
| UBS | Maintain | Neutral | 2025-06-18 |
| JP Morgan | Maintain | Overweight | 2025-06-18 |
Jabil’s grades primarily reflect positive analyst sentiment with multiple “Overweight” and “Buy” ratings, suggesting a generally favorable outlook.
Which company has the best grades?
Jabil Inc. has received more consistently positive grades than Garmin Ltd., with a predominance of “Overweight” and “Buy” recommendations. This trend may influence investors seeking stocks with stronger analyst optimism, while Garmin’s mixed grades imply greater caution or varying outlooks among analysts.
Strengths and Weaknesses
Below is a comparison of Garmin Ltd. (GRMN) and Jabil Inc. (JBL) based on key investment criteria reflecting their latest financial and strategic positions.
| Criterion | Garmin Ltd. (GRMN) | Jabil Inc. (JBL) |
|---|---|---|
| Diversification | Balanced revenue streams across Automotive Mobile (610M), Aviation (877M), Fitness (1.77B), Marine (1.07B), Outdoor (1.96B) segments | Concentrated in Connected Living & Digital Commerce (5.6B), Intelligent Infrastructure (12.3B), Regulated Industries (11.9B) |
| Profitability | High net margin at 22.4%, ROE 18%, ROIC 16.3%, favorable overall ratios | Low net margin 2.2%, but very high ROE 43.4%, ROIC 16.1%; mixed financial ratios with some unfavorable liquidity and leverage levels |
| Innovation | Stable with neutral ROIC trend, good asset utilization (fixed asset turnover 4.49) | Strong innovation implied by rapidly growing ROIC trend (25.4%), high asset turnover (9.01) |
| Global presence | Established in multiple niche markets globally | Large scale global EMS and DMS operations, broad industrial exposure |
| Market Share | Leading positions in fitness and outdoor GPS markets | Strong presence in electronics manufacturing services, competitive in regulated industries |
Key takeaway: Garmin offers a well-diversified portfolio with solid profitability and stable competitive advantages, making it a safer value creator. Jabil shows strong growth potential with a very favorable moat and innovation, but carries higher financial risks and lower margins, requiring careful risk management.
Risk Analysis
Below is a comparative table highlighting key risk metrics for Garmin Ltd. (GRMN) and Jabil Inc. (JBL) for the most recent fiscal years.
| Metric | Garmin Ltd. (GRMN) | Jabil Inc. (JBL) |
|---|---|---|
| Market Risk | Beta 1.013 (moderate) | Beta 1.246 (higher volatility) |
| Debt Level | Very low debt-to-equity 0.02 (favorable) | High debt-to-equity 2.22 (unfavorable) |
| Regulatory Risk | Moderate, global tech regulations | Moderate, diversified manufacturing |
| Operational Risk | Moderate, relies on multiple product lines | Higher, complex global supply chain |
| Environmental Risk | Moderate, hardware manufacturing impact | Moderate to high, large manufacturing footprint |
| Geopolitical Risk | Exposure in Asia Pacific and EMEA | Significant exposure due to global operations |
Garmin’s most impactful risks center on market volatility and regulatory changes, yet its low debt and strong financial health mitigate financial distress risks. Jabil faces higher operational and financial risks due to heavy leverage and complex supply chains, despite strong profitability metrics. Investors should weigh these factors carefully.
Which Stock to Choose?
Garmin Ltd. (GRMN) shows a favorable income evolution with strong growth in revenue and net income over 2020-2024. Its profitability ratios, including a 22.41% net margin and 17.98% ROE, are solid. The company maintains low debt levels and a very favorable rating of A-, reflecting financial stability and value creation.
Jabil Inc. (JBL) presents a more mixed income profile with neutral to unfavorable trends, including a low 2.2% net margin and declining net income growth over 2021-2025. Despite a high ROE of 43.42%, JBL carries higher debt and a B- rating with several unfavorable financial ratios, indicating moderate financial risk.
Considering ratings and the global evaluation of income and financial ratios, Garmin may appear more favorable for investors prioritizing stability and consistent profitability, while Jabil might appeal to those with a higher risk tolerance seeking growth potential amid volatility.
Disclaimer: Investment carries a risk of loss of initial capital. The past performance is not a reliable indicator of future results. Be sure to understand risks before making an investment decision.
Go Further
I encourage you to read the complete analyses of Garmin Ltd. and Jabil Inc. to enhance your investment decisions: