Home > Comparison > Financial Services > BK vs BEN
The strategic rivalry between The Bank of New York Mellon Corporation and Franklin Resources, Inc. shapes the asset management landscape. BK operates as a capital-intensive financial services powerhouse offering custody, clearing, and wealth solutions. In contrast, BEN focuses on high-margin investment management through mutual funds and alternative assets. This analysis explores their competing models to identify which presents the superior risk-adjusted return for a diversified portfolio amid evolving market dynamics.

Table of contents
Companies Overview
The Bank of New York Mellon and Franklin Resources shape the asset management landscape with distinct scale and scope.
The Bank of New York Mellon Corporation: Global Custody and Wealth Services Powerhouse
As a leader in asset management, this company dominates custody, clearing, and wealth management services worldwide. Its diversified revenue streams include securities services and investment management, catering to central banks, institutions, and high-net-worth clients. In 2026, it sharpens focus on integrated cash management and data analytics to enhance client solutions and operational efficiency.
Franklin Resources, Inc.: Specialized Asset Management Innovator
Franklin Resources stands out as a specialist in mutual funds and multi-asset investment products. It generates revenue by managing equity, fixed income, and alternative assets for individuals and institutions. The firm’s 2026 strategy emphasizes expanding global reach and product diversification through its subsidiaries to meet evolving investor demands.
Strategic Collision: Similarities & Divergences
Both firms operate in asset management but contrast sharply: BNY Mellon offers a broad, service-rich platform, while Franklin Resources focuses on fund management specialization. Their competition centers on capturing institutional and retail investor capital. BNY Mellon’s scale and integrated services appeal to diversified mandates, whereas Franklin Resources targets niche growth, defining distinct investment profiles.
Income Statement Comparison
This data dissects the core profitability and scalability of both corporate engines to reveal who dominates the bottom line:
| Metric | The Bank of New York Mellon Corporation (BK) | Franklin Resources, Inc. (BEN) |
|---|---|---|
| Revenue | 39.2B | 8.8B |
| Cost of Revenue | 19.4B | 1.7B |
| Operating Expenses | 12.8B | 6.4B |
| Gross Profit | 19.9B | 7.0B |
| EBITDA | 8.4B | 1.4B |
| EBIT | 7.1B | 882M |
| Interest Expense | 20.7B | 95M |
| Net Income | 5.5B | 525M |
| EPS | 7.46 | 0.91 |
| Fiscal Year | 2025 | 2025 |
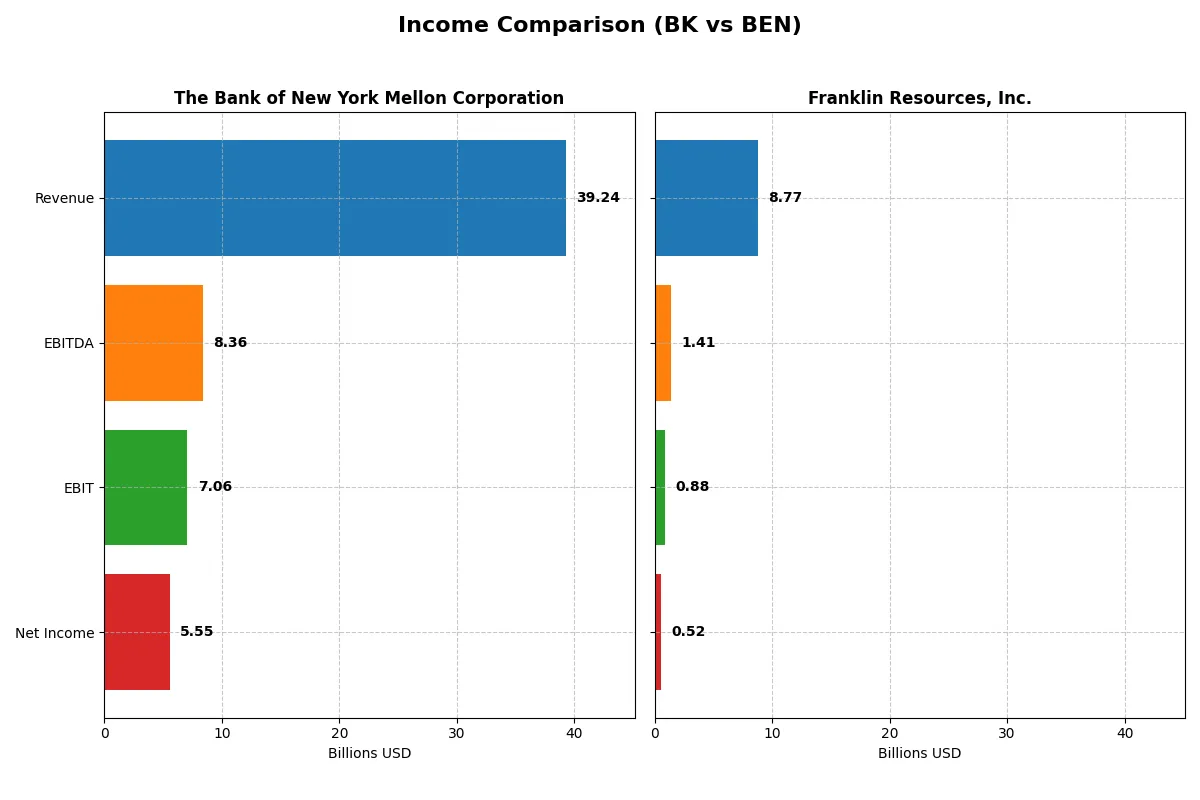
Income Statement Analysis: The Bottom-Line Duel
This income statement comparison reveals the true efficiency and profitability trends of two distinct financial firms over recent years.
The Bank of New York Mellon Corporation Analysis
BK’s revenue surged from $15.9B in 2021 to $39.2B in 2025, reflecting robust growth. Net income climbed impressively by 47.6% over five years, reaching $5.5B in 2025. The firm sustains strong gross (50.6%) and net margins (14.1%), with a notable 23.5% net margin improvement last year. Efficiency gains drove EBIT up 20.7%, highlighting operational momentum.
Franklin Resources, Inc. Analysis
BEN’s revenue remained relatively flat, growing modestly from $8.4B in 2021 to $8.8B in 2025. Net income, however, plunged 71.3% over the period to $525M, despite a 9.2% net margin rise last year to 6.0%. Gross margin holds at a healthy 80.3%, but EBIT margin dropped to 10.1%, reflecting margin pressure and weaker operating income growth (-4.2% last year).
Margin Resilience vs. Growth Momentum
BK clearly outpaces BEN in revenue expansion and net income growth, showcasing superior scale and improving profitability. BK’s consistent margin enhancement and strong EPS growth contrast with BEN’s stagnant revenue and significant net income decline. Investors seeking growth backed by operational efficiency may find BK’s profile more compelling than BEN’s subdued momentum.
Financial Ratios Comparison
These vital ratios act as a diagnostic tool to expose the underlying fiscal health, valuation premiums, and capital efficiency of the companies compared below:
| Ratios | The Bank of New York Mellon Corporation (BK) | Franklin Resources, Inc. (BEN) |
|---|---|---|
| ROE | 12.52% | 4.35% |
| ROIC | 6.38% | 1.38% |
| P/E | 14.74 | 22.67 |
| P/B | 1.85 | 0.99 |
| Current Ratio | 0.70 | 2.71 |
| Quick Ratio | 0.70 | 2.71 |
| D/E (Debt-to-Equity) | 0.76 | 1.10 |
| Debt-to-Assets | 7.17% | 41.09% |
| Interest Coverage | 0.34 | 6.37 |
| Asset Turnover | 0.08 | 0.27 |
| Fixed Asset Turnover | 10.96 | 5.12 |
| Payout ratio | 25.40% | 130.25% |
| Dividend yield | 1.72% | 5.75% |
| Fiscal Year | 2025 | 2025 |
Efficiency & Valuation Duel: The Vital Signs
Ratios serve as a company’s DNA, exposing hidden risks and showcasing operational strengths critical for investment decisions.
The Bank of New York Mellon Corporation
BK demonstrates solid profitability with a 12.5% ROE and a 14.1% net margin, signaling operational efficiency. Its P/E of 14.7 indicates a favorable valuation, neither stretched nor cheap. The company offers a moderate 1.7% dividend yield, reflecting balanced shareholder returns alongside prudent capital allocation.
Franklin Resources, Inc.
BEN’s profitability lags with a 4.4% ROE and 6.0% net margin, pointing to weaker core returns. Its P/E ratio at 22.7 seems neutral but leans toward expensive relative to profitability. BEN maintains a healthy current ratio of 2.7 and a 5.8% dividend yield, suggesting reliable income despite modest growth metrics.
Balanced Stability vs. Yield Focus
BK offers a better blend of profitability and valuation discipline, though with some liquidity concerns. BEN provides stronger liquidity and higher yield but at the cost of lower returns. Investors seeking operational resilience may prefer BK, while income-focused profiles might lean toward BEN.
Which one offers the Superior Shareholder Reward?
I observe that The Bank of New York Mellon (BK) pays a modest dividend yield around 1.7% with a sustainable payout ratio near 25%, complemented by steady buybacks enhancing shareholder value. Franklin Resources (BEN) offers a higher dividend yield near 6%, but with payout ratios exceeding 100%, signaling reliance on external financing or capital depletion. BEN’s free cash flow remains positive but less robust than BK’s, and its buyback program is less intense. I find BK’s balanced dividend and buyback strategy more sustainable, favoring long-term value creation. For disciplined investors in 2026, BK offers a superior total return profile with prudent capital allocation and manageable payout risk.
Comparative Score Analysis: The Strategic Profile
The radar chart reveals the fundamental DNA and trade-offs of The Bank of New York Mellon Corporation and Franklin Resources, Inc.:
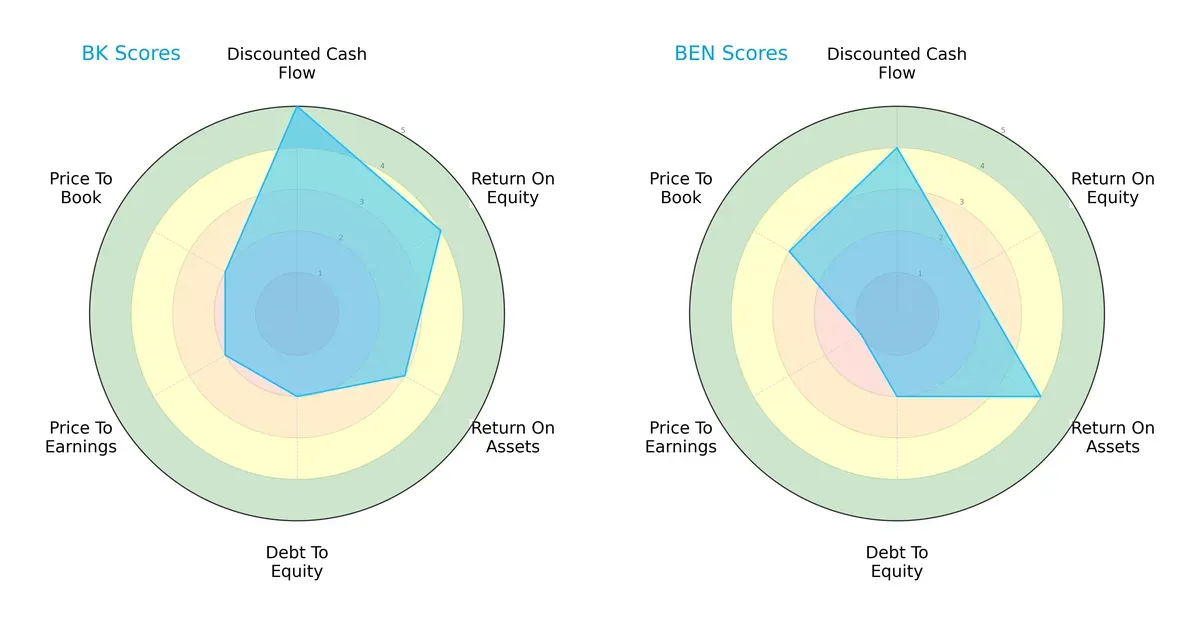
BK excels in discounted cash flow (5) and return on equity (4), showing strong profit generation and valuation discipline. BEN outperforms in return on assets (4) and price-to-book (3), reflecting asset efficiency and moderate valuation appeal. Both have moderate debt-to-equity (2) scores, indicating similar financial risk. BK offers a more balanced profile, while BEN relies on asset utilization as its edge.
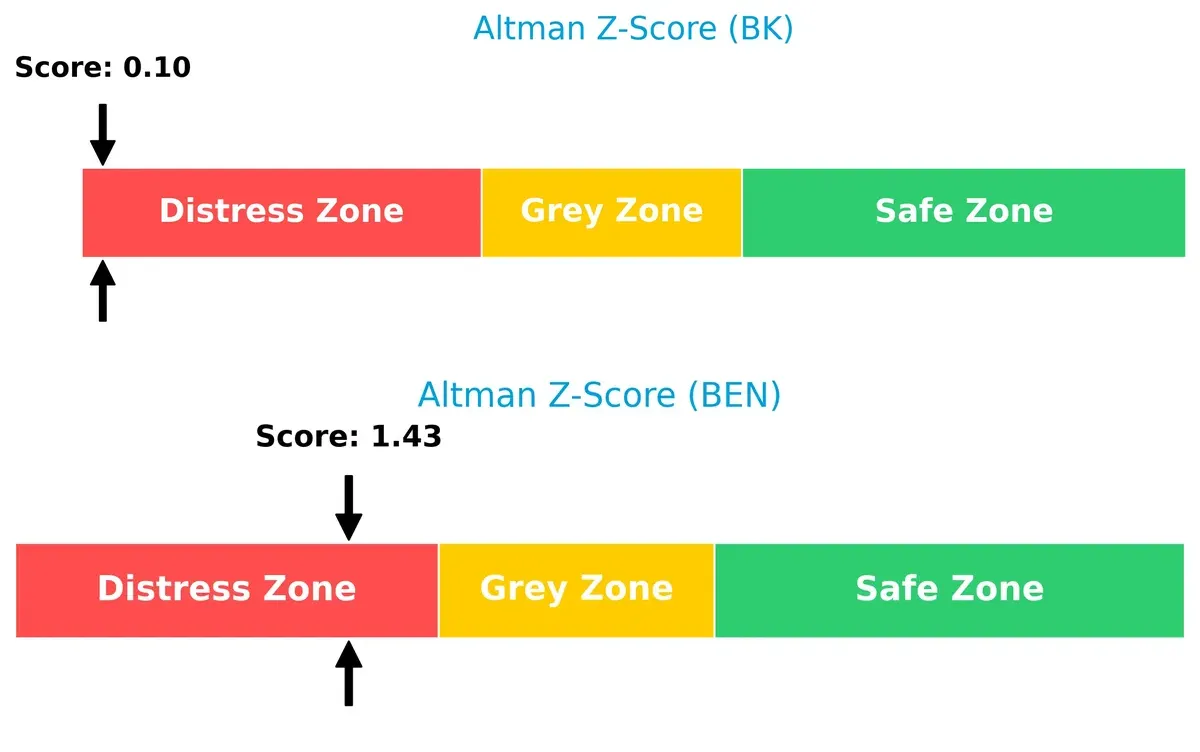
Bankruptcy Risk: Solvency Showdown
The Altman Z-Score gap shows both companies in the distress zone, but BEN (1.43) fares better than BK (0.10), signaling a marginally stronger solvency outlook in this cycle:
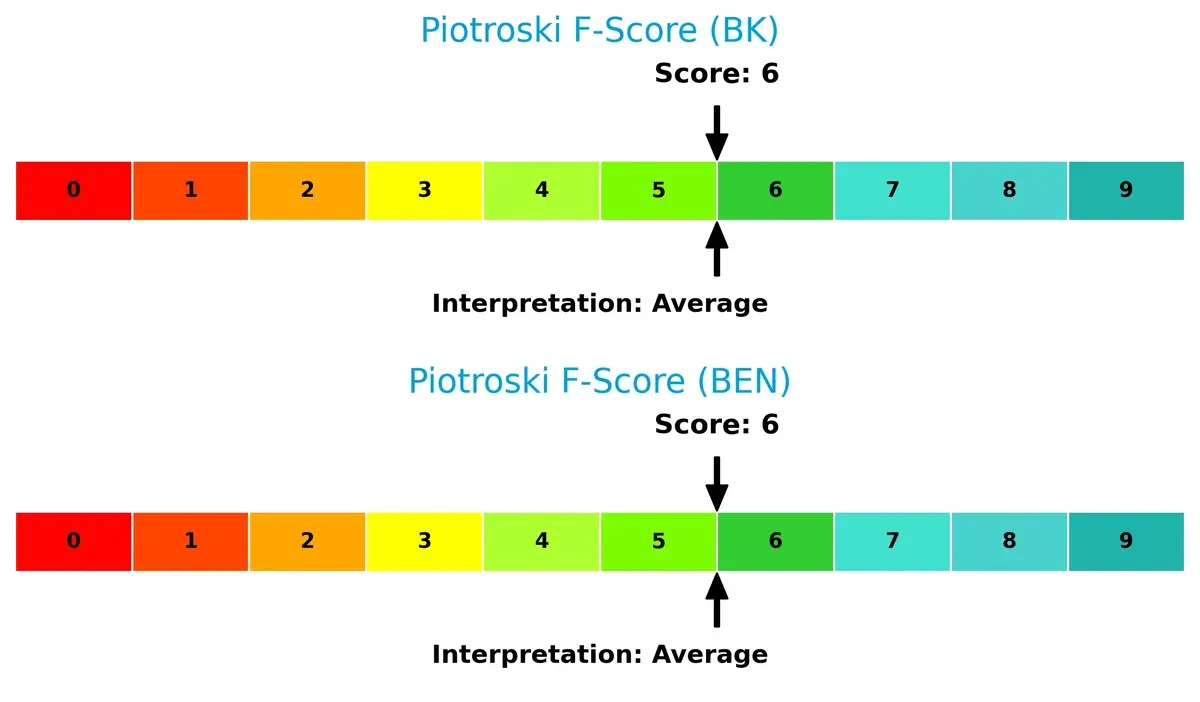
Financial Health: Quality of Operations
Both firms hold a Piotroski F-Score of 6, indicating average financial health. Neither shows red flags, but neither demonstrates peak operational strength either:
How are the two companies positioned?
This section dissects BK and BEN’s operational DNA by comparing their revenue distribution and internal dynamics. The goal is to confront their economic moats and identify which model offers the most resilient competitive advantage today.
Revenue Segmentation: The Strategic Mix
The following visual comparison dissects how The Bank of New York Mellon Corporation and Franklin Resources, Inc. diversify their income streams and where their primary sector bets lie:
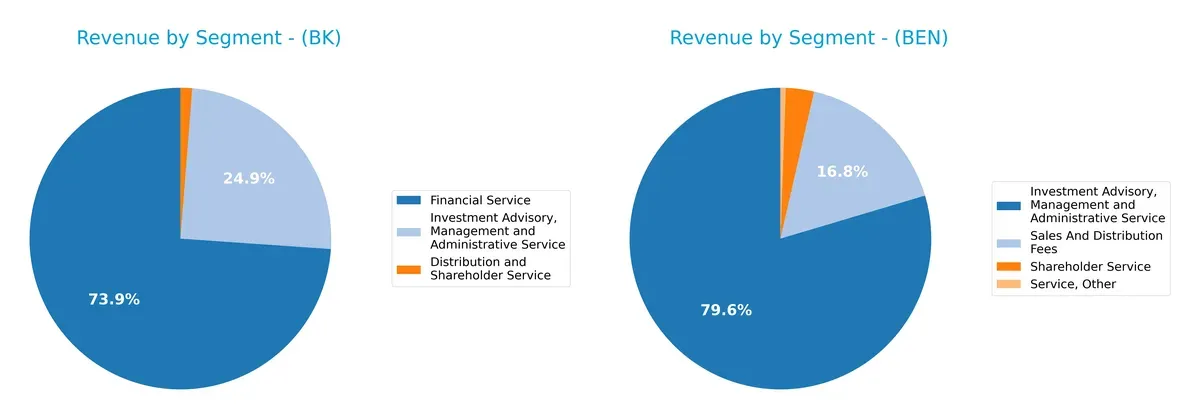
The Bank of New York Mellon Corporation anchors 9.3B in Financial Service, dwarfing its smaller segments like Distribution (158M) and Investment Advisory (3.1B). Franklin Resources, Inc. pivots heavily on Investment Advisory at 6.8B, supported by Sales and Distribution Fees at 1.4B. BK shows ecosystem dominance with a strong Financial Service moat, while BEN’s reliance on advisory risks concentration amid market shifts. BK’s broader base offers more resilience.
Strengths and Weaknesses Comparison
This table compares the Strengths and Weaknesses of BK and BEN based on diversification, profitability, financials, innovation, global presence, and market share:
BK Strengths
- Diverse revenue streams across financial, advisory, and distribution services
- Strong net margin at 14.14%
- Favorable PE ratio at 14.74
- Low debt-to-assets ratio at 7.17%
- Significant US and EMEA market presence
- High fixed asset turnover at 10.96
BEN Strengths
- Favorable WACC at 6.7% indicates efficient capital costs
- Strong liquidity with current and quick ratios at 2.71
- Favorable PB ratio below 1.0
- High interest coverage at 9.29
- Well-focused investment advisory revenue
- Robust US and Luxembourg geographic markets
BK Weaknesses
- Unfavorable current and quick ratios at 0.7 suggest liquidity risk
- WACC at 19.98% exceeds ROIC at 6.38%, indicating value destruction
- Low interest coverage at 0.34 signals debt servicing risk
- Asset turnover low at 0.08
- Neutral ROE and ROIC ratios limit profitability strength
- Slightly unfavorable overall ratio profile
BEN Weaknesses
- Low ROE at 4.35% and ROIC at 1.38% indicate weak profitability
- High debt-to-equity ratio at 1.1 raises leverage concerns
- Asset turnover low at 0.27 limits operational efficiency
- Neutral net margin at 5.98%
- Moderate dividend yield at 5.75% does not offset profitability issues
Both BK and BEN show strengths in their core service offerings and geographic reach but face liquidity and profitability challenges. BK’s high WACC versus ROIC signals potential value erosion, while BEN’s weaker profitability metrics highlight operational efficiency risks. These factors could influence each company’s capital allocation and growth strategies going forward.
The Moat Duel: Analyzing Competitive Defensibility
A structural moat is the only true shield protecting long-term profits from relentless competition erosion. Let’s dissect how these firms defend their turf:
The Bank of New York Mellon Corporation: Custody & Integration Moat
BK leverages its massive custody network and integrated wealth services to maintain high ROIC and margin stability. Its growing ROIC trend signals improving profitability, despite current value destruction. Expansion into data analytics and prime brokerage in 2026 could deepen this moat.
Franklin Resources, Inc.: Brand & Investment Expertise Moat
BEN relies on its strong brand and investment management expertise, but shows declining ROIC and value erosion unlike BK. Its moat struggles amid market shifts, though new multi-asset strategies may offer modest growth opportunities in 2026.
Custody Scale vs. Investment Brand: Which Moat Holds Stronger?
BK’s widening moat from integrated services and improving ROIC outpaces BEN’s shrinking value and declining profitability. BK stands better poised to defend market share and adapt through innovation in 2026.
Which stock offers better returns?
The past 12 months reveal stark contrasts: The Bank of New York Mellon surges with accelerating gains, while Franklin Resources faces a declining trend despite recent recovery.
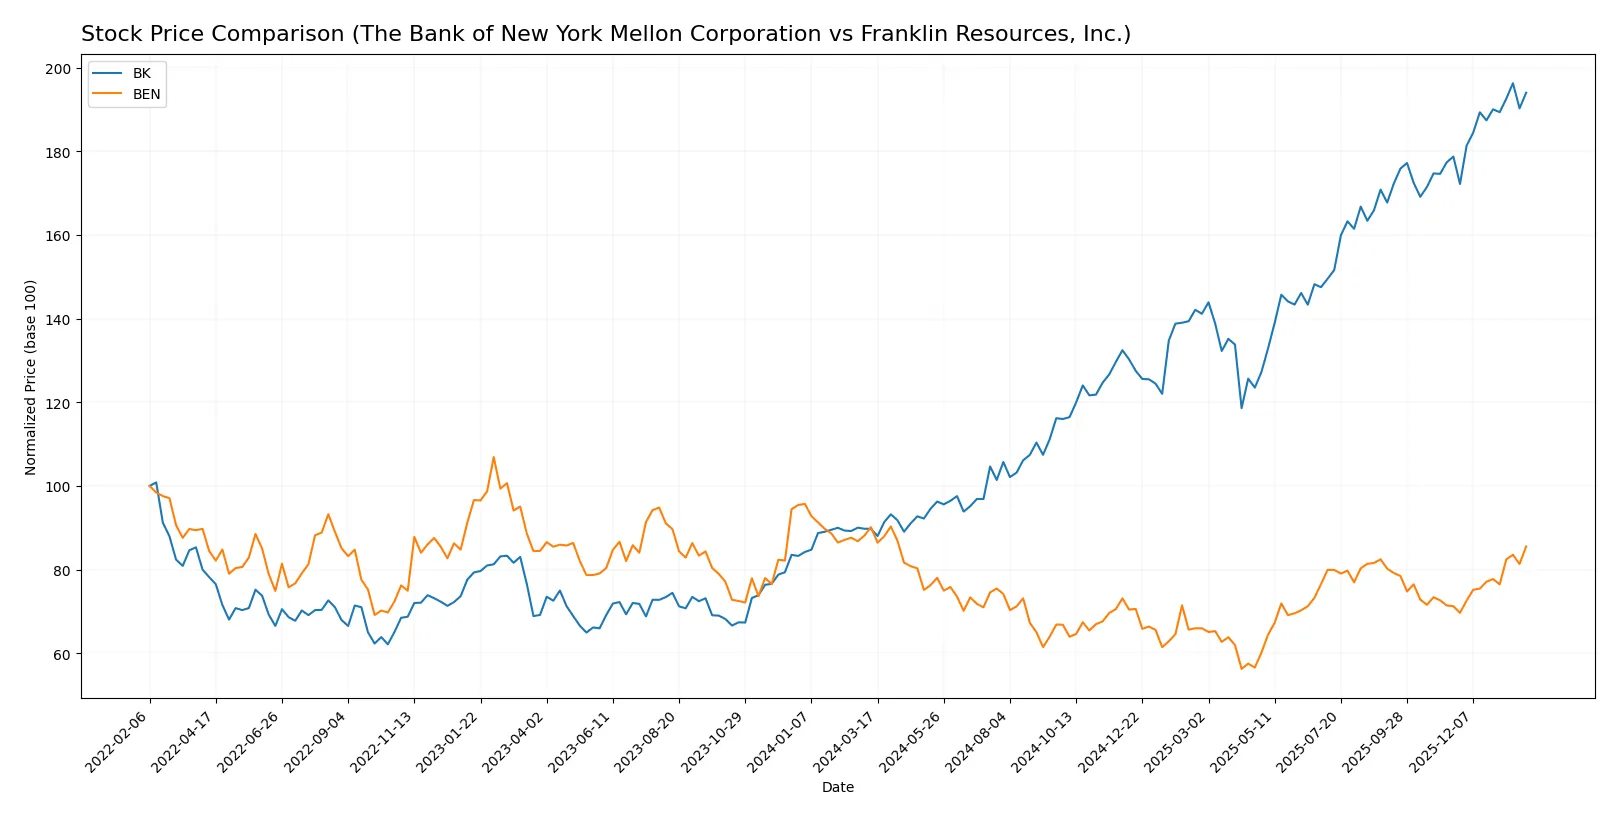
Trend Comparison
The Bank of New York Mellon’s stock rose 116.19% over the past year, showing a bullish trend with accelerating momentum and a high price peak of 121.33. Its volatility stands at a notable 19.39.
Franklin Resources’ stock declined 5.1% over the same period, marking a bearish trend with accelerating downward pressure. The stock’s highest price reached only 28.11, and volatility remains low at 2.3.
Comparing both, The Bank of New York Mellon clearly outperformed Franklin Resources in market returns, delivering the strongest price appreciation throughout the year.
Target Prices
Analysts present a clear consensus on target prices for these asset management firms.
| Company | Target Low | Target High | Consensus |
|---|---|---|---|
| The Bank of New York Mellon Corporation | 110 | 143 | 130.25 |
| Franklin Resources, Inc. | 25 | 25 | 25 |
The Bank of New York Mellon’s target consensus at 130.25 suggests upside from its current 119.92 price. Franklin Resources’ consensus target matches its current 26.62 price, indicating stable expectations.

Don’t Let Luck Decide Your Entry Point
Optimize your entry points with our advanced ProRealTime indicators. You’ll get efficient buy signals with precise price targets for maximum performance. Start outperforming now!
How do institutions grade them?
The Bank of New York Mellon Corporation Grades
The table below shows recent institutional grades for The Bank of New York Mellon Corporation.
| Grading Company | Action | New Grade | Date |
|---|---|---|---|
| Citigroup | Maintain | Neutral | 2026-01-14 |
| Morgan Stanley | Maintain | Overweight | 2026-01-14 |
| RBC Capital | Maintain | Sector Perform | 2026-01-14 |
| Wells Fargo | Maintain | Equal Weight | 2026-01-14 |
| Keefe, Bruyette & Woods | Maintain | Outperform | 2026-01-14 |
| Truist Securities | Upgrade | Buy | 2026-01-07 |
| TD Cowen | Maintain | Buy | 2026-01-07 |
| Barclays | Maintain | Overweight | 2026-01-05 |
Franklin Resources, Inc. Grades
The table below shows recent institutional grades for Franklin Resources, Inc.
| Grading Company | Action | New Grade | Date |
|---|---|---|---|
| Barclays | Maintain | Underweight | 2026-01-15 |
| TD Cowen | Maintain | Buy | 2026-01-14 |
| JP Morgan | Maintain | Neutral | 2025-11-10 |
| Evercore ISI Group | Maintain | Underperform | 2025-10-09 |
| B of A Securities | Maintain | Underperform | 2025-10-02 |
| Morgan Stanley | Maintain | Underweight | 2025-08-12 |
Which company has the best grades?
The Bank of New York Mellon Corporation generally receives higher and more positive grades than Franklin Resources, Inc. This disparity may influence investor confidence and impact portfolio allocation decisions.
Risks specific to each company
The following categories identify critical pressure points and systemic threats facing both firms in the 2026 market environment:
1. Market & Competition
The Bank of New York Mellon Corporation
- Faces intense pressure from fintech disruptors and traditional banks adapting digital solutions.
Franklin Resources, Inc.
- Competes in a crowded asset management market with rising passive investment popularity.
2. Capital Structure & Debt
The Bank of New York Mellon Corporation
- Maintains moderate debt-to-equity (0.76) but suffers from weak interest coverage (0.34), raising refinancing risk.
Franklin Resources, Inc.
- Exhibits higher leverage (debt-to-equity 1.1) yet strong interest coverage (9.29), reflecting manageable debt risk.
3. Stock Volatility
The Bank of New York Mellon Corporation
- Beta of 1.11 indicates moderate volatility, aligned with financial sector benchmarks.
Franklin Resources, Inc.
- Higher beta at 1.47 signals greater sensitivity to market swings, increasing investor risk.
4. Regulatory & Legal
The Bank of New York Mellon Corporation
- Subject to stringent US and international financial regulations, exposing it to compliance costs.
Franklin Resources, Inc.
- Faces regulatory scrutiny typical for asset managers, including fiduciary and reporting obligations.
5. Supply Chain & Operations
The Bank of New York Mellon Corporation
- Relies on technology infrastructure for securities services; operational disruptions could impair service delivery.
Franklin Resources, Inc.
- Operational risks tied to fund management platforms and global office coordination, especially in India.
6. ESG & Climate Transition
The Bank of New York Mellon Corporation
- Increasing pressure to integrate ESG in custody and investment services with growing client demands.
Franklin Resources, Inc.
- Must enhance ESG product offerings and transparency to meet evolving investor expectations.
7. Geopolitical Exposure
The Bank of New York Mellon Corporation
- Global footprint exposes it to geopolitical tensions affecting cross-border capital flows.
Franklin Resources, Inc.
- Exposure to US-China tech tensions and emerging market instability could impact assets under management.
Which company shows a better risk-adjusted profile?
The Bank of New York Mellon Corporation’s biggest risk lies in its weak interest coverage and operational complexity amid regulatory pressures. Franklin Resources, Inc. faces significant market volatility and moderate leverage but benefits from solid debt servicing capacity. Despite both firms residing in the distress zone by Altman Z-Score, Franklin Resources shows a slightly better risk-adjusted profile due to stronger liquidity ratios and interest coverage. Notably, Franklin’s recent surge in average trading volume suggests heightened investor attention but also potential price swings, demanding caution.
Final Verdict: Which stock to choose?
The Bank of New York Mellon Corporation (BK) shines as a cash machine with accelerating profitability and strong operational efficiency. Its rising returns suggest improving value creation despite a point of vigilance in liquidity ratios. BK suits investors targeting aggressive growth with a tolerance for short-term balance sheet challenges.
Franklin Resources, Inc. (BEN) boasts a strategic moat rooted in its robust balance sheet and interest coverage. Its safety profile outpaces BK’s, backed by favorable liquidity and moderate leverage. BEN fits portfolios focused on GARP—growth at a reasonable price—with a preference for stability over rapid expansion.
If you prioritize growth fueled by operational momentum and improving profitability, BK is the compelling choice due to its accelerating returns and market bullishness. However, if you seek financial stability with a conservative risk profile, BEN offers better safety and a steadier cash flow, though its profitability trend lags. Both demand careful risk awareness given their respective balance sheet and value creation challenges.
Disclaimer: Investment carries a risk of loss of initial capital. The past performance is not a reliable indicator of future results. Be sure to understand risks before making an investment decision.
Go Further
I encourage you to read the complete analyses of The Bank of New York Mellon Corporation and Franklin Resources, Inc. to enhance your investment decisions: