Home > Comparison > Financial Services > TROW vs BEN
The strategic rivalry between T. Rowe Price Group, Inc. and Franklin Resources, Inc. shapes the asset management sector’s evolution. T. Rowe Price operates as a research-driven, fundamentally focused investment manager with a global footprint. Franklin Resources functions as a diversified asset management holding company, emphasizing multi-asset mutual funds and alternative markets. This analysis will assess which firm’s operational model delivers a superior risk-adjusted return for a balanced investment portfolio.
Table of contents
Companies Overview
T. Rowe Price Group and Franklin Resources stand as pillars in the US asset management landscape, shaping investment trends.
T. Rowe Price Group, Inc.: Global Investment Manager Focused on Research-Driven Strategies
T. Rowe Price Group commands a market cap of $20.7B and operates primarily through managing equity and fixed income mutual funds. Its revenue engine relies on active asset management, employing fundamental and quantitative analysis with a strong emphasis on socially responsible investing. In 2026, the firm focuses strategically on environmental, social, and governance (ESG) integration and late-stage venture capital investments.
Franklin Resources, Inc.: Diversified Asset Management Holding Company
Franklin Resources holds a market cap of $14.2B and generates revenue by launching equity, fixed income, balanced, and multi-asset mutual funds. The company serves a broad client base including pension plans and trusts. Its 2026 strategy centers on expanding alternative market investments while maintaining a diversified asset mix to capture evolving investor demand.
Strategic Collision: Similarities & Divergences
Both firms excel in asset management but diverge in their strategic priorities. T. Rowe Price leans on a research-intensive, ESG-driven model, while Franklin Resources embraces a diversified product lineup including alternatives. Their primary battleground lies in institutional and individual fund flows. Investors will note T. Rowe’s focus on thematic growth contrasts with Franklin’s breadth, defining distinct risk and return profiles.
Income Statement Comparison
This data dissects the core profitability and scalability of both corporate engines to reveal who dominates the bottom line:
| Metric | T. Rowe Price Group, Inc. (TROW) | Franklin Resources, Inc. (BEN) |
|---|---|---|
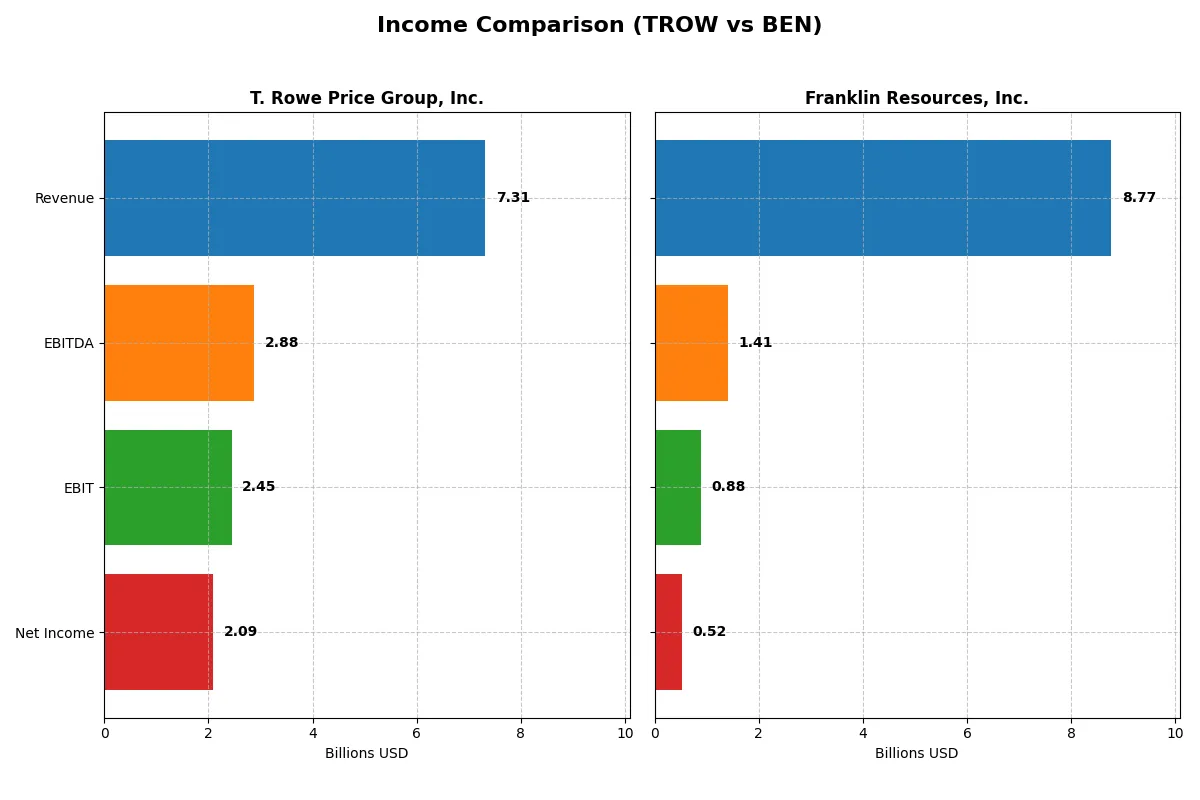
| Revenue | 7.31B | 8.77B |
| Cost of Revenue | 2.73B | 1.72B |
| Operating Expenses | 2.40B | 6.44B |
| Gross Profit | 4.58B | 7.05B |
| EBITDA | 2.88B | 1.41B |
| EBIT | 2.45B | 882M |
| Interest Expense | 0 | 95M |
| Net Income | 2.09B | 525M |
| EPS | 9.26 | 0.91 |
| Fiscal Year | 2025 | 2025 |
Income Statement Analysis: The Bottom-Line Duel
This Income Statement comparison reveals which company runs a more efficient and profitable corporate engine, based on recent financial performance.
T. Rowe Price Group, Inc. Analysis
T. Rowe Price’s revenue grew modestly to $7.31B in 2025, yet net income declined slightly to $2.05B. Its gross margin remains strong at 62.7%, while the net margin at 28.5% signals healthy profitability. Despite a one-year dip in EBIT and net margin, TROW sustains solid earnings momentum and operational efficiency.
Franklin Resources, Inc. Analysis
Franklin Resources reported $8.77B in revenue for 2025, with net income at $472M. It boasts a high gross margin of 80.3% but struggles with a thin net margin of 6.0%. Revenue growth is steady, but EBIT and net income have fallen. Recent margin improvements and EPS growth suggest cautious operational progress.
Margin Strength vs. Earnings Efficiency
T. Rowe Price outperforms Franklin Resources in net income and margin efficiency despite slower revenue growth. TROW’s superior net margin and consistent earnings underpin stronger fundamental profitability. Investors prioritizing robust margins and bottom-line strength may find TROW’s profile more compelling than BEN’s higher revenue but weaker earnings conversion.
Financial Ratios Comparison
These vital ratios act as a diagnostic tool to expose the underlying fiscal health, valuation premiums, and capital efficiency of the companies analyzed:
| Ratios | T. Rowe Price Group, Inc. (TROW) | Franklin Resources, Inc. (BEN) |
|---|---|---|
| ROE | 19.2% | 4.3% |
| ROIC | 22.2% | 1.4% |
| P/E | 11.0 | 22.7 |
| P/B | 2.11 | 0.99 |
| Current Ratio | 0 | 2.71 |
| Quick Ratio | 0 | 2.71 |
| D/E | 0 | 1.10 |
| Debt-to-Assets | 0 | 41.1% |
| Interest Coverage | 0 | 6.37 |
| Asset Turnover | 0.51 | 0.27 |
| Fixed Asset Turnover | 5.96 | 5.12 |
| Payout ratio | 54.5% | 130.3% |
| Dividend yield | 4.96% | 5.75% |
| Fiscal Year | 2025 | 2025 |
Efficiency & Valuation Duel: The Vital Signs
Financial ratios serve as a company’s DNA, uncovering hidden risks and operational strengths critical for investor insight.
T. Rowe Price Group, Inc.
T. Rowe Price exhibits strong profitability with a 19.22% ROE and a favorable 28.53% net margin, reflecting operational efficiency. Its P/E of 10.98 suggests the stock is attractively valued compared to peers. The firm delivers 4.96% dividend yield, rewarding shareholders steadily amid robust capital returns.
Franklin Resources, Inc.
Franklin Resources shows modest profitability, with a 4.35% ROE and a neutral 5.98% net margin, indicating limited efficiency. Its P/E of 22.67 marks a stretched valuation. The 5.75% dividend yield offers income, but weaker returns and higher leverage flag potential risk in capital structure.
Balanced Profitability vs. Valuation Stretch
T. Rowe Price offers a better balance of profitability and valuation, with stronger returns and sustainable shareholder payouts. Franklin’s higher P/E and lower returns suggest greater risk for less reward. Investors seeking operational strength may prefer T. Rowe; income-focused investors might weigh Franklin’s dividend yield despite risks.
Which one offers the Superior Shareholder Reward?
I compare T. Rowe Price Group, Inc. (TROW) and Franklin Resources, Inc. (BEN) by contrasting their distribution strategies and shareholder returns. TROW offers a 4.96% dividend yield with a 54% payout ratio, well-covered by free cash flow (FCF), and a robust buyback program supporting long-term value. BEN yields 5.75%, but its payout ratio exceeds 130%, signaling dividend sustainability risks despite modest buybacks. TROW’s balanced dividend and buyback approach, supported by superior margins and capital allocation, delivers a more sustainable and attractive total return in 2026. I favor TROW for disciplined, risk-managed shareholder rewards over BEN’s aggressive, less sustainable payouts.
Comparative Score Analysis: The Strategic Profile
The radar chart reveals the fundamental DNA and trade-offs of T. Rowe Price Group, Inc. and Franklin Resources, Inc.:
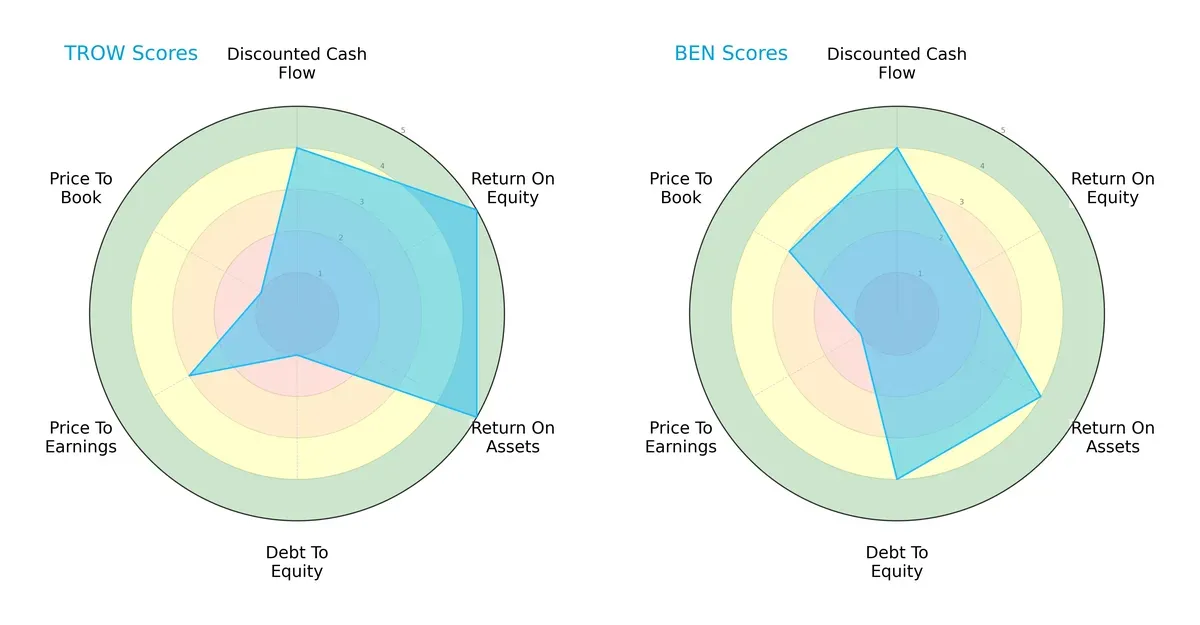
T. Rowe Price shows strength in ROE and ROA, scoring very favorable in both, but suffers from a weak debt-to-equity and price-to-book profile. Franklin Resources balances moderate ROA and debt-to-equity scores but lags significantly on ROE and valuation metrics. T. Rowe Price has a sharper operational edge, while Franklin Resources presents a more balanced but less efficient financial profile.
Bankruptcy Risk: Solvency Showdown
The Altman Z-Score delta highlights a stark contrast in solvency:
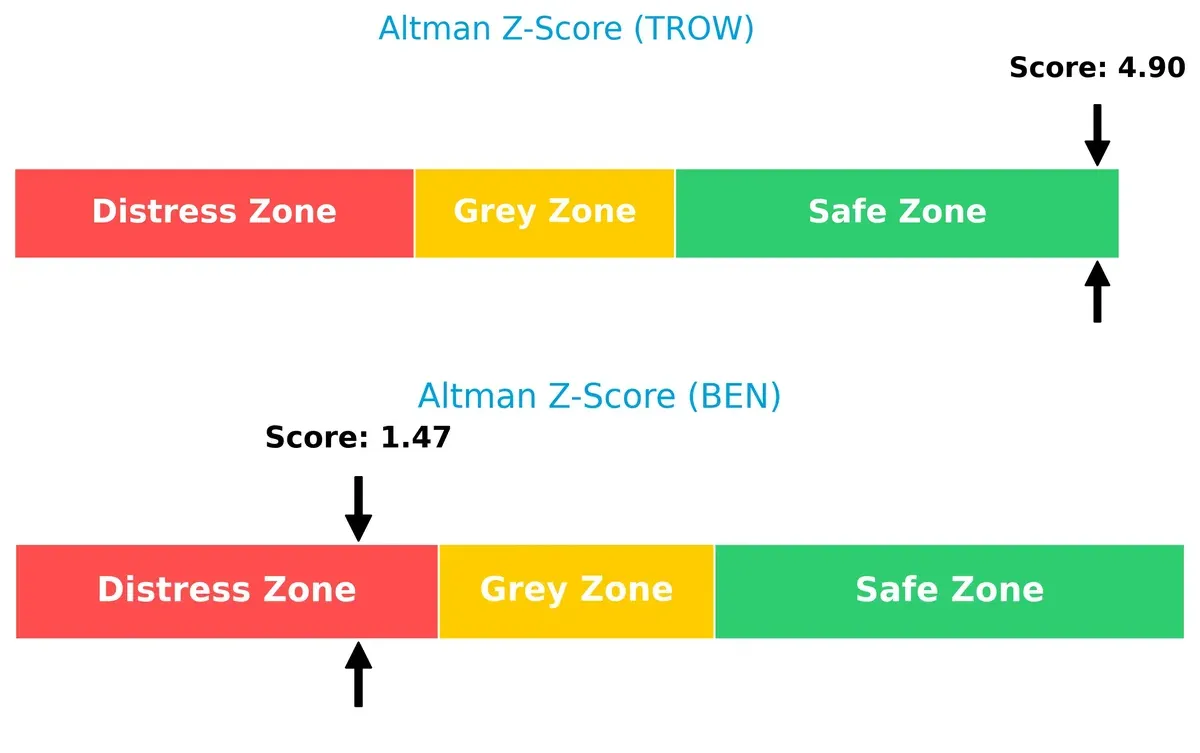
T. Rowe Price’s score of 4.9 places it comfortably in the safe zone, signaling robust financial stability. Franklin Resources’ 1.47 score flags serious distress risk, indicating vulnerability to bankruptcy in this cycle.
Financial Health: Quality of Operations
The Piotroski F-Score comparison reveals internal financial quality differences:
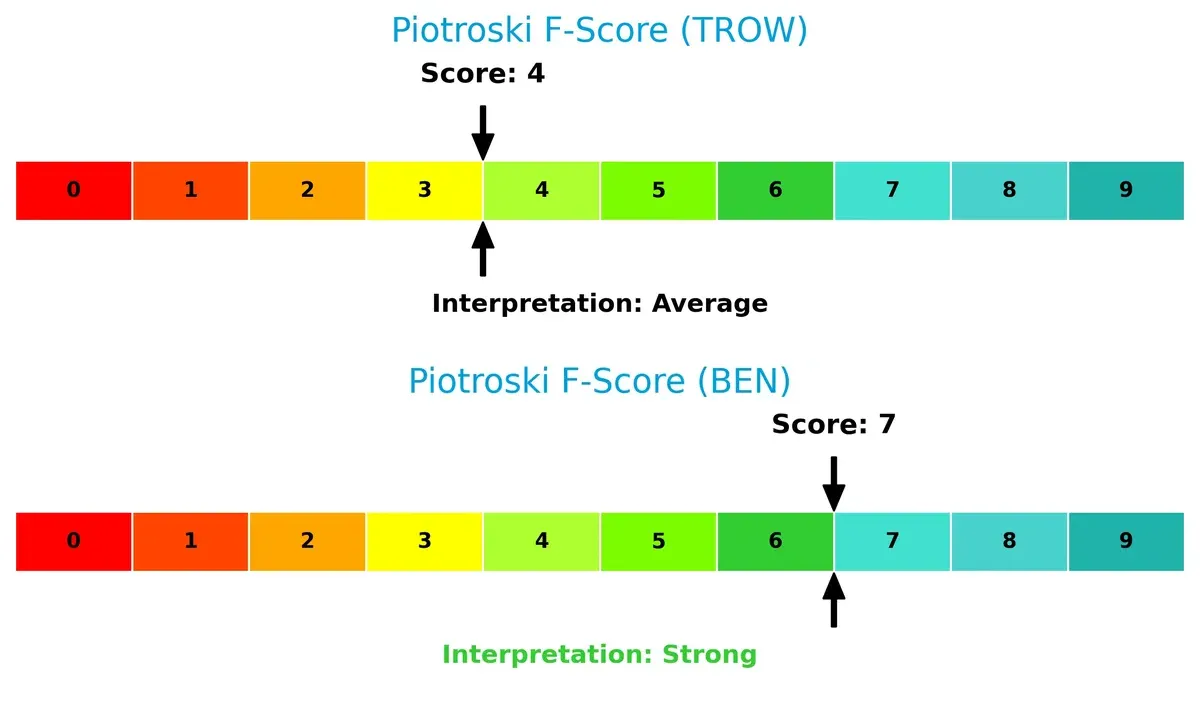
Franklin Resources scores a strong 7, signaling solid financial health and operational efficiency. T. Rowe Price’s average score of 4 suggests some red flags in profitability or liquidity metrics despite its strong market performance. Investors should weigh this operational risk carefully.
How are the two companies positioned?
This section dissects TROW and BEN’s operational DNA by comparing their revenue distribution and internal dynamics. Our goal is to confront their economic moats to identify which model delivers the most resilient, sustainable competitive advantage today.
Revenue Segmentation: The Strategic Mix
This visual comparison dissects how T. Rowe Price Group and Franklin Resources diversify their income streams and where their primary sector bets lie:
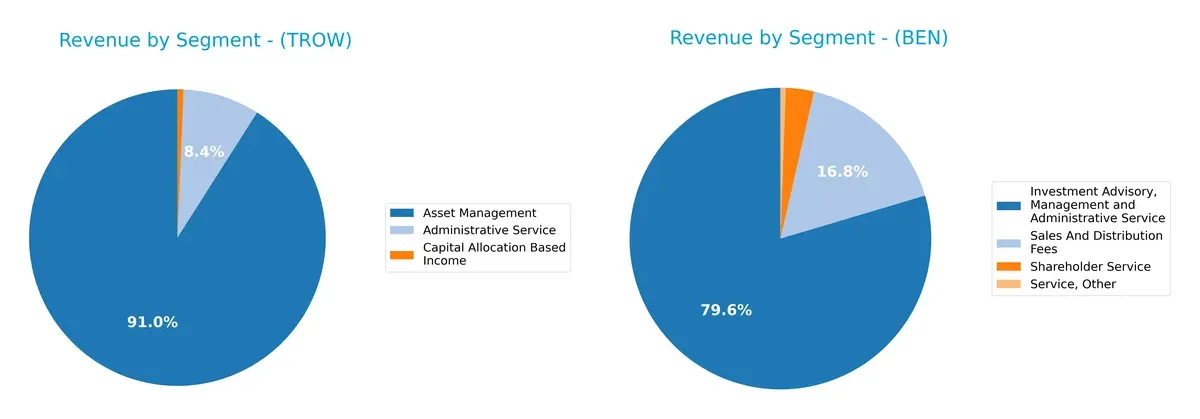
T. Rowe Price anchors 2024 revenue heavily in Asset Management at $6.4B, with smaller contributions from Administrative Service ($588M) and Capital Allocation Based Income ($47M). Franklin Resources presents a more diversified mix, with $6.98B from Investment Advisory, $1.47B from Sales and Distribution Fees, plus smaller segments. Franklin’s broader base reduces concentration risk, while T. Rowe’s focus signals strong ecosystem lock-in but higher segment dependency.
Strengths and Weaknesses Comparison
This table compares the Strengths and Weaknesses of T. Rowe Price Group, Inc. (TROW) and Franklin Resources, Inc. (BEN):
TROW Strengths
- High net margin at 28.53%
- Strong ROE of 19.22%
- ROIC of 22.19% exceeds WACC
- Favorable interest coverage ratio
- Consistent dividend yield near 5%
- Lower debt-to-assets ratio indicating financial stability
BEN Strengths
- Favorable current and quick ratios at 2.71 each
- Lower WACC at 6.77%
- Favorable price-to-book ratio at 0.99
- Positive interest coverage ratio of 9.29
- Diversified revenue streams including sales and distribution fees
- Well-established global presence with significant revenue from Luxembourg and US
TROW Weaknesses
- Current and quick ratios are zero, indicating possible liquidity concerns
- WACC higher than ROIC, suggesting capital cost pressure
- Neutral asset turnover at 0.51
- Price-to-book ratio slightly above 2, reflecting moderate market valuation
- Limited geographic revenue data, restricting diversification assessment
BEN Weaknesses
- Low net margin of 5.98% and weak ROE of 4.35%
- ROIC at 1.38% below WACC, indicating poor capital efficiency
- Higher debt-to-equity ratio at 1.1 signals leverage risk
- Unfavorable asset turnover at 0.27
- Neutral dividend yield at 5.75%, less attractive than peers
Both companies show different financial profiles. TROW excels in profitability metrics but faces liquidity red flags. BEN demonstrates stronger liquidity and geographic diversification but struggles with profitability and capital efficiency. These contrasts highlight distinct strategic focuses and risk exposures.
The Moat Duel: Analyzing Competitive Defensibility
A structural moat is the essential barrier protecting long-term profits from relentless competition erosion. Let’s dissect the moats of two asset management giants:
T. Rowe Price Group, Inc.: Enduring Value Creator with High ROIC
T. Rowe Price leverages intangible assets and trusted brand reputation. Its ROIC exceeds WACC by 11%, signaling efficient capital use despite a slight profitability decline. New product innovation could fortify this moat in 2026.
Franklin Resources, Inc.: Struggling Value Destroyer Amidst Declining ROIC
Franklin’s moat hinges on cost advantage and scale but contrasts sharply with T. Rowe’s. Its ROIC lags behind WACC by over 5%, reflecting value destruction and sharply declining profitability. Expansion into emerging markets might offer a turnaround opportunity.
ROIC Superiority vs. Cost Efficiency: The Moat Showdown
T. Rowe Price possesses the deeper moat, consistently generating excess returns while Franklin Resources struggles to maintain value. T. Rowe is better positioned to defend market share against competitive pressures.
Which stock offers better returns?
The past year showed contrasting dynamics: T. Rowe Price fell sharply, accelerating losses, while Franklin Resources edged higher with growing momentum.
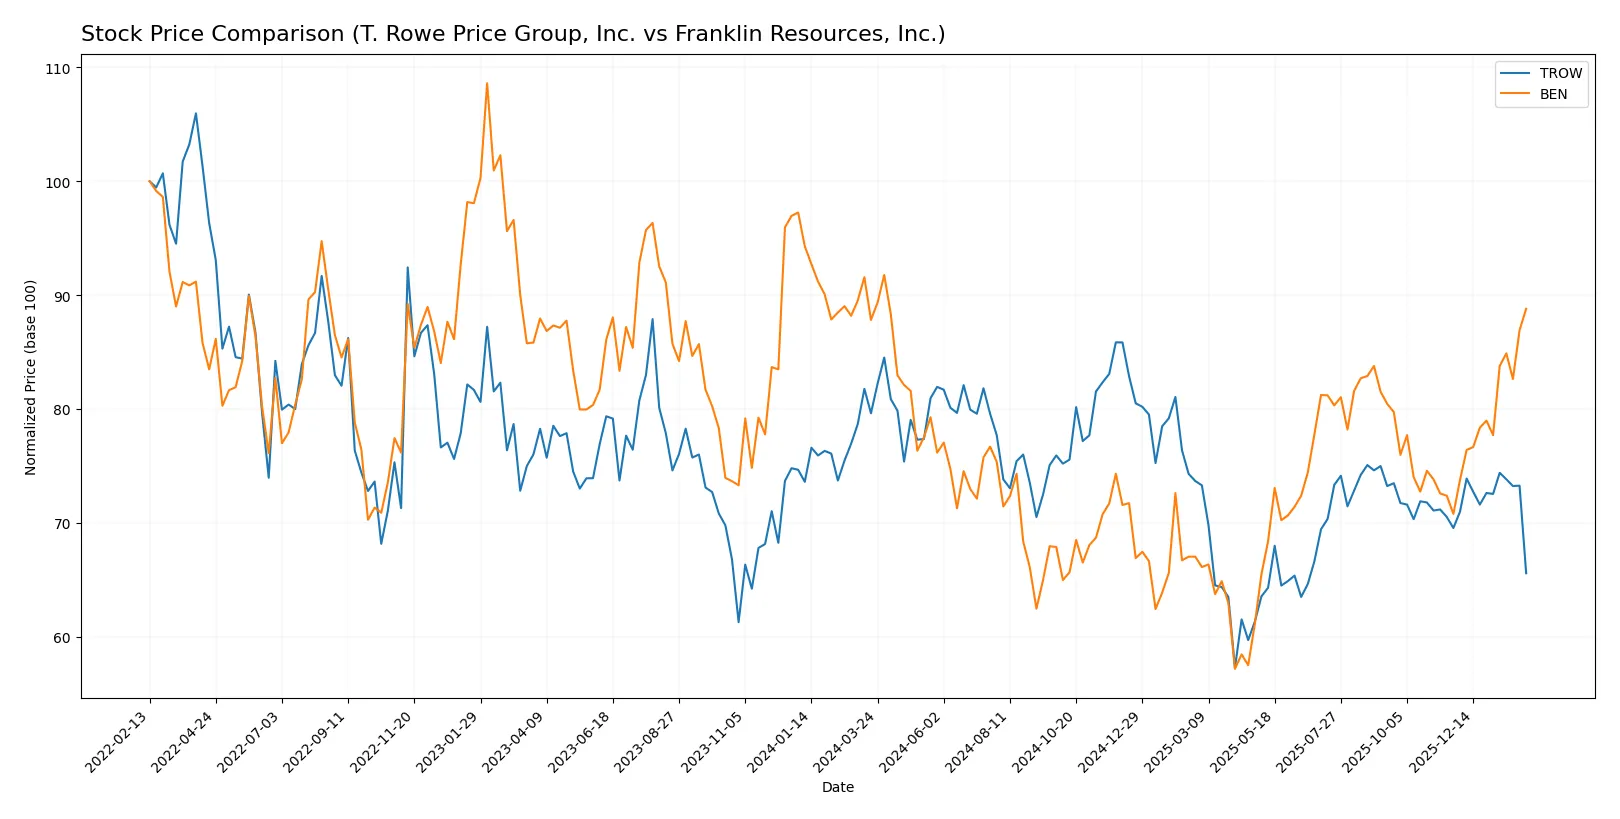
Trend Comparison
T. Rowe Price’s stock declined 17.66% over the past 12 months, marking a bearish trend with accelerating downside and high volatility, from a high of 123.84 to a low of 82.6.
Franklin Resources gained 1.12% over the same period, showing a mild bullish trend with accelerating gains and lower volatility, peaking at 28.11 and bottoming at 17.51.
Comparing trends, Franklin Resources delivered the highest market performance, reversing strongly in recent months while T. Rowe Price continued its bearish trajectory.
Target Prices
Analysts present a clear consensus on target prices for T. Rowe Price Group, Inc. and Franklin Resources, Inc.
| Company | Target Low | Target High | Consensus |
|---|---|---|---|
| T. Rowe Price Group, Inc. | 94 | 123 | 108.25 |
| Franklin Resources, Inc. | 22 | 25 | 23.5 |
For T. Rowe Price, the consensus target of 108.25 suggests upside from the current 94.58 price, indicating moderate growth expectations. Franklin Resources trades above its consensus target of 23.5 at 27.2, implying a potentially overvalued status or market optimism exceeding analyst forecasts.

Don’t Let Luck Decide Your Entry Point
Optimize your entry points with our advanced ProRealTime indicators. You’ll get efficient buy signals with precise price targets for maximum performance. Start outperforming now!
How do institutions grade them?
Below is a summary of recent institutional grades for both companies:
T. Rowe Price Group, Inc. Grades
This table shows the latest grades given by reputable institutions for T. Rowe Price Group, Inc.:
| Grading Company | Action | New Grade | Date |
|---|---|---|---|
| JP Morgan | Maintain | Underweight | 2026-02-05 |
| Evercore ISI Group | Maintain | In Line | 2026-02-05 |
| Keefe, Bruyette & Woods | Maintain | Market Perform | 2026-02-05 |
| TD Cowen | Maintain | Hold | 2026-02-05 |
| Morgan Stanley | Maintain | Equal Weight | 2026-02-03 |
| JP Morgan | Maintain | Underweight | 2026-01-20 |
| Barclays | Maintain | Underweight | 2026-01-15 |
| TD Cowen | Maintain | Hold | 2026-01-14 |
| Morgan Stanley | Maintain | Equal Weight | 2025-12-17 |
| Keefe, Bruyette & Woods | Maintain | Market Perform | 2025-12-17 |
Franklin Resources, Inc. Grades
This table presents the recent institutional grades for Franklin Resources, Inc.:
| Grading Company | Action | New Grade | Date |
|---|---|---|---|
| Morgan Stanley | Maintain | Underweight | 2026-02-03 |
| Evercore ISI Group | Maintain | Underperform | 2026-02-02 |
| Barclays | Maintain | Underweight | 2026-01-15 |
| TD Cowen | Maintain | Buy | 2026-01-14 |
| Barclays | Maintain | Underweight | 2025-12-12 |
| JP Morgan | Maintain | Neutral | 2025-11-10 |
| Barclays | Maintain | Underweight | 2025-10-21 |
| Evercore ISI Group | Maintain | Underperform | 2025-10-09 |
| B of A Securities | Maintain | Underperform | 2025-10-02 |
| Morgan Stanley | Maintain | Underweight | 2025-08-12 |
Which company has the best grades?
T. Rowe Price Group consistently receives neutral or below-neutral ratings, while Franklin Resources mostly faces underweight and underperform grades but has a notable Buy from TD Cowen. Investors may interpret T. Rowe’s broader institutional consensus as cautious but stable, whereas Franklin shows more mixed signals, indicating varied market confidence.
Risks specific to each company
The following categories identify critical pressure points and systemic threats facing both firms in the 2026 market environment:
1. Market & Competition
T. Rowe Price Group, Inc. (TROW)
- Strong net margin (28.53%) supports competitive resilience but faces high industry beta (1.544).
Franklin Resources, Inc. (BEN)
- Lower net margin (5.98%) and ROE (4.35%) reflect weaker competitive positioning, beta at 1.488 adds volatility risk.
2. Capital Structure & Debt
T. Rowe Price Group, Inc. (TROW)
- No debt reported, infinite interest coverage; balance sheet strength is a clear advantage.
Franklin Resources, Inc. (BEN)
- Higher debt-to-equity (1.1) and 41% debt-to-assets ratio increase financial risk despite good interest coverage.
3. Stock Volatility
T. Rowe Price Group, Inc. (TROW)
- Beta 1.544 implies above-market volatility; wider price range ($77.85–118.22) signals price swings.
Franklin Resources, Inc. (BEN)
- Beta 1.488 slightly less volatile; narrower price range ($16.25–27.94) but higher average volume suggests active trading.
4. Regulatory & Legal
T. Rowe Price Group, Inc. (TROW)
- Operates globally with diverse regulatory exposure; strong governance focus mitigates risks.
Franklin Resources, Inc. (BEN)
- US and India presence increases regulatory complexity; legal risk manageable but requires monitoring.
5. Supply Chain & Operations
T. Rowe Price Group, Inc. (TROW)
- Global footprint with offices in 20+ countries supports operational flexibility.
Franklin Resources, Inc. (BEN)
- Limited geographic diversification compared to TROW may increase operational risk.
6. ESG & Climate Transition
T. Rowe Price Group, Inc. (TROW)
- Integrates ESG in investment process, enhancing reputation and compliance with emerging standards.
Franklin Resources, Inc. (BEN)
- ESG focus less emphasized; potential lag in climate transition could affect long-term positioning.
7. Geopolitical Exposure
T. Rowe Price Group, Inc. (TROW)
- Extensive global presence exposes TROW to geopolitical risks but also diversifies revenue streams.
Franklin Resources, Inc. (BEN)
- Exposure concentrated mainly in US and India, which may limit geopolitical risk diversification.
Which company shows a better risk-adjusted profile?
T. Rowe Price’s strongest risk lies in market volatility amplified by its high beta and global geopolitical exposure. Franklin Resources faces its biggest challenge in capital structure due to elevated debt levels raising financial risk. Between the two, TROW offers a better risk-adjusted profile, supported by a zero-debt balance sheet and higher profitability. Notably, TROW’s Altman Z-score of 4.9 places it firmly in the safe zone, while BEN’s 1.47 signals distress risk despite a strong Piotroski score, underscoring the critical debt concern investors must monitor.
Final Verdict: Which stock to choose?
T. Rowe Price Group, Inc. (TROW) stands out as a cash-generating powerhouse with a proven ability to create value above its capital costs. Its declining profitability calls for vigilance, but its strong returns and dividend yield suit aggressive growth portfolios seeking resilience amid market swings.
Franklin Resources, Inc. (BEN) offers a strategic moat rooted in its solid balance sheet and stable income quality. While it lacks the robust profitability of TROW, BEN’s financial safety and consistent cash flow appeal to Growth at a Reasonable Price (GARP) investors favoring stability over rapid expansion.
If you prioritize superior value creation and robust returns, TROW outshines thanks to its efficient capital use despite recent profit pressures. However, if you seek better financial stability and a more defensive stance, BEN offers a safer profile with steady cash flow—albeit at the expense of growth dynamism.
Disclaimer: Investment carries a risk of loss of initial capital. The past performance is not a reliable indicator of future results. Be sure to understand risks before making an investment decision.
Go Further
I encourage you to read the complete analyses of T. Rowe Price Group, Inc. and Franklin Resources, Inc. to enhance your investment decisions: