Home > Comparison > Financial Services > STT vs BEN
The strategic rivalry between State Street Corporation and Franklin Resources, Inc. shapes the financial services landscape. State Street operates as a capital-intensive asset servicer with global investment operations, while Franklin Resources focuses on asset management through diversified mutual funds. This contrast highlights a duel between scale-driven service provision and active fund management. This analysis aims to identify which corporate trajectory offers a superior risk-adjusted return for a diversified portfolio in today’s evolving market environment.
Table of contents
Companies Overview
State Street Corporation and Franklin Resources, Inc. hold pivotal roles in asset management with distinct market approaches.
State Street Corporation: Institutional Financial Services Powerhouse
State Street Corporation dominates as a global institutional financial services provider. It generates revenue through investment servicing, custody, and tailored analytics for institutional investors. In 2026, it emphasizes expanding portfolio management and risk analytics capabilities while leveraging its SPDR ETF brand to strengthen its market position.
Franklin Resources, Inc.: Diverse Asset Manager with Global Reach
Franklin Resources, Inc. operates as a publicly owned asset management holding company. It earns revenue by launching mutual funds across equity, fixed income, and multi-asset classes, serving individuals and institutions. The 2026 strategy focuses on diversifying investment offerings and expanding its footprint with offices in the US and India.
Strategic Collision: Similarities & Divergences
Both firms compete in asset management but diverge in strategy—State Street prioritizes institutional custody and analytics, while Franklin targets broad mutual fund distribution. Their battleground lies in attracting institutional versus retail investors. This creates distinct investment profiles: State Street offers stability through service integration, Franklin bets on product diversity and global expansion.
Income Statement Comparison
This data dissects the core profitability and scalability of both corporate engines to reveal who dominates the bottom line:
| Metric | State Street Corporation (STT) | Franklin Resources, Inc. (BEN) |
|---|---|---|
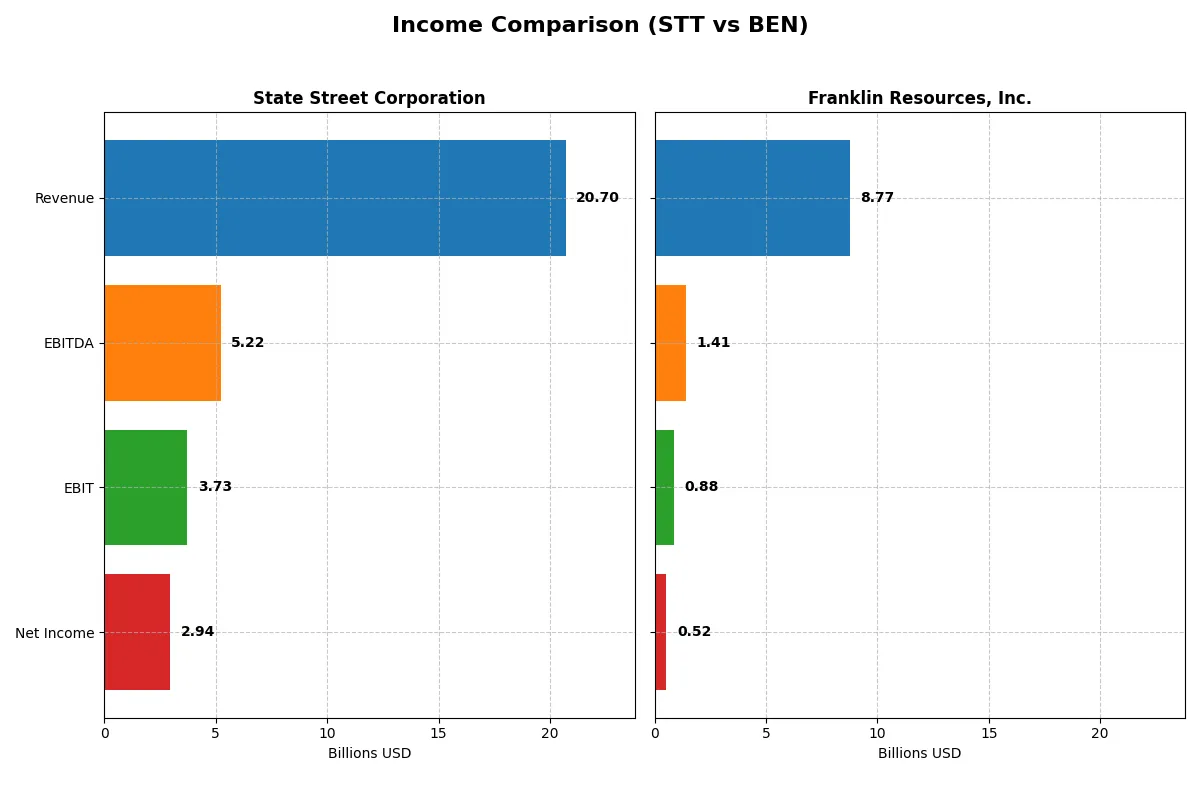
| Revenue | 20.7B | 8.8B |
| Cost of Revenue | 6.8B | 1.7B |
| Operating Expenses | 10.2B | 6.4B |
| Gross Profit | 13.9B | 7.0B |
| EBITDA | 5.2B | 1.4B |
| EBIT | 3.7B | 882M |
| Interest Expense | 8.7B | 95M |
| Net Income | 2.9B | 525M |
| EPS | 9.56 | 0.91 |
| Fiscal Year | 2025 | 2025 |
Income Statement Analysis: The Bottom-Line Duel
The following income statement comparison reveals which company leverages its revenue most efficiently to deliver shareholder value in today’s market environment.
State Street Corporation Analysis
State Street’s revenue rose 72% from 2021 to 2025 but dipped 5.8% in the last year to $20.7B. Net income grew steadily to $2.95B in 2025 with a solid 14.2% net margin, up 16.3% year-over-year. Its gross margin at 67.2% and EBIT margin at 18.0% indicate consistent operational efficiency despite a high 42% interest expense ratio.
Franklin Resources, Inc. Analysis
Franklin Resources shows modest revenue growth of 4.1% over five years, reaching $8.8B in 2025, with a slight 3.5% increase last year. Net income fell sharply, down 71% over the period to $525M, with a 6.0% net margin improving 9.2% in the past year. Its 80.3% gross margin is strong, but EBIT margin at 10.1% and minimal interest expense highlight tighter profitability dynamics.
Margin Efficiency vs. Revenue Growth
State Street dominates in revenue scale and margin expansion, significantly growing EPS and net income despite a revenue dip last year. Franklin Resources maintains higher gross margins but suffers from declining net income and weaker bottom-line growth. For investors, State Street’s profile offers stronger fundamentals and momentum in profitability.
Financial Ratios Comparison
These vital ratios act as a diagnostic tool to expose the underlying fiscal health, valuation premiums, and capital efficiency of the companies compared below:
| Ratios | State Street Corporation (STT) | Franklin Resources, Inc. (BEN) |
|---|---|---|
| ROE | 10.58% | 4.35% |
| ROIC | 2.72% | 1.38% |
| P/E | 12.27 | 22.67 |
| P/B | 1.30 | 0.99 |
| Current Ratio | 3.59 | 2.71 |
| Quick Ratio | 3.59 | 2.71 |
| D/E (Debt-to-Equity) | 1.07 | 1.10 |
| Debt-to-Assets | 8.14% | 41.09% |
| Interest Coverage | 0.43 | 6.37 |
| Asset Turnover | 0.06 | 0.27 |
| Fixed Asset Turnover | 6.52 | 5.12 |
| Payout ratio | 29.66% | 130.25% |
| Dividend yield | 2.42% | 5.75% |
| Fiscal Year | 2025 | 2025 |
Efficiency & Valuation Duel: The Vital Signs
Financial ratios act as a company’s DNA, revealing hidden risks and operational excellence that shape investor confidence and valuation.
State Street Corporation
State Street posts a solid 10.58% ROE with a strong 14.23% net margin, signaling consistent profitability. Its P/E of 12.27 and P/B of 1.3 indicate the stock trades at a reasonable valuation. The 2.42% dividend yield further supports shareholder returns, balancing income with moderate operational efficiency.
Franklin Resources, Inc.
Franklin Resources shows a weaker 4.35% ROE and a moderate 5.98% net margin, reflecting subdued profitability. Its P/E at 22.67 and P/B just under 1 suggest a fairly valued but less efficient stock. The higher 5.75% dividend yield offers income but contrasts with modest operational returns, highlighting cautious capital deployment.
Valuation Discipline vs. Dividend Appeal
State Street delivers a better balance of profitability and valuation, trading cheaper on earnings with more efficient returns. Franklin appeals with a higher dividend but weaker core profitability and stretched valuation multiples. Investors seeking operational strength may prefer State Street, while income-focused profiles might lean toward Franklin.
Which one offers the Superior Shareholder Reward?
I find State Street Corporation (STT) and Franklin Resources, Inc. (BEN) follow distinct shareholder reward strategies. STT yields around 2.4% with a moderate payout ratio near 30%, balancing dividends and buybacks sustainably. BEN offers a higher dividend yield above 5.7%, but with payout ratios exceeding 100%, signaling dividend coverage risk. STT’s buyback intensity is steady, supporting capital return without jeopardizing financial health. BEN’s aggressive payouts rely heavily on free cash flow, which is less consistent. I conclude STT provides a more balanced, sustainable total return profile for 2026 investors.
Comparative Score Analysis: The Strategic Profile
The radar chart reveals the fundamental DNA and trade-offs of State Street Corporation and Franklin Resources, Inc., offering a direct visual of their financial strengths and weaknesses:
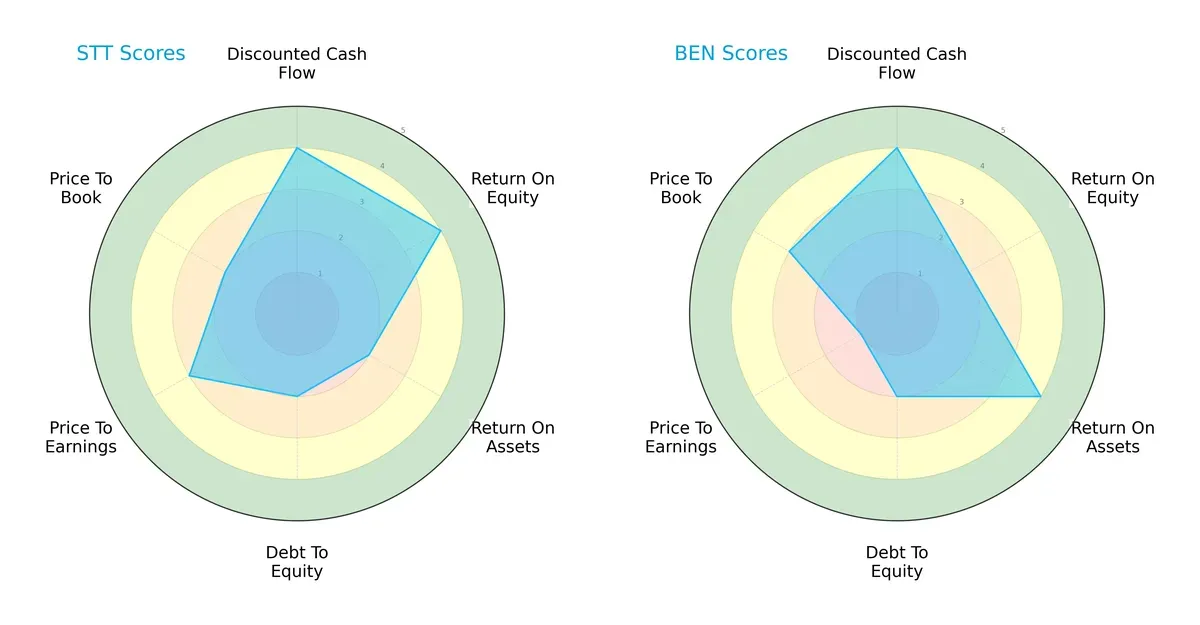
State Street shows strength in Return on Equity (ROE) and Discounted Cash Flow (DCF) with scores of 4 each, but lags in Return on Assets (ROA) and Debt/Equity at 2. Franklin Resources excels in ROA with a 4 but scores lower in ROE at 2 and suffers from a very unfavorable Price to Earnings (P/E) score of 1. State Street maintains a more balanced profile across key metrics, while Franklin Resources relies heavily on asset efficiency but appears undervalued by the market.
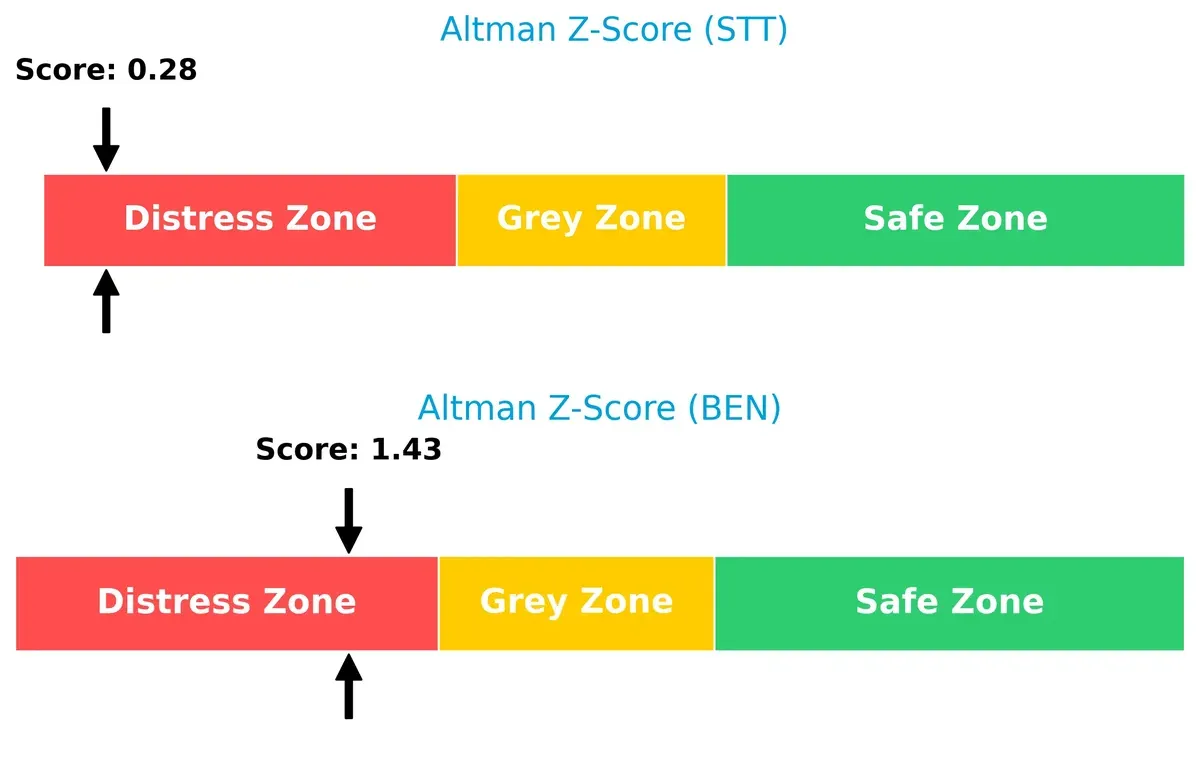
Bankruptcy Risk: Solvency Showdown
State Street’s Altman Z-Score stands at 0.28, while Franklin Resources scores 1.43; both fall in the distress zone, signaling significant bankruptcy risk in this cycle:
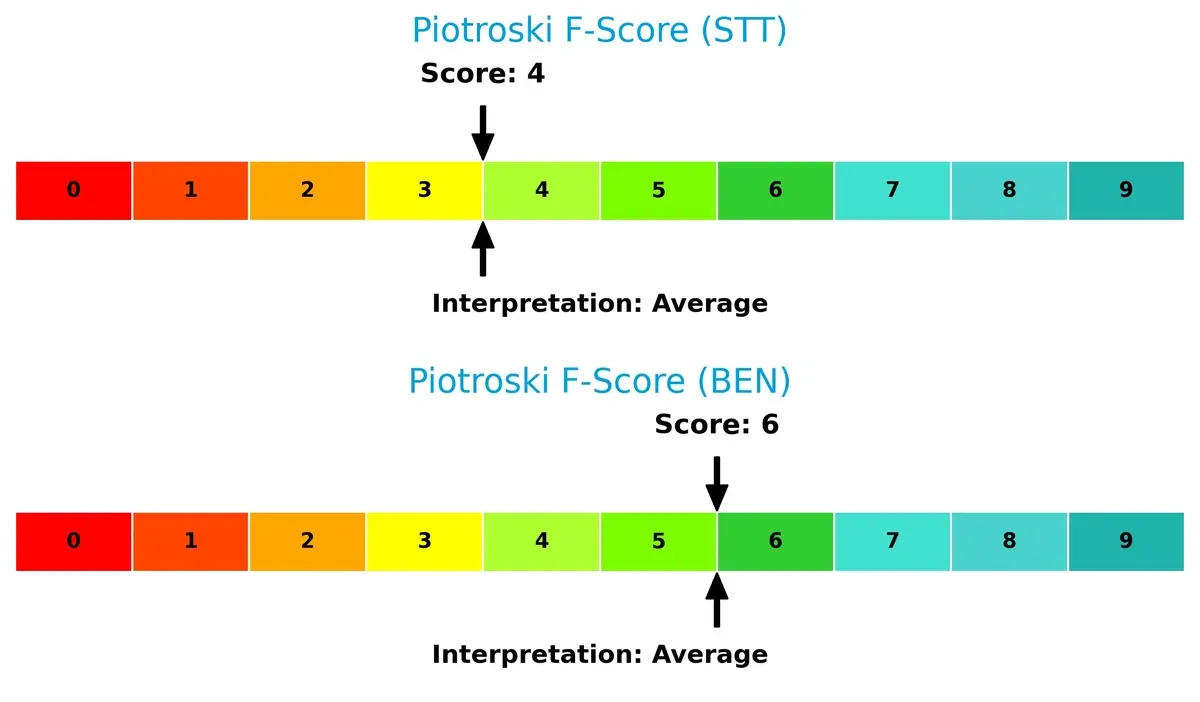
Financial Health: Quality of Operations
Franklin Resources outperforms with a Piotroski F-Score of 6, indicating stronger financial health compared to State Street’s 4, which raises moderate internal red flags:
How are the two companies positioned?
This section dissects the operational DNA of State Street and Franklin Resources by comparing their revenue distribution by segment and internal dynamics. The goal is to confront their economic moats to identify which model offers the most resilient competitive advantage today.
Revenue Segmentation: The Strategic Mix
This visual comparison dissects how State Street Corporation and Franklin Resources diversify their income streams and reveals where their primary sector bets lie:
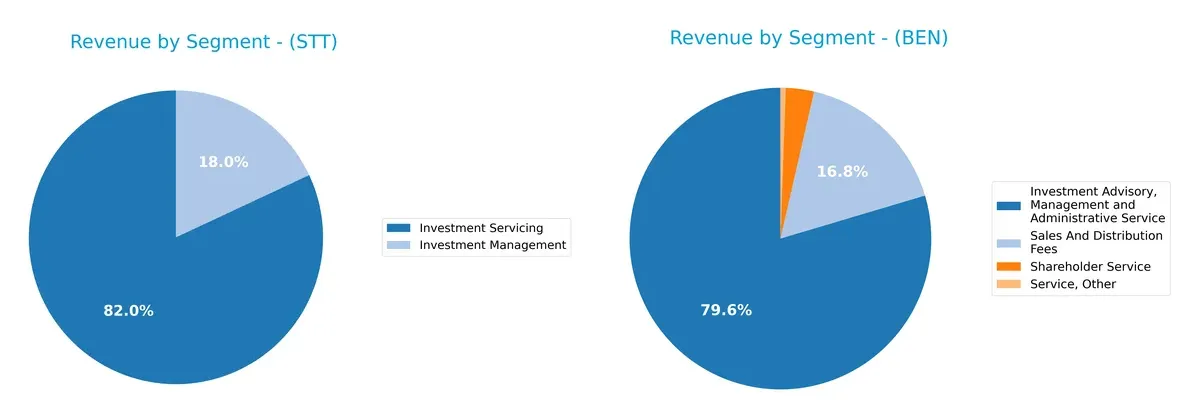
State Street leans heavily on its Investment Servicing segment, generating $10.7B in 2024, dwarfing its $2.3B Investment Management revenue. Franklin Resources presents a more diversified mix, with $6.8B from Investment Advisory, Management, and Administrative Services, plus $1.4B from Sales and Distribution Fees. State Street’s concentration suggests strength in infrastructure dominance but higher segment risk. Franklin’s broader spread reduces dependency on any one stream, enhancing resilience amid market shifts.
Strengths and Weaknesses Comparison
This table compares the strengths and weaknesses of State Street Corporation and Franklin Resources, Inc.:
STT Strengths
- Strong net margin at 14.23%
- Favorable P/E of 12.27 supports valuation
- High quick ratio at 3.59 indicates liquidity
- Low debt-to-assets ratio at 8.14% reduces financial risk
- Significant revenue from investment servicing segment
- Balanced US and Non-US revenue streams
BEN Strengths
- Favorable WACC at 6.7% lowers capital costs
- Strong interest coverage at 9.29 signals debt service ability
- Favorable P/B at 0.99 suggests undervaluation
- Good current and quick ratios at 2.71 support liquidity
- Substantial investment advisory revenue
- Diverse geographic presence including Luxembourg and Asia Pacific
STT Weaknesses
- ROIC at 2.72% below WACC of 16.53% signals poor capital returns
- High current ratio at 3.59 may indicate inefficient asset use
- Debt-to-equity of 1.07 suggests leverage concerns
- Low interest coverage of 0.43 raises financial risk
- Low asset turnover at 0.06 implies operational inefficiency
BEN Weaknesses
- ROE at 4.35% is weak for industry standards
- ROIC at 1.38% below WACC of 6.7% indicates value destruction
- Higher debt-to-equity at 1.1 increases leverage risk
- Asset turnover at 0.27 remains low, limiting profitability
- Dividend yield neutrality may reflect payout uncertainty
Overall, both companies show slightly favorable financial profiles but face challenges in capital efficiency and operational turnover. STT’s strong net margin contrasts with BEN’s weaker profitability metrics. Each must address leverage and asset utilization to strengthen competitive positioning.
The Moat Duel: Analyzing Competitive Defensibility
A structural moat is the only true barrier protecting long-term profits from relentless competitive erosion:
State Street Corporation: Network Effects and Scale Economies
State Street’s moat stems from deep network effects and scale in institutional asset servicing. Its stable margins and rising EPS reflect operational leverage. However, tech innovation and market shifts in 2026 may pressure this advantage.
Franklin Resources, Inc.: Intangible Assets and Brand Legacy
Franklin’s moat relies on strong brand recognition and proprietary investment strategies, contrasting with State Street’s scale focus. Its high gross margin supports pricing power, but declining ROIC signals challenges to sustaining value creation.
Verdict: Network Effects vs. Brand Intangibles
Both firms face declining ROIC trends, indicating value destruction risks. State Street’s scale-based moat is wider but under tech disruption. Franklin’s intangible moat is narrower and weakening. State Street is better positioned to defend market share in 2026.
Which stock offers better returns?
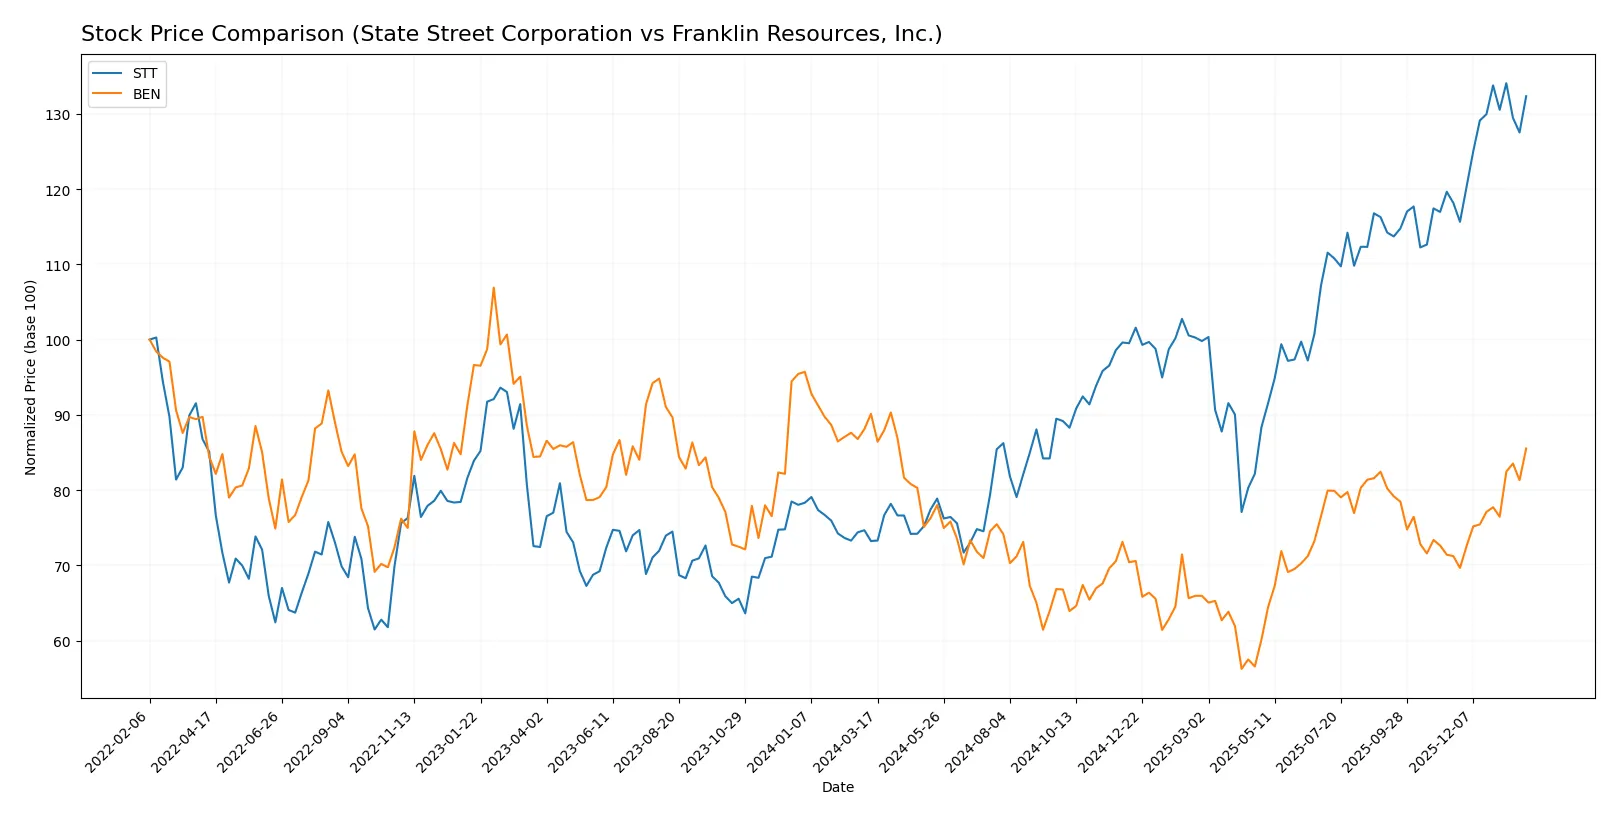
Over the past year, State Street Corporation’s stock surged sharply, showing strong acceleration, while Franklin Resources, Inc. faced a decline despite recent recovery signs.
Trend Comparison
State Street Corporation’s stock price rose 80.67% over the past year, indicating a bullish trend with accelerating momentum and notable volatility (16.89 std deviation). The price ranged from 70.91 to 132.57.
Franklin Resources, Inc. declined 5.1% over the last year, reflecting a bearish trend despite acceleration. Its price fluctuated between 17.51 and 28.11, with low volatility (2.3 std deviation).
State Street’s 80.67% gain significantly outperforms Franklin Resources’ -5.1%, marking State Street as the stronger market performer over this period.
Target Prices
The current analyst consensus reveals moderate upside potential for these asset management firms.
| Company | Target Low | Target High | Consensus |
|---|---|---|---|
| State Street Corporation | 128 | 164 | 142.17 |
| Franklin Resources, Inc. | 25 | 25 | 25 |
State Street’s consensus target at 142.17 suggests a 9% upside from the current 130.86 price. Franklin Resources trades slightly above its 25 consensus target, indicating limited near-term price appreciation.

Don’t Let Luck Decide Your Entry Point
Optimize your entry points with our advanced ProRealTime indicators. You’ll get efficient buy signals with precise price targets for maximum performance. Start outperforming now!
How do institutions grade them?
Here is a summary of recent institutional grades assigned to both companies:
State Street Corporation Grades
The table below lists recent grades from major financial institutions for State Street Corporation.
| Grading Company | Action | New Grade | Date |
|---|---|---|---|
| Morgan Stanley | Maintain | Overweight | 2026-01-20 |
| Truist Securities | Downgrade | Hold | 2026-01-07 |
| TD Cowen | Maintain | Buy | 2026-01-07 |
| Barclays | Downgrade | Equal Weight | 2026-01-05 |
| Citigroup | Maintain | Buy | 2025-12-30 |
| Citigroup | Maintain | Buy | 2025-10-24 |
| Truist Securities | Maintain | Buy | 2025-10-20 |
| Wells Fargo | Maintain | Overweight | 2025-10-20 |
| Morgan Stanley | Maintain | Overweight | 2025-10-20 |
| Keefe, Bruyette & Woods | Maintain | Outperform | 2025-10-20 |
Franklin Resources, Inc. Grades
Below are recent grades from reputable institutions for Franklin Resources, Inc.
| Grading Company | Action | New Grade | Date |
|---|---|---|---|
| Barclays | Maintain | Underweight | 2026-01-15 |
| TD Cowen | Maintain | Buy | 2026-01-14 |
| Barclays | Maintain | Underweight | 2025-12-12 |
| JP Morgan | Maintain | Neutral | 2025-11-10 |
| Barclays | Maintain | Underweight | 2025-10-21 |
| Evercore ISI Group | Maintain | Underperform | 2025-10-09 |
| B of A Securities | Maintain | Underperform | 2025-10-02 |
| Morgan Stanley | Maintain | Underweight | 2025-08-12 |
| JP Morgan | Maintain | Neutral | 2025-08-04 |
| Barclays | Maintain | Underweight | 2025-08-04 |
Which company has the best grades?
State Street Corporation consistently receives positive ratings, including multiple Buy and Overweight grades. Franklin Resources, Inc. shows predominantly Underweight and Neutral ratings, with some Underperform grades. Investors may interpret State Street’s superior grades as a sign of stronger institutional confidence.
Risks specific to each company
The following categories identify critical pressure points and systemic threats facing both firms in the challenging 2026 market environment:
1. Market & Competition
State Street Corporation
- Faces intense competition from global asset managers and fintech disruptors amid shifting institutional client demands.
Franklin Resources, Inc.
- Competes in a crowded, fee-compressed asset management space with pressure from passive investment trends and evolving client preferences.
2. Capital Structure & Debt
State Street Corporation
- Moderate debt-to-equity ratio (~1.07) with weak interest coverage (0.43x) signals potential financial strain on servicing debt.
Franklin Resources, Inc.
- Similar debt-to-equity (~1.1) but strong interest coverage (9.29x) indicates better capacity to manage debt costs.
3. Stock Volatility
State Street Corporation
- Beta of 1.45 suggests higher-than-market volatility, reflecting sensitivity to financial sector swings.
Franklin Resources, Inc.
- Slightly higher beta (1.47) indicates comparable volatility and market sensitivity in a cyclical sector.
4. Regulatory & Legal
State Street Corporation
- Subject to stringent fiduciary and data privacy regulations, with global compliance complexity increasing costs.
Franklin Resources, Inc.
- Faces regulatory scrutiny on fund management practices and cross-border operations, adding compliance burden.
5. Supply Chain & Operations
State Street Corporation
- Operational risks include technology infrastructure resilience and outsourcing dependencies in data and custody services.
Franklin Resources, Inc.
- Operationally focused on fund management systems; potential vulnerability in tech upgrades and talent retention.
6. ESG & Climate Transition
State Street Corporation
- Strong ESG integration as a service provider, but exposed to reputational risks if ESG funds underperform or face backlash.
Franklin Resources, Inc.
- Building ESG capabilities but lags peers in product innovation, risking client attrition amid growing sustainable investment demand.
7. Geopolitical Exposure
State Street Corporation
- Global institutional footprint exposes it to geopolitical risks, including sanctions, currency volatility, and trade tensions.
Franklin Resources, Inc.
- Significant international exposure, notably through emerging markets, increasing vulnerability to geopolitical shocks.
Which company shows a better risk-adjusted profile?
State Street’s biggest risk lies in its weak interest coverage, signaling financial strain despite a solid market position. Franklin Resources faces valuation risk with a stretched P/E ratio and moderate profitability. Between the two, Franklin shows a better ability to service debt and a stronger operational footing, offering a comparatively safer risk-adjusted profile. Notably, State Street’s Altman Z-score in the distress zone underscores urgent solvency concerns, while Franklin’s higher Piotroski score reflects steadier financial health.
Final Verdict: Which stock to choose?
State Street Corporation’s superpower lies in its robust income statement and strong cash flow generation, reflecting operational resilience. However, its declining ROIC versus WACC signals value destruction—a key point of vigilance. It suits portfolios seeking aggressive growth with a tolerance for cyclical volatility and capital efficiency challenges.
Franklin Resources, Inc. boasts a strategic moat in its stable recurring revenue and superior interest coverage, offering a safer defensive profile than State Street. Its more conservative balance sheet and dividend yield align well with GARP investors who prioritize income stability alongside moderate growth potential.
If you prioritize operational efficiency and growth momentum, State Street emerges as the compelling choice due to its superior earnings yield and recent bullish price acceleration. However, if you seek steadier income and capital preservation, Franklin Resources offers better stability with its safer credit profile and consistent cash flows. Both face valuation and profitability headwinds, so careful risk assessment is essential.
Disclaimer: Investment carries a risk of loss of initial capital. The past performance is not a reliable indicator of future results. Be sure to understand risks before making an investment decision.
Go Further
I encourage you to read the complete analyses of State Street Corporation and Franklin Resources, Inc. to enhance your investment decisions: