Home > Comparison > Financial Services > NTRS vs BEN
The strategic rivalry between Northern Trust Corporation and Franklin Resources, Inc. shapes the competitive landscape of financial services. Northern Trust operates as a diversified wealth manager with extensive asset servicing capabilities. Franklin Resources focuses on asset management through a broad suite of mutual funds and investment products. This analysis explores their contrasting operational models and investment approaches to identify which company offers superior risk-adjusted returns for a diversified portfolio.
Table of contents
Companies Overview
Northern Trust Corporation and Franklin Resources, Inc. stand as key players shaping the asset management landscape in 2026.
Northern Trust Corporation: Global Wealth and Asset Servicing Leader
Northern Trust Corporation defines itself as a comprehensive financial holding company focused on wealth management and asset servicing. Its core revenue stems from servicing institutions and high-net-worth clients through custody, investment management, and banking solutions. In 2026, the firm emphasizes expanding its asset servicing capabilities, targeting institutional investors with sophisticated risk management and analytical services to solidify market leadership.
Franklin Resources, Inc.: Diversified Asset Management Specialist
Franklin Resources, Inc. operates as a publicly owned asset management holding company, generating revenues by launching and managing equity, fixed income, and multi-asset mutual funds. It serves individuals and institutions through global investment platforms. The company’s strategic focus in 2026 lies in diversifying asset classes and expanding alternative investments, seeking to capture growth in public and private markets while maintaining broad client access.
Strategic Collision: Similarities & Divergences
Both firms operate within asset management, but Northern Trust prioritizes bespoke institutional and wealth management services, while Franklin Resources leans on mutual fund offerings and diversified asset classes. Their competitive battleground centers on institutional client acquisition versus retail and multi-asset fund distribution. Northern Trust’s focus on high-touch service contrasts with Franklin’s broad market access, creating distinct investment profiles shaped by client type and product complexity.
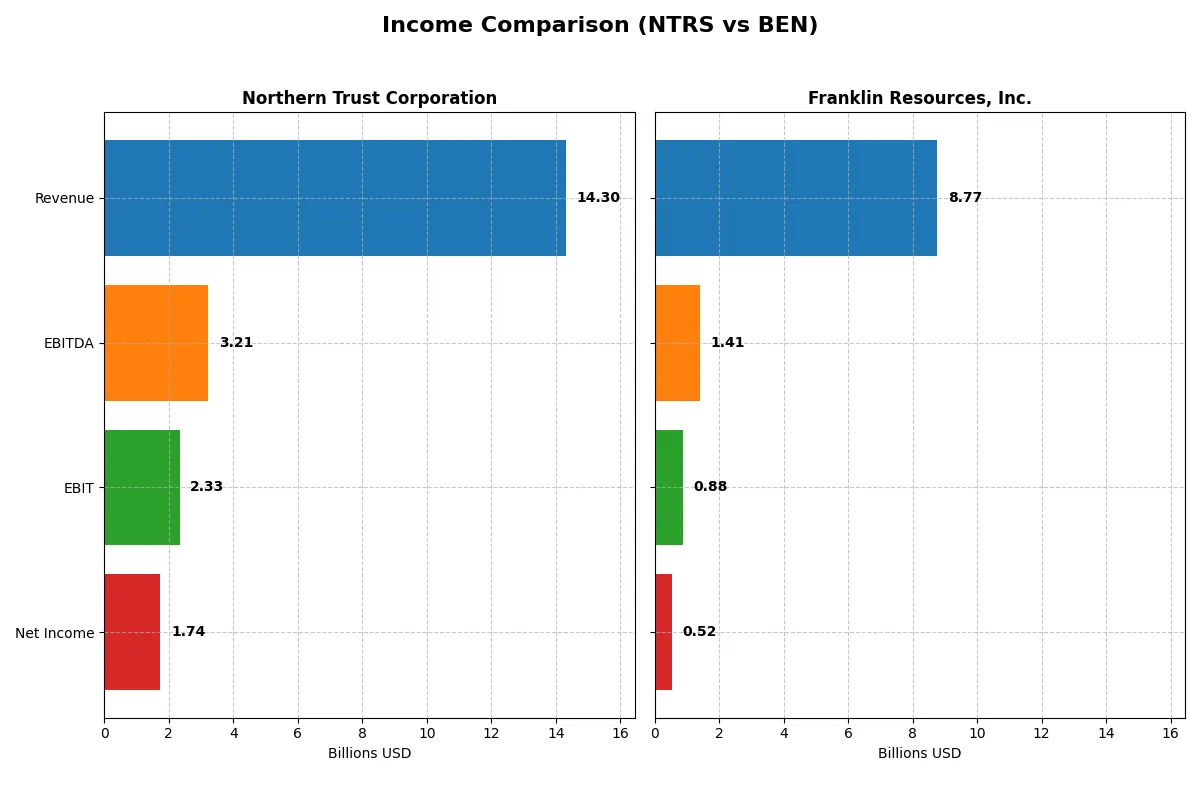
Income Statement Comparison
The following data dissects the core profitability and scalability of both corporate engines to reveal who dominates the bottom line:
| Metric | Northern Trust Corporation (NTRS) | Franklin Resources, Inc. (BEN) |
|---|---|---|
| Revenue | 14.3B | 8.8B |
| Cost of Revenue | 6.2B | 1.7B |
| Operating Expenses | 5.8B | 6.4B |
| Gross Profit | 8.1B | 7.0B |
| EBITDA | 3.2B | 1.4B |
| EBIT | 2.3B | 882M |
| Interest Expense | 6.2B | 95M |
| Net Income | 1.7B | 525M |
| EPS | 8.79 | 0.91 |
| Fiscal Year | 2025 | 2025 |
Income Statement Analysis: The Bottom-Line Duel
This income statement comparison reveals which company drives superior financial efficiency and profitability in their respective markets.
Northern Trust Corporation Analysis
Northern Trust’s revenue grew 120% from 2021 to 2025, reaching $14.3B in 2025, but declined nearly 10% year-over-year. Its gross margin remains robust at 56.5%, while net margin holds at a healthy 12.2%. Despite a 10.5% EPS drop last year, Northern Trust sustains strong profitability and operational discipline amid margin pressure.
Franklin Resources, Inc. Analysis
Franklin Resources posts $8.77B in 2025 revenue, up 3.5% year-over-year but only 4.1% over five years. It boasts an impressive 80.3% gross margin but a lower net margin of 6.0%. EPS rose 7% last year, reflecting modest efficiency gains, though long-term net income and margins have contracted significantly.
Margin Strength vs. Growth Resilience
Northern Trust leads in long-term revenue growth and superior net margins, reflecting stronger operational leverage. Franklin Resources excels in gross margin but struggles with net margin and income erosion over time. Investors favor Northern Trust’s consistent profit expansion and margin resilience over Franklin’s narrower profitability profile.
Financial Ratios Comparison
These vital ratios act as a diagnostic tool to expose the underlying fiscal health, valuation premiums, and capital efficiency of the companies compared below:
| Ratios | Northern Trust Corporation (NTRS) | Franklin Resources, Inc. (BEN) |
|---|---|---|
| ROE | 13.40% | 4.35% |
| ROIC | 5.04% | 1.38% |
| P/E | 14.75 | 22.67 |
| P/B | 1.98 | 0.99 |
| Current Ratio | 0.41 | 2.71 |
| Quick Ratio | 0.41 | 2.71 |
| D/E | 1.27 | 1.10 |
| Debt-to-Assets | 9.27% | 41.09% |
| Interest Coverage | 0.38 | 6.37 |
| Asset Turnover | 0.08 | 0.27 |
| Fixed Asset Turnover | 30.78 | 5.12 |
| Payout ratio | 33.47% | 130.25% |
| Dividend yield | 2.27% | 5.75% |
| Fiscal Year | 2025 | 2025 |
Efficiency & Valuation Duel: The Vital Signs
Financial ratios serve as the company’s DNA, uncovering hidden risks and operational strengths essential for investment analysis.
Northern Trust Corporation
Northern Trust shows solid profitability with a 13.4% ROE and a favorable 12.15% net margin, signaling operational efficiency. Its P/E of 14.75 suggests reasonable valuation, not stretched. The company rewards shareholders with a 2.27% dividend yield, reflecting steady income distribution amid moderate reinvestment needs.
Franklin Resources, Inc.
Franklin Resources displays weaker profitability, with a 4.35% ROE and a neutral 5.98% net margin, indicating operational challenges. Its P/E of 22.67 appears neutral, but the firm maintains a higher 5.75% dividend yield. The balance sheet strength supports this payout, despite modest returns on invested capital.
Risk-Return Balance: Stability Versus Yield
Northern Trust offers a more efficient profitability profile combined with a modest valuation, balancing risk and reward better. Franklin Resources leans toward higher dividend income but suffers from lower operational returns. Investors prioritizing stable earnings efficiency may prefer Northern Trust, while income-focused profiles might consider Franklin Resources.
Which one offers the Superior Shareholder Reward?
I observe that Northern Trust (NTRS) delivers a moderate dividend yield near 3.1% with a payout ratio around 33%, supported by steady free cash flow and consistent buybacks, fueling long-term value. Franklin Resources (BEN) offers a higher dividend yield above 5.7% but with payout ratios exceeding 100%, signaling risk to sustainability despite robust buybacks. BEN’s capital allocation leans heavily on dividends, while NTRS balances dividends with prudent buybacks, preserving growth capital. I conclude NTRS provides a more sustainable shareholder reward in 2026, blending income with disciplined capital returns.
Comparative Score Analysis: The Strategic Profile
The radar chart reveals the fundamental DNA and trade-offs of Northern Trust Corporation and Franklin Resources, Inc.:
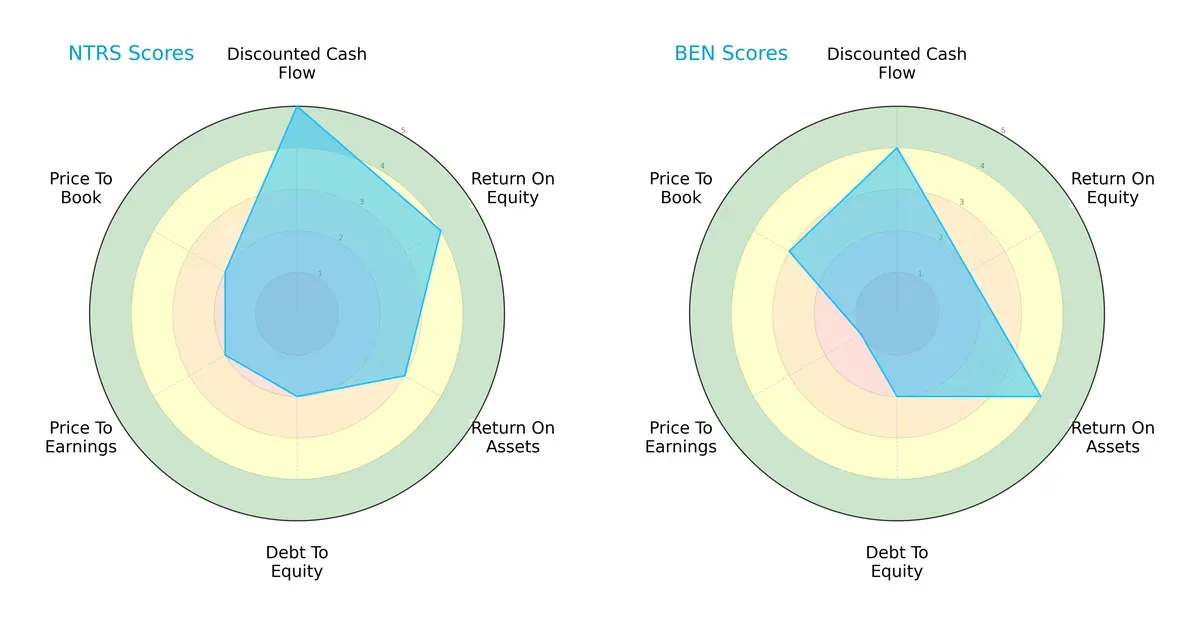
Northern Trust excels in discounted cash flow (5 vs. 4) and return on equity (4 vs. 2), showing a strong profit generation edge. Franklin Resources leads in return on assets (4 vs. 3) and price-to-book valuation (3 vs. 2), indicating better asset efficiency and relative market value. Both share moderate debt-to-equity scores (2), but Northern Trust maintains a more balanced profile, while Franklin Resources relies heavily on asset utilization and valuation metrics.
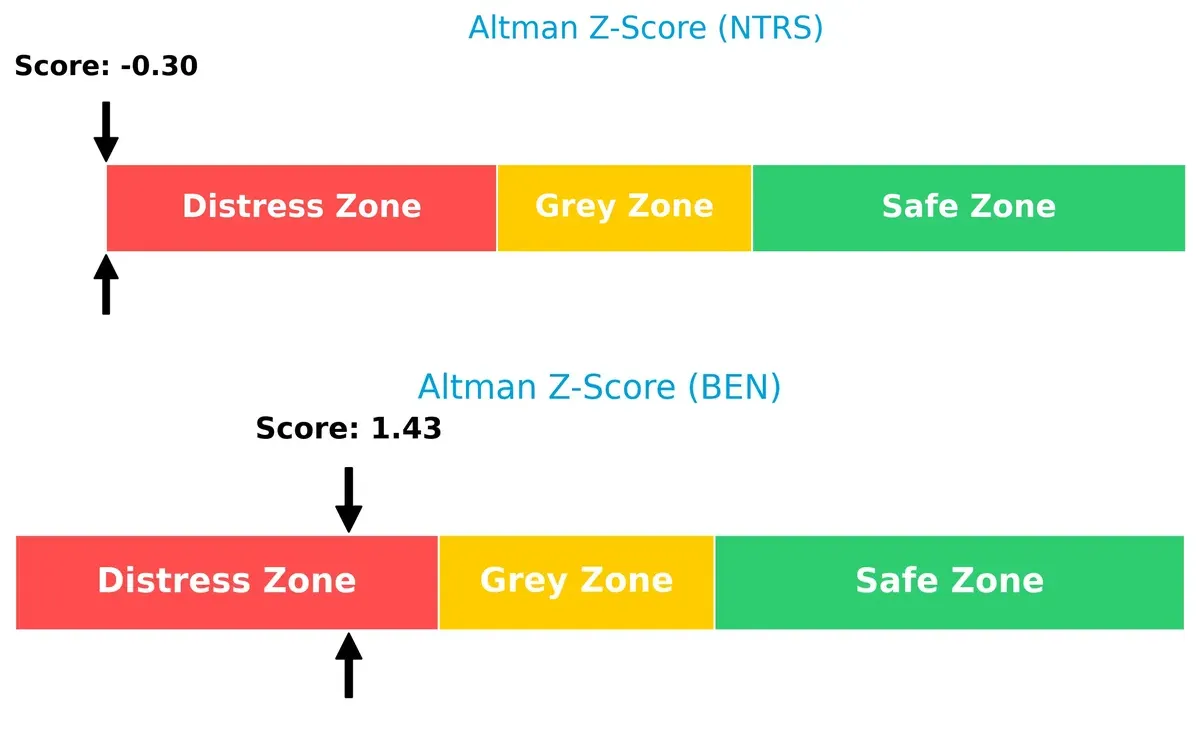
Bankruptcy Risk: Solvency Showdown
Northern Trust’s Altman Z-Score of -0.30 versus Franklin Resources’ 1.43 places both in the distress zone, signaling significant long-term solvency risks amid current market pressures:
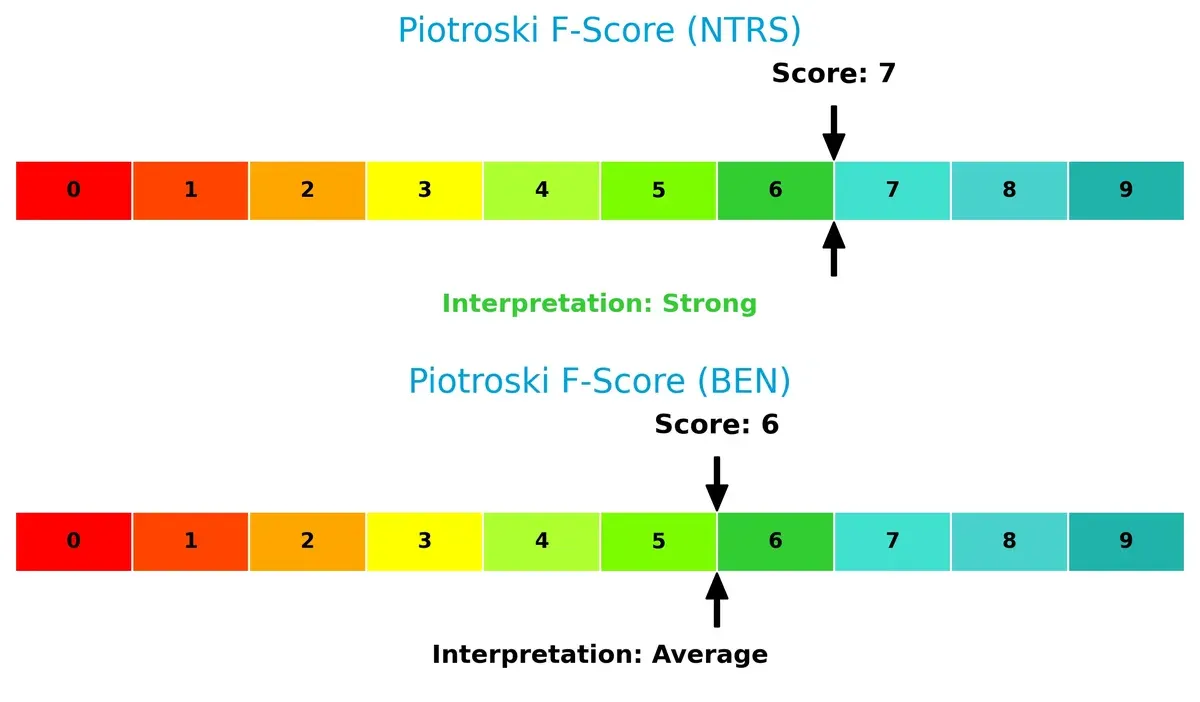
Financial Health: Quality of Operations
Northern Trust’s Piotroski F-Score of 7 outperforms Franklin Resources’ 6, indicating stronger operational quality and fewer red flags in financial health metrics:
How are the two companies positioned?
This section dissects the operational DNA of Northern Trust and Franklin Resources by comparing their revenue distribution and internal dynamics. The goal is to confront their economic moats, revealing which model offers the most resilient, sustainable advantage today.
Revenue Segmentation: The Strategic Mix
The following visual comparison dissects how Northern Trust Corporation and Franklin Resources diversify their income streams and where their primary sector bets lie:
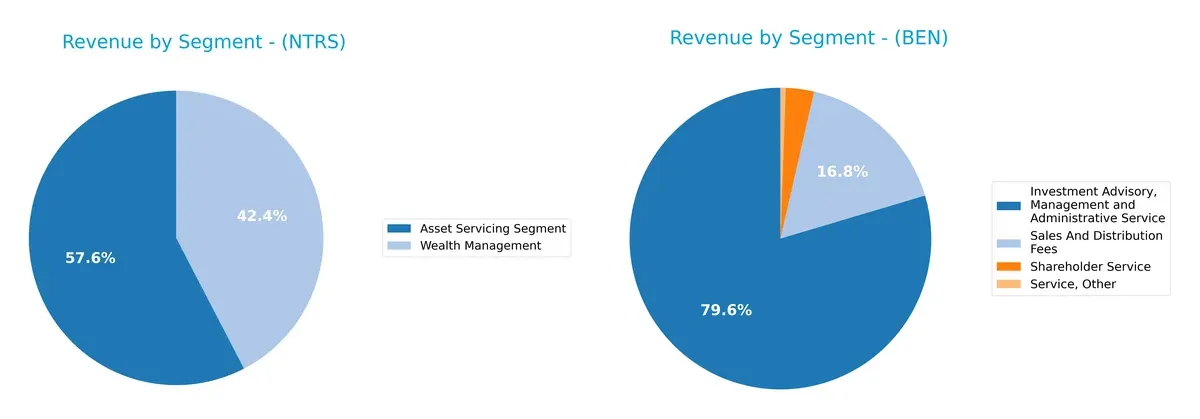
Northern Trust’s 2024 revenue pivots mainly on Asset Servicing at $4.37B and Wealth Management at $3.21B, showing moderate diversification. Franklin Resources dwarfs with a dominant $6.98B from Investment Advisory plus $1.47B in Sales and Distribution Fees, reflecting a broader base. Northern Trust’s mix leans on infrastructure dominance, while Franklin’s spread reduces concentration risk by balancing advisory and fee-based income.
Strengths and Weaknesses Comparison
This table compares the Strengths and Weaknesses of Northern Trust Corporation and Franklin Resources, Inc.:
Northern Trust Corporation Strengths
- Favorable net margin at 12.15%
- Strong fixed asset turnover at 30.78
- Favorable dividend yield at 2.27%
- Diversified revenue from Wealth Management and Asset Servicing
- Significant domestic and foreign revenue with $6B domestic
Franklin Resources, Inc. Strengths
- Favorable WACC at 6.7%
- Strong current and quick ratios at 2.71 each
- Favorable interest coverage at 9.29
- Diversified revenue streams with $6.9B in Investment Advisory
- Strong global presence with largest revenue in US and Luxembourg
Northern Trust Corporation Weaknesses
- Unfavorable current and quick ratios at 0.41 indicating liquidity risk
- High WACC at 16.78% exceeds ROIC of 5.04%
- Low asset turnover at 0.08
- Unfavorable debt-to-equity at 1.27
- Interest coverage very low at 0.38
Franklin Resources, Inc. Weaknesses
- Low ROE at 4.35% and ROIC at 1.38%
- Unfavorable debt-to-equity at 1.1
- Unfavorable asset turnover at 0.27
- Neutral net margin at 5.98% indicates moderate profitability
Northern Trust shows strong profitability and asset efficiency but faces liquidity and capital cost challenges. Franklin Resources exhibits solid liquidity and cost of capital management but struggles with profitability and asset utilization. These strengths and weaknesses highlight differing strategic priorities and operational focuses.
The Moat Duel: Analyzing Competitive Defensibility
A structural moat stands as the lone guard protecting long-term profits from relentless competitive erosion:
Northern Trust Corporation: Intangible Assets and Relationship Moat
Northern Trust leverages deep client trust and bespoke wealth management, reflected in stable margins despite recent revenue dips. In 2026, expanding institutional services could fortify its moat.
Franklin Resources, Inc.: Cost Advantage with Geographic Diversification
Franklin Resources contrasts with Northern Trust by emphasizing cost-efficient asset management and global market reach. Its favorable gross margins and U.S.-centric growth offer a platform to disrupt emerging markets.
Relationship Trust vs. Cost Efficiency: Who Holds the Moat Edge?
Both firms suffer declining ROIC trends, signaling value erosion. Yet, Northern Trust’s entrenched client relationships create a wider moat than Franklin’s cost-focused, geographically dispersed model. Northern Trust is better positioned to defend market share in a highly competitive asset management landscape.
Which stock offers better returns?
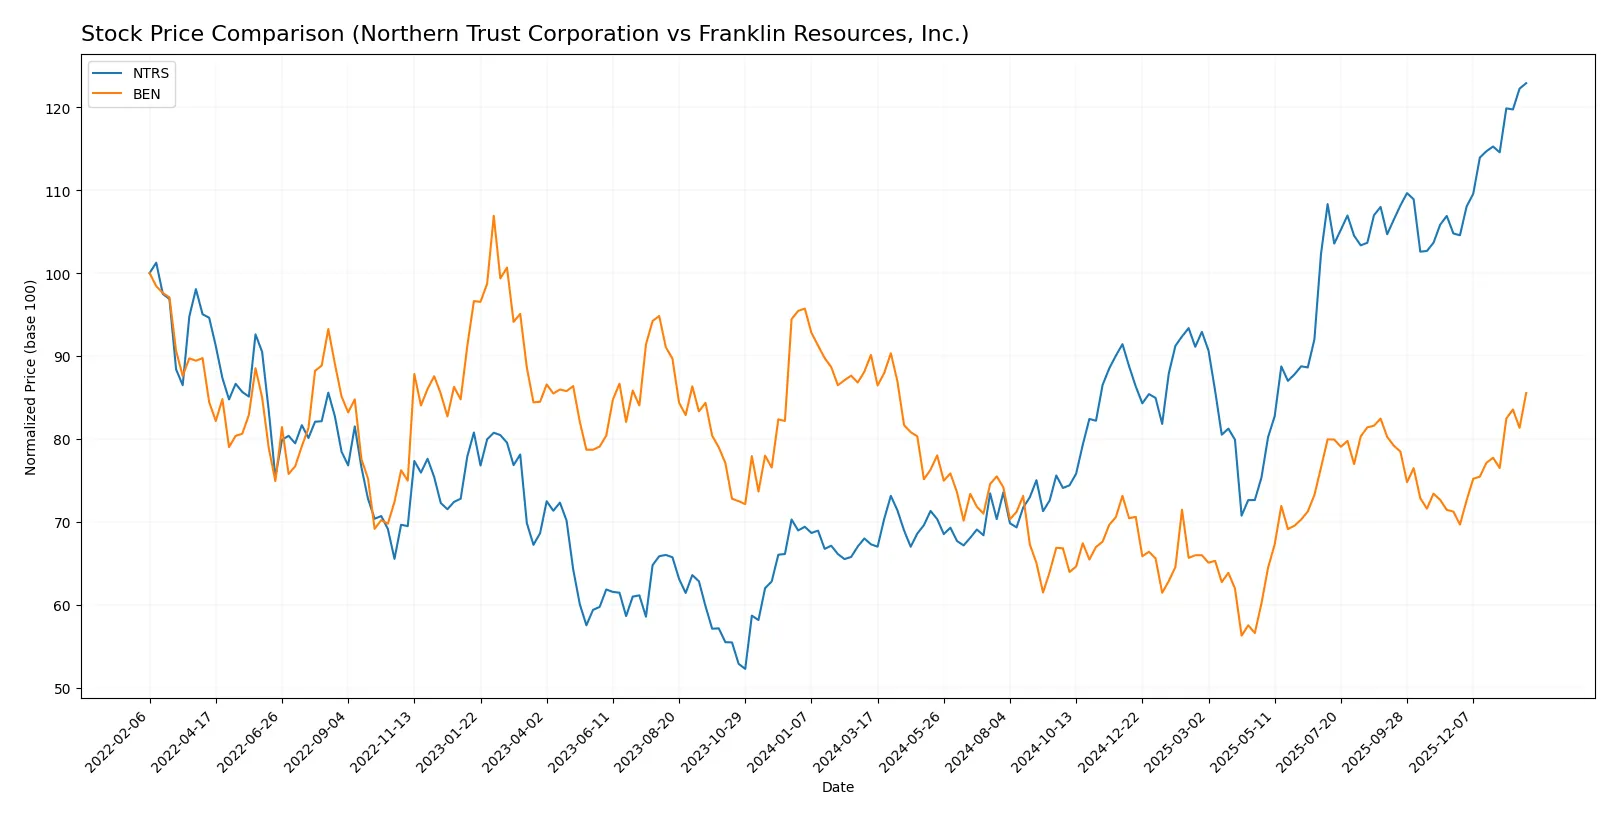
The past year shows Northern Trust Corporation surging 82.65%, accelerating upward from 81.45 to 149.43. Franklin Resources, Inc. declined 5.1%, despite recent minor gains.
Trend Comparison
Northern Trust Corporation’s stock rose 82.65% over 12 months, marking a bullish trend with accelerating gains and a high volatility level of 19.71%. The price peaked at 149.43 and bottomed at 81.45.
Franklin Resources, Inc. experienced a 5.1% price decline over the same period, signaling a bearish trend despite acceleration and limited volatility of 2.3%. Its highest point reached 28.11, lowest was 17.51.
Northern Trust Corporation outperformed Franklin Resources, delivering the highest market return by a wide margin with sustained bullish momentum and stronger price appreciation.
Target Prices
Analysts present a measured target consensus for Northern Trust Corporation and Franklin Resources, Inc., reflecting moderate upside potential.
| Company | Target Low | Target High | Consensus |
|---|---|---|---|
| Northern Trust Corporation | 131 | 160 | 146.17 |
| Franklin Resources, Inc. | 25 | 25 | 25 |
Northern Trust’s target consensus sits slightly below its current price of $149.43, suggesting limited near-term appreciation. Franklin Resources’ consensus target of $25 is modestly below its current $26.62, indicating a cautious outlook from analysts.

Don’t Let Luck Decide Your Entry Point
Optimize your entry points with our advanced ProRealTime indicators. You’ll get efficient buy signals with precise price targets for maximum performance. Start outperforming now!
How do institutions grade them?
The following tables summarize the recent institutional grades for Northern Trust Corporation and Franklin Resources, Inc.:
Northern Trust Corporation Grades
The table below shows recent grades assigned by reputable financial institutions for Northern Trust:
| Grading Company | Action | New Grade | Date |
|---|---|---|---|
| Goldman Sachs | Maintain | Sell | 2026-01-28 |
| Citigroup | Maintain | Neutral | 2026-01-28 |
| TD Cowen | Maintain | Buy | 2026-01-26 |
| Wells Fargo | Maintain | Equal Weight | 2026-01-23 |
| RBC Capital | Maintain | Outperform | 2026-01-23 |
| Evercore ISI Group | Maintain | In Line | 2026-01-23 |
| Morgan Stanley | Maintain | Underweight | 2026-01-23 |
| TD Cowen | Maintain | Buy | 2026-01-07 |
| Barclays | Maintain | Equal Weight | 2026-01-05 |
| Citigroup | Maintain | Neutral | 2025-12-30 |
Franklin Resources, Inc. Grades
The table below displays recent grades from respected financial firms for Franklin Resources:
| Grading Company | Action | New Grade | Date |
|---|---|---|---|
| Barclays | Maintain | Underweight | 2026-01-15 |
| TD Cowen | Maintain | Buy | 2026-01-14 |
| Barclays | Maintain | Underweight | 2025-12-12 |
| JP Morgan | Maintain | Neutral | 2025-11-10 |
| Barclays | Maintain | Underweight | 2025-10-21 |
| Evercore ISI Group | Maintain | Underperform | 2025-10-09 |
| B of A Securities | Maintain | Underperform | 2025-10-02 |
| Morgan Stanley | Maintain | Underweight | 2025-08-12 |
| JP Morgan | Maintain | Neutral | 2025-08-04 |
| Barclays | Maintain | Underweight | 2025-08-04 |
Which company has the best grades?
Northern Trust has predominantly neutral to outperform grades, including multiple “Buy” and “Outperform” ratings. Franklin Resources largely receives “Underweight” and “Underperform” grades. This suggests Northern Trust is viewed more favorably, potentially attracting more investor interest and confidence.
Risks specific to each company
The following categories identify critical pressure points and systemic threats facing Northern Trust Corporation and Franklin Resources, Inc. in the 2026 market environment:
1. Market & Competition
Northern Trust Corporation
- Operates in wealth management and asset servicing with strong institutional client base but faces intense industry rivalry.
Franklin Resources, Inc.
- Primarily an asset management firm with diversified mutual funds, contends with fierce competition and shifting investor preferences.
2. Capital Structure & Debt
Northern Trust Corporation
- High debt-to-equity ratio (1.27) and weak interest coverage (0.38) signal financial strain and elevated risk.
Franklin Resources, Inc.
- Slightly lower debt-to-equity (1.1) and strong interest coverage (9.29) indicate better debt management and financial stability.
3. Stock Volatility
Northern Trust Corporation
- Beta of 1.285 suggests moderate volatility, in line with financial sector norms.
Franklin Resources, Inc.
- Higher beta of 1.465 implies greater stock price fluctuations and elevated market risk.
4. Regulatory & Legal
Northern Trust Corporation
- Operates globally with regulatory compliance complexity in banking and asset servicing sectors.
Franklin Resources, Inc.
- Asset management focus exposes it to evolving financial regulations and fiduciary standards.
5. Supply Chain & Operations
Northern Trust Corporation
- Relies heavily on technology platforms for asset servicing; operational disruptions could impact client trust.
Franklin Resources, Inc.
- Operational risks center on fund management efficiency and technology infrastructure robustness.
6. ESG & Climate Transition
Northern Trust Corporation
- Increasing pressure to integrate ESG in wealth management, with client demand growing for sustainable investments.
Franklin Resources, Inc.
- ESG integration is critical amid rising investor demand and regulatory scrutiny in asset management.
7. Geopolitical Exposure
Northern Trust Corporation
- Global presence exposes it to geopolitical risks, especially in currency and market volatility.
Franklin Resources, Inc.
- International operations face geopolitical uncertainties, particularly in emerging markets.
Which company shows a better risk-adjusted profile?
Northern Trust’s most impactful risk is its strained capital structure, marked by weak liquidity and interest coverage. Franklin Resources faces significant market volatility and valuation concerns but manages debt more prudently. Despite higher stock volatility, Franklin Resources’ stronger balance sheet and favorable liquidity metrics give it a better risk-adjusted profile in 2026. Notably, Northern Trust’s Altman Z-score in the distress zone (-0.3) raises alarms about solvency risks.
Final Verdict: Which stock to choose?
Northern Trust Corporation’s superpower lies in its operational efficiency and robust cash generation, which have supported a strong market comeback with an 82% price surge over recent years. Its key point of vigilance is its stretched liquidity position reflected in a low current ratio, posing short-term risk. It suits portfolios focused on aggressive growth with a tolerance for cyclical volatility.
Franklin Resources, Inc. commands a strategic moat through its stable recurring revenue and superior balance sheet strength, evidenced by a healthy current ratio and interest coverage. Relative to Northern Trust, it offers better financial safety but trades at a premium with muted earnings growth. It fits investors seeking growth at a reasonable price with moderate risk appetite.
If you prioritize aggressive capital appreciation, Northern Trust outshines with its operational leverage and market momentum despite liquidity concerns. However, if you seek a more stable income and balance sheet profile, Franklin Resources offers better stability with a strategic moat and less volatility. Each choice reflects distinct investor risk and return preferences.
Disclaimer: Investment carries a risk of loss of initial capital. The past performance is not a reliable indicator of future results. Be sure to understand risks before making an investment decision.
Go Further
I encourage you to read the complete analyses of Northern Trust Corporation and Franklin Resources, Inc. to enhance your investment decisions: