Home > Comparison > Financial Services > KKR vs BEN
The strategic rivalry between KKR & Co. Inc. and Franklin Resources, Inc. shapes the asset management sector’s evolution. KKR operates as a global private equity and real estate powerhouse, employing a diversified, capital-intensive approach. Franklin Resources focuses on public mutual funds and institutional asset management with a more traditional, high-volume model. This analysis aims to identify which firm’s distinct operational path delivers superior risk-adjusted returns for a balanced investment portfolio.
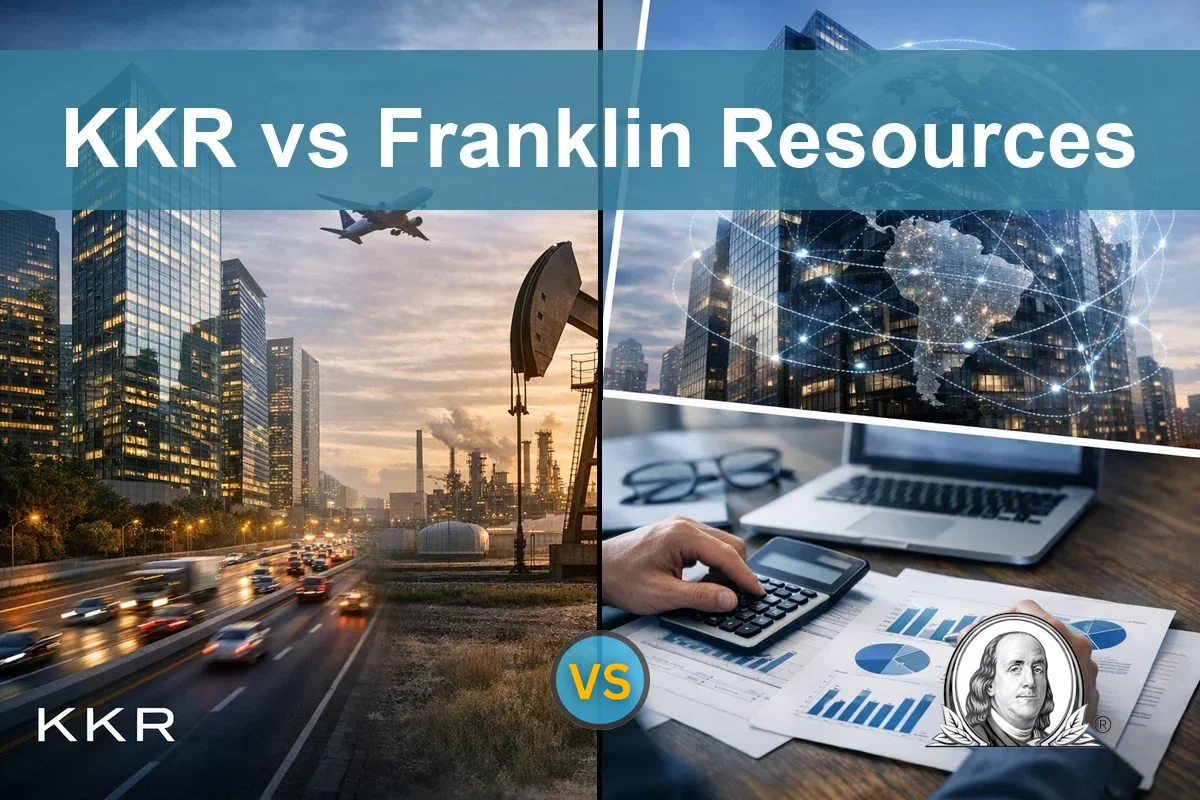
Table of contents
Companies Overview
KKR & Co. Inc. and Franklin Resources, Inc. are pivotal players in the global asset management landscape.
KKR & Co. Inc.: Global Private Equity Powerhouse
KKR dominates the private equity and real estate investment sector through direct acquisitions and fund investments. It generates revenue from leveraged buyouts, growth equity, credit special situations, and diverse industry exposure globally. The firm’s 2026 strategy focuses on impact investments and expanding its footprint across emerging and developed markets.
Franklin Resources, Inc.: Diversified Asset Manager
Franklin Resources operates primarily as a publicly owned asset management holding company. It earns revenues by launching and managing mutual funds across equity, fixed income, and multi-asset classes targeting individuals and institutions. In 2026, Franklin emphasizes expanding its alternative market investments while servicing pension plans and trusts.
Strategic Collision: Similarities & Divergences
KKR and Franklin both focus on asset management but differ sharply in approach. KKR pursues a control-driven, private equity model with active ownership; Franklin leans on an open-architecture mutual fund platform. Their primary battleground is asset allocation and client diversification. KKR’s investment profile is higher risk with concentrated control, while Franklin’s is stable and broadly diversified.
Income Statement Comparison
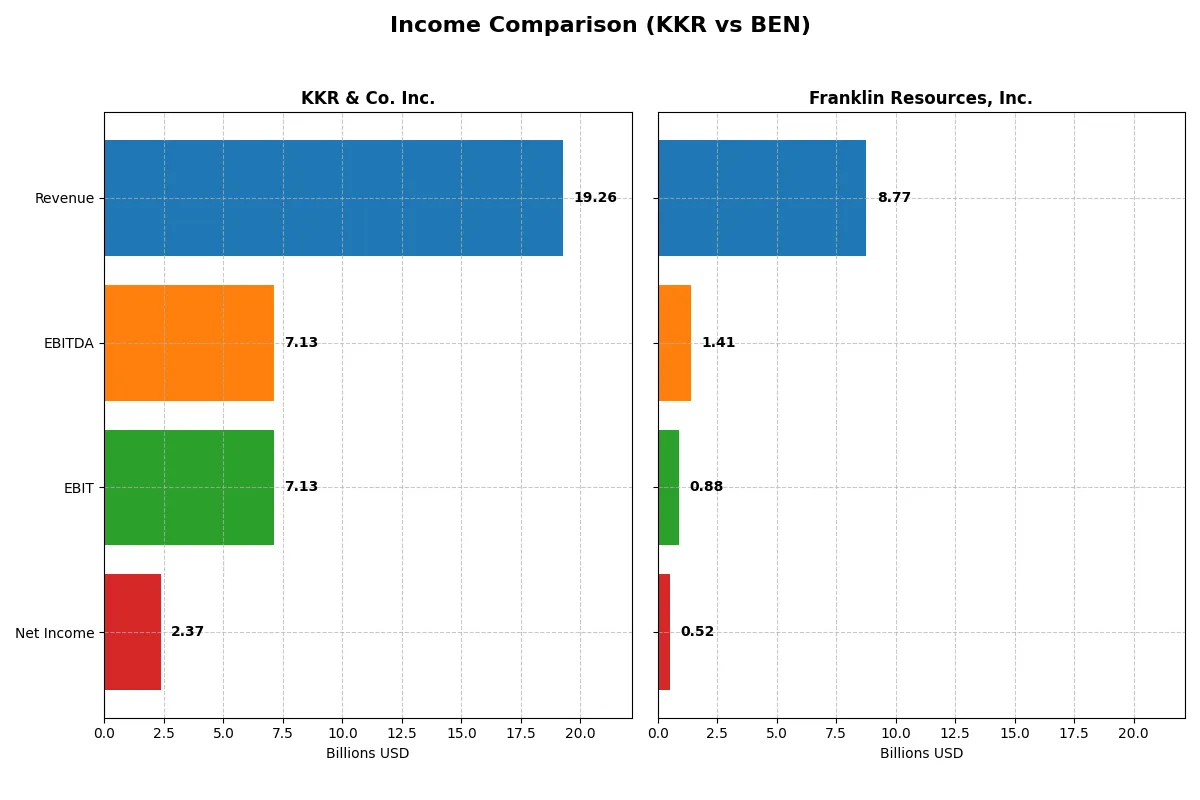
The following data dissects the core profitability and scalability of both corporate engines to reveal who dominates the bottom line:
| Metric | KKR & Co. Inc. (KKR) | Franklin Resources, Inc. (BEN) |
|---|---|---|
| Revenue | 19.3B | 8.8B |
| Cost of Revenue | 11.2B | 1.7B |
| Operating Expenses | 7.6B | 6.4B |
| Gross Profit | 8.1B | 7.0B |
| EBITDA | 7.1B | 1.4B |
| EBIT | 7.1B | 882M |
| Interest Expense | 2.3B | 95M |
| Net Income | 2.4B | 525M |
| EPS | 2.52 | 0.91 |
| Fiscal Year | 2025 | 2025 |
Income Statement Analysis: The Bottom-Line Duel
This income statement comparison uncovers which company runs a more efficient and profitable operation amid recent market challenges.
KKR & Co. Inc. Analysis
KKR’s revenue rose 20% from 2021 to 2025 but dropped nearly 11% in the past year. Its gross margin recovered strongly to 41.8% in 2025, yet net margin contracted to 12.3%. The firm’s net income fell sharply over five years, signaling margin pressure and declining bottom-line efficiency despite a solid gross profit rebound.
Franklin Resources, Inc. Analysis
Franklin Resources displays stable revenue with mild 3.5% growth last year and an 80.3% gross margin, highlighting strong cost control. Net margin is modest at 6%, but improved in 2025 alongside a 7% EPS rise. While net income declined significantly over the longer term, recent metrics suggest steady operational discipline and margin resilience.
Margin Strength vs. Revenue Volatility
KKR’s scale and gross profit growth contrast with falling net income and squeezed margins. Franklin Resources shows steadier revenue and better margin stability, despite lower absolute profits. For investors, KKR offers growth potential tempered by volatility, while Franklin delivers consistent profitability with less dramatic swings.
Financial Ratios Comparison
These vital ratios act as a diagnostic tool to expose underlying fiscal health, valuation premiums, and capital efficiency for each company:
| Ratios | KKR & Co. Inc. (KKR) | Franklin Resources, Inc. (BEN) |
|---|---|---|
| ROE | 13.0% | 4.3% |
| ROIC | 0.25% | 1.38% |
| P/E | 42.6 | 22.7 |
| P/B | 5.55 | 0.99 |
| Current Ratio | 4.12 | 2.71 |
| Quick Ratio | 4.12 | 2.71 |
| D/E (Debt/Equity) | 2.15 | 1.10 |
| Debt-to-Assets | 14.1% | 41.1% |
| Interest Coverage | 0.28 | 6.37 |
| Asset Turnover | 0.06 | 0.27 |
| Fixed Asset Turnover | 12.23 | 5.12 |
| Payout Ratio | 19.9% | 130.3% |
| Dividend Yield | 0.47% | 5.75% |
| Fiscal Year | 2024 | 2025 |
Efficiency & Valuation Duel: The Vital Signs
Financial ratios serve as a company’s DNA, unveiling hidden risks and operational excellence that raw numbers alone cannot expose.
KKR & Co. Inc.
KKR demonstrates solid profitability with a 13.0% ROE and a favorable 14.2% net margin. Its valuation appears stretched, trading at a high P/E of 42.65 and a PB of 5.55. Shareholder returns are modest, with a low 0.47% dividend yield, indicating limited cash distribution and possible reinvestment in growth or restructuring.
Franklin Resources, Inc.
Franklin Resources shows weaker profitability, with a low 4.35% ROE and a moderate 6.0% net margin. Its valuation is more reasonable, featuring a neutral P/E of 22.67 and a favorable PB near 1.0. The company offers a 5.75% dividend yield, reflecting a strong focus on shareholder income rather than aggressive reinvestment.
Premium Valuation vs. Operational Safety
KKR carries a premium valuation but offers stronger profitability metrics, albeit with risks from high leverage and stretched multiples. Franklin Resources trades cheaper with a solid dividend and better liquidity ratios, suggesting a more conservative risk profile. Investors prioritizing growth may lean toward KKR, while income-focused investors may prefer Franklin Resources.
Which one offers the Superior Shareholder Reward?
I compare KKR & Co. Inc. and Franklin Resources, Inc. on dividends and buybacks. KKR yields 0.47% with a 20% payout ratio and modest buybacks, reflecting cautious capital return amid debt leverage. Franklin Resources yields a strong 6.4%, with a payout ratio above 130%, signaling aggressive dividend distributions supported by stable free cash flow. KKR reinvests for growth, balancing buybacks and dividends sustainably. Franklin’s high payout risks dividend cuts if earnings falter but offers immediate income appeal. For 2026, I favor Franklin for total shareholder return due to its superior yield and consistent buybacks, despite higher payout risk.
Comparative Score Analysis: The Strategic Profile
The radar chart reveals the fundamental DNA and trade-offs of both firms, highlighting their financial strengths and vulnerabilities:
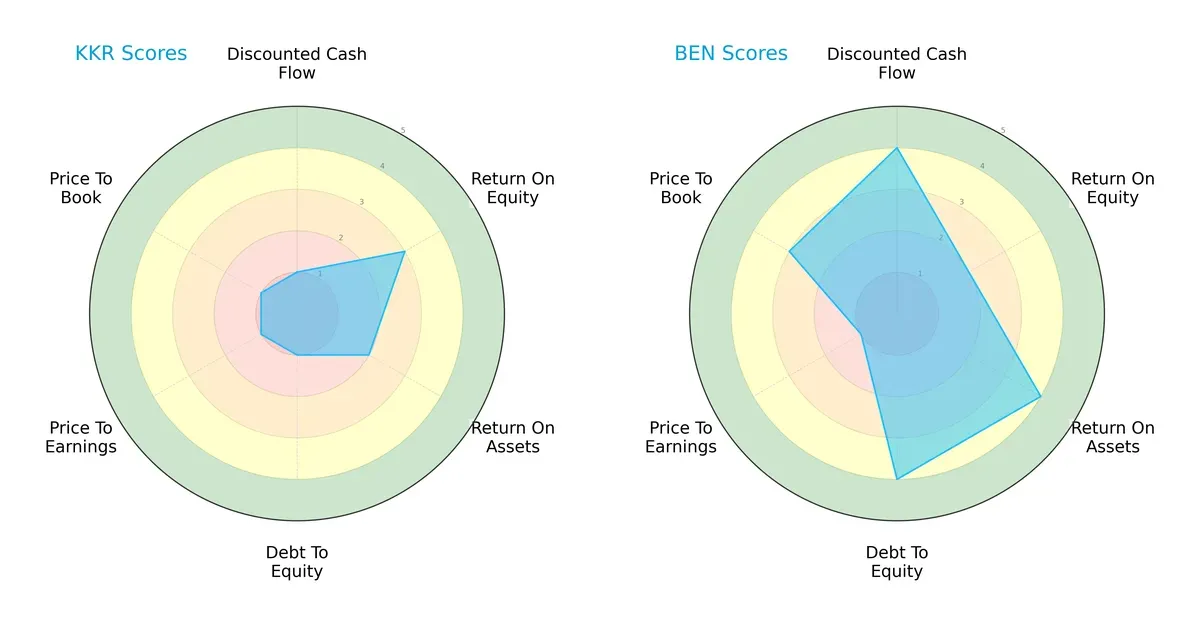
KKR & Co. Inc. shows a heavily unbalanced profile with very low scores in DCF, Debt/Equity, P/E, and P/B ratios, signaling high financial risk and potential overvaluation concerns. Franklin Resources, Inc. exhibits a more balanced setup, excelling in discounted cash flow and asset utilization, but it carries a moderate weakness in return on equity and valuation metrics. Overall, Franklin Resources presents a more stable and diversified financial profile, while KKR relies heavily on moderate ROE without strong support from other key metrics.
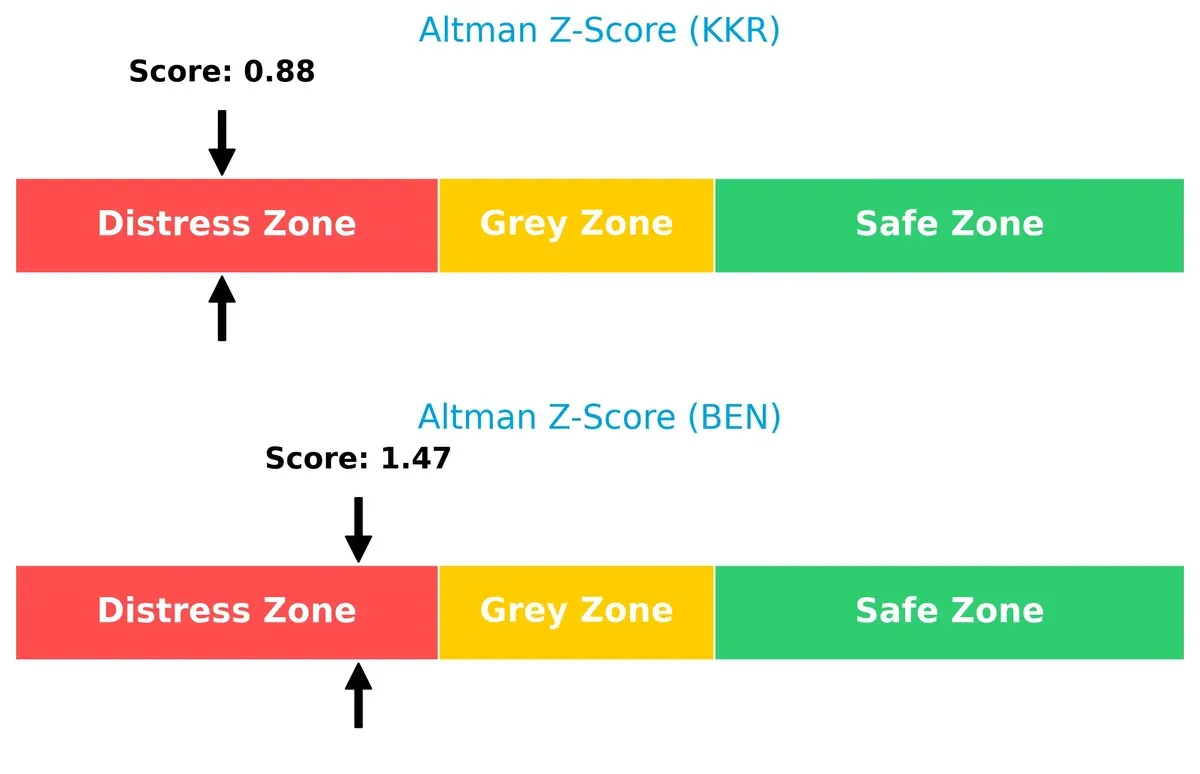
Bankruptcy Risk: Solvency Showdown
The Altman Z-Scores place both firms in the distress zone, but Franklin Resources’ higher score suggests a comparatively stronger solvency position within a challenging market cycle:
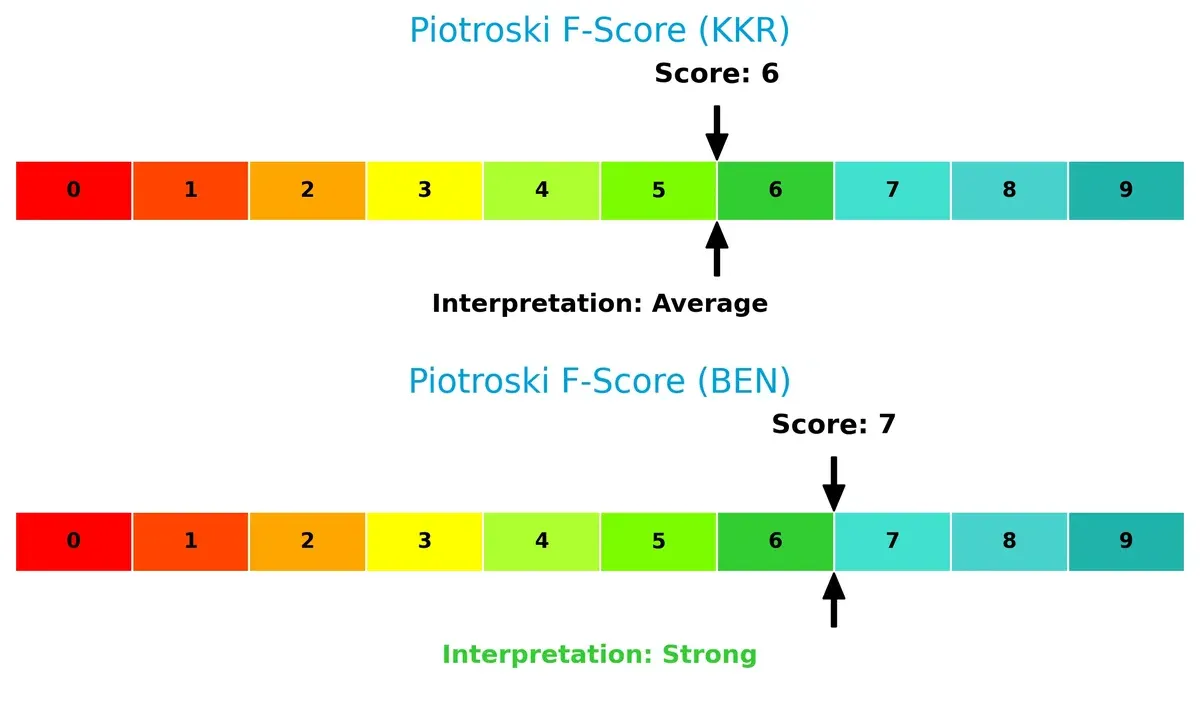
Financial Health: Quality of Operations
Franklin Resources leads with a Piotroski F-Score of 7, indicating strong operational health, while KKR’s score of 6 signals average financial quality and some caution in its internal metrics:
How are the two companies positioned?
This section dissects the operational DNA of KKR and BEN by comparing their revenue distribution and internal dynamics. The goal is to confront their economic moats and identify which model offers the most resilient competitive advantage today.
Revenue Segmentation: The Strategic Mix
This visual comparison dissects how KKR & Co. Inc. and Franklin Resources, Inc. diversify their income streams and where their primary sector bets lie:
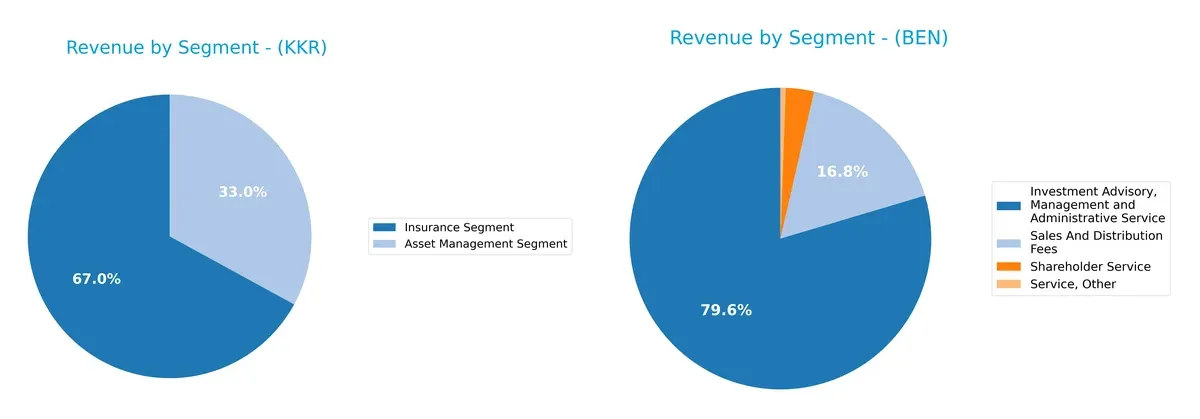
KKR anchors its revenue in two dominant segments: Insurance at $14.7B and Asset Management at $7.2B in 2024. This dual focus blends ecosystem lock-in with diversified income. Franklin Resources leans heavily on Investment Advisory and Management services, generating $6.8B, with Sales and Distribution fees at $1.4B adding moderate diversification. KKR’s broader segment spread reduces concentration risk compared to Franklin’s reliance on advisory fees.
Strengths and Weaknesses Comparison
This table compares the Strengths and Weaknesses of KKR and BEN based on key financial and operational metrics:
KKR Strengths
- Strong insurance segment generating 14.7B in revenue
- Favorable net margin at 14.22%
- High quick ratio of 4.12 indicating liquidity
- Favorable fixed asset turnover at 12.23
BEN Strengths
- Diversified revenue from advisory, sales, and shareholder services
- Favorable WACC at 6.77%
- Strong interest coverage ratio at 9.29
- Favorable PB ratio near 1.0
- Global revenue presence with significant US and Luxembourg markets
KKR Weaknesses
- Unfavorable ROIC at 0.25%
- High PE and PB ratios indicating valuation concerns
- Unfavorable debt to equity at 2.15
- Asset turnover very low at 0.06
- Dividend yield below 0.5%
- Current ratio unexpectedly high, may indicate inefficient asset use
BEN Weaknesses
- Low ROE at 4.35%
- Unfavorable debt to equity at 1.1
- Asset turnover unfavorable at 0.27
- Moderate dividend yield at 5.75% considered neutral
- Debt to assets moderately high at 41.1%
KKR shows strength in its insurance segment and liquidity but struggles with capital efficiency and valuation. BEN benefits from diversified revenue and favorable cost of capital but faces challenges in profitability and asset utilization. These contrasts reflect differing strategic focuses and financial structures.
The Moat Duel: Analyzing Competitive Defensibility
A structural moat is the only reliable shield protecting long-term profits from relentless competition erosion. Let’s dissect the moats of two asset managers:
KKR & Co. Inc.: Diversification and Scale Advantage
KKR’s moat stems from its diversified investment strategies across private equity, real estate, and credit. This breadth supports stable margins near 37% EBIT, despite recent revenue volatility. Expansion into emerging markets offers growth but declining ROIC signals caution.
Franklin Resources, Inc.: Brand and Cost Efficiency
Franklin relies on brand loyalty and cost-efficient mutual fund management, boasting an 80% gross margin and modest revenue growth. However, its declining ROIC and shrinking net income hint at weakening competitive defenses compared to KKR’s broader asset exposure.
Verdict: Diversification Depth vs. Brand Cost Efficiency
KKR holds a wider moat through diversified investment platforms and scale, despite a dip in ROIC. Franklin’s cost advantage and brand strength are narrowing as profitability erodes. KKR is better positioned to defend and grow market share in 2026.
Which stock offers better returns?
The past year reveals contrasting price dynamics: KKR shows a bullish trend with decelerating gains, while Franklin Resources exhibits a mild bullish trend accelerating recently, reflecting divergent momentum and trading behaviors.
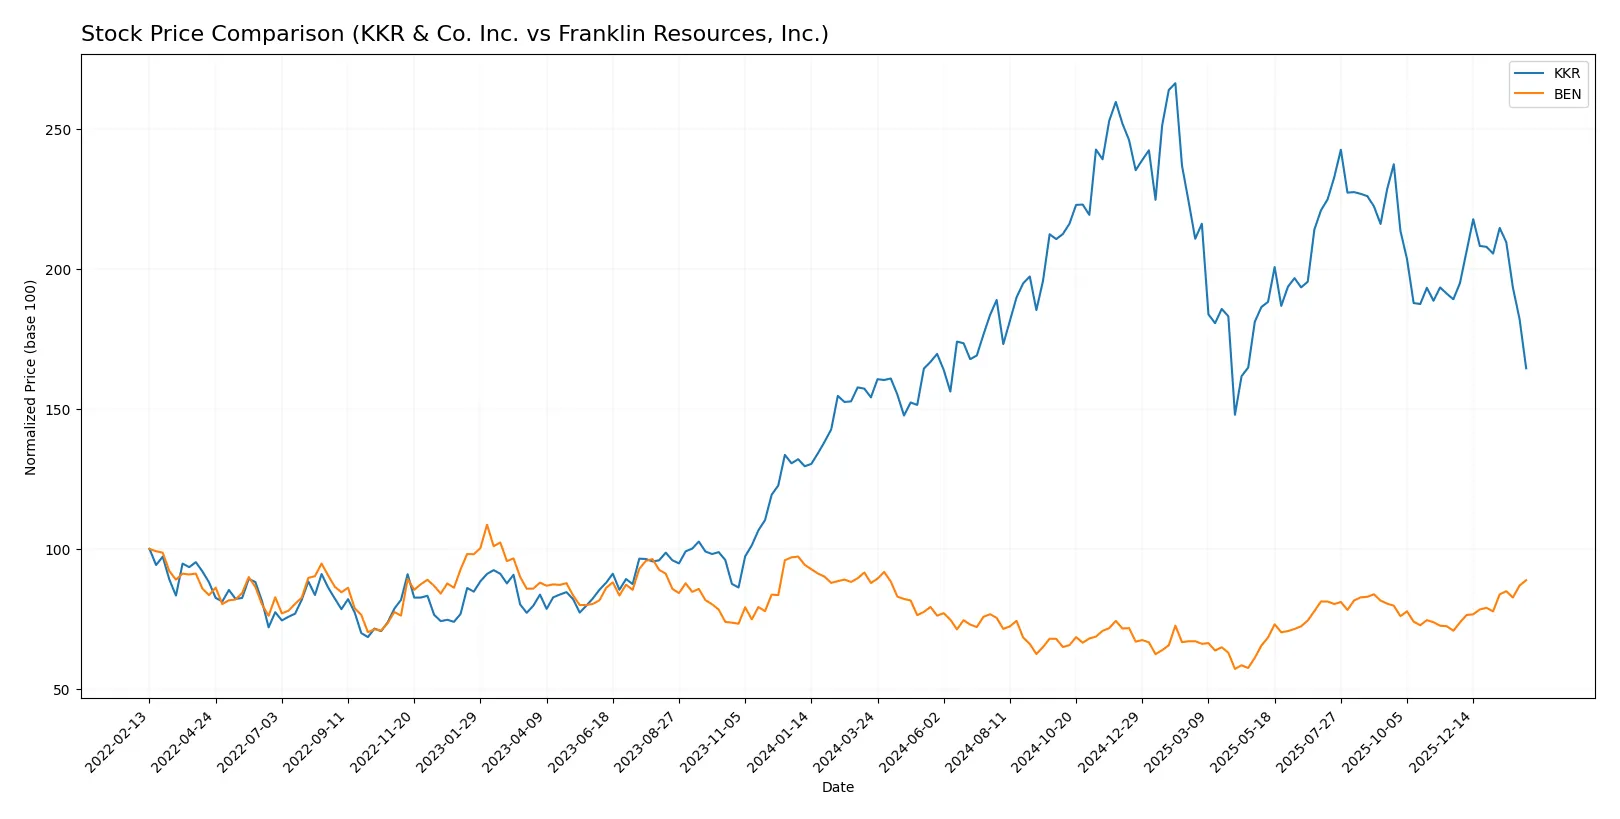
Trend Comparison
KKR’s stock rose 6.72% over the past 12 months, signaling a bullish trend despite deceleration. It reached a high of 167.07 and low of 92.62, with high volatility (18.23% std deviation).
Franklin Resources gained 1.12% over the same period, a mild bullish trend marked by accelerating momentum. Its price ranged between 17.51 and 28.11, with low volatility (2.28% std deviation).
KKR delivered stronger overall returns than Franklin Resources, but recent weakness contrasts with Franklin’s accelerating positive trend and buyer dominance.
Target Prices
Analysts show a cautiously optimistic target consensus for KKR & Co. Inc. and Franklin Resources, Inc.
| Company | Target Low | Target High | Consensus |
|---|---|---|---|
| KKR & Co. Inc. | 125 | 187 | 156 |
| Franklin Resources, Inc. | 22 | 25 | 23.5 |
KKR’s consensus target of 156 suggests significant upside from its current 103.2 price, indicating strong growth expectations. Franklin Resources’ 23.5 target is below the current 27.2 price, signaling cautious or negative analyst sentiment.

Don’t Let Luck Decide Your Entry Point
Optimize your entry points with our advanced ProRealTime indicators. You’ll get efficient buy signals with precise price targets for maximum performance. Start outperforming now!
How do institutions grade them?
KKR & Co. Inc. Grades
This table summarizes recent institutional grades for KKR & Co. Inc.:
| Grading Company | Action | New Grade | Date |
|---|---|---|---|
| Oppenheimer | Maintain | Outperform | 2026-02-06 |
| Barclays | Maintain | Overweight | 2026-02-06 |
| TD Cowen | Downgrade | Hold | 2026-01-14 |
| UBS | Maintain | Buy | 2026-01-13 |
| Barclays | Maintain | Overweight | 2026-01-09 |
| Barclays | Maintain | Overweight | 2025-12-12 |
| Barclays | Maintain | Overweight | 2025-11-11 |
| Oppenheimer | Maintain | Outperform | 2025-11-10 |
| TD Cowen | Maintain | Buy | 2025-11-10 |
| Morgan Stanley | Maintain | Overweight | 2025-10-21 |
Franklin Resources, Inc. Grades
This table summarizes recent institutional grades for Franklin Resources, Inc.:
| Grading Company | Action | New Grade | Date |
|---|---|---|---|
| Morgan Stanley | Maintain | Underweight | 2026-02-03 |
| Evercore ISI Group | Maintain | Underperform | 2026-02-02 |
| Barclays | Maintain | Underweight | 2026-01-15 |
| TD Cowen | Maintain | Buy | 2026-01-14 |
| Barclays | Maintain | Underweight | 2025-12-12 |
| JP Morgan | Maintain | Neutral | 2025-11-10 |
| Barclays | Maintain | Underweight | 2025-10-21 |
| Evercore ISI Group | Maintain | Underperform | 2025-10-09 |
| B of A Securities | Maintain | Underperform | 2025-10-02 |
| Morgan Stanley | Maintain | Underweight | 2025-08-12 |
Which company has the best grades?
KKR & Co. Inc. holds more favorable grades overall, with multiple “Outperform,” “Overweight,” and “Buy” ratings. Franklin Resources, Inc. faces mostly “Underweight” and “Underperform” grades. Investors may view KKR as having stronger institutional support.
Risks specific to each company
In 2026, the following categories pinpoint critical pressure points and systemic threats facing KKR & Co. Inc. and Franklin Resources, Inc.:
1. Market & Competition
KKR & Co. Inc.
- Faces intense competition in private equity and real assets globally, pressured by evolving tech and regulatory demands.
Franklin Resources, Inc.
- Competes in public asset management with challenges from passive funds and fee compression.
2. Capital Structure & Debt
KKR & Co. Inc.
- High debt-to-equity ratio (2.15) raises financial risk despite manageable debt-to-assets (14.1%).
Franklin Resources, Inc.
- Lower leverage (debt-to-equity 1.1) and strong interest coverage (9.29) indicate prudent capital structure.
3. Stock Volatility
KKR & Co. Inc.
- Beta near 2.0 signals high stock volatility, increasing market risk for investors.
Franklin Resources, Inc.
- Beta around 1.49 reflects moderate volatility, more stable in turbulent markets.
4. Regulatory & Legal
KKR & Co. Inc.
- Exposure to complex regulations across multiple asset classes and jurisdictions poses compliance risks.
Franklin Resources, Inc.
- Faces regulatory scrutiny primarily in mutual funds and fiduciary responsibilities but less complex than KKR.
5. Supply Chain & Operations
KKR & Co. Inc.
- Diverse global investments expose KKR to operational risks from geopolitical and supply chain disruptions.
Franklin Resources, Inc.
- Operational risks are lower, focused on fund management infrastructure and client retention.
6. ESG & Climate Transition
KKR & Co. Inc.
- Active in impact investing but faces pressure to align portfolio with accelerating climate regulations.
Franklin Resources, Inc.
- ESG integration ongoing; challenged to enhance sustainability metrics in traditional asset management.
7. Geopolitical Exposure
KKR & Co. Inc.
- Significant exposure to emerging and developed markets increases geopolitical risk amid uncertain global dynamics.
Franklin Resources, Inc.
- More concentrated US and India operations reduce but do not eliminate geopolitical risk.
Which company shows a better risk-adjusted profile?
KKR’s greatest risk is its high leverage amid volatile stock performance, risking financial strain. Franklin Resources faces operational pressure adapting to passive fund competition. Franklin’s stronger capital structure and lower volatility yield a better risk-adjusted profile. Notably, KKR’s Altman Z-score under 1 signals distress risk, while Franklin’s higher Piotroski score indicates stronger financial health.
Final Verdict: Which stock to choose?
KKR & Co. Inc. excels as a cash-generating powerhouse with robust operational efficiency. Its high current ratio signals ample liquidity but also hints at potential capital allocation inefficiencies. KKR fits well in an aggressive growth portfolio that tolerates volatility for outsized returns.
Franklin Resources, Inc. benefits from a strategic moat rooted in stable recurring revenue and disciplined capital management. It offers greater financial safety compared to KKR, supported by stronger liquidity and interest coverage. Franklin suits a GARP (Growth at a Reasonable Price) portfolio focused on steady income and moderate growth.
If you prioritize aggressive capital deployment and operational leverage, KKR is the compelling choice due to its cash flow strength and growth potential despite some balance sheet concerns. However, if you seek stability and consistent returns, Franklin Resources offers better financial resilience and a more predictable earnings profile. Both present distinct investment scenarios aligned with different risk appetites and portfolio objectives.
Disclaimer: Investment carries a risk of loss of initial capital. The past performance is not a reliable indicator of future results. Be sure to understand risks before making an investment decision.
Go Further
I encourage you to read the complete analyses of KKR & Co. Inc. and Franklin Resources, Inc. to enhance your investment decisions: