Warner Bros. Discovery, Inc. (WBD) and Fox Corporation (FOXA) stand as two influential giants in the entertainment industry, each with a strong foothold in media content and broadcasting. While WBD excels in a diverse portfolio spanning studios, networks, and streaming, FOXA specializes in news, sports, and multi-platform entertainment. This comparison highlights their market strategies and innovation approaches, helping you decide which company holds greater potential for your investment portfolio.
Table of contents
Companies Overview
I will begin the comparison between Warner Bros. Discovery, Inc. and Fox Corporation by providing an overview of these two companies and their main differences.
Warner Bros. Discovery Overview
Warner Bros. Discovery, Inc. is a global media and entertainment company operating through three segments: Studios, Network, and Direct-to-Consumer (DTC). It produces films, television programs, and streaming content, and distributes them via multiple platforms. The company manages a broad portfolio of brands and franchises including HBO, DC, Discovery Channel, and Warner Bros. Games, positioning itself as a diversified content creator and distributor.
Fox Corporation Overview
Fox Corporation operates as a U.S.-based news, sports, and entertainment company with three main segments: Cable Network Programming, Television, and Other Corporate services. It owns and operates FOX News, FOX Sports networks, The FOX Network broadcast, and Tubi, a video-on-demand service. Fox also manages production facilities in Los Angeles and focuses on digital and Web3 content through Blockchain Creative Labs.
Key similarities and differences
Both companies operate in the communication services sector with significant involvement in content production and distribution across multiple platforms. Warner Bros. Discovery has a more diversified global presence and broader content portfolio including premium streaming and gaming. Fox focuses primarily on U.S. cable networks, broadcast television, and sports programming, with an emphasis on news and digital innovation, reflecting differing strategic priorities and scale.
Income Statement Comparison
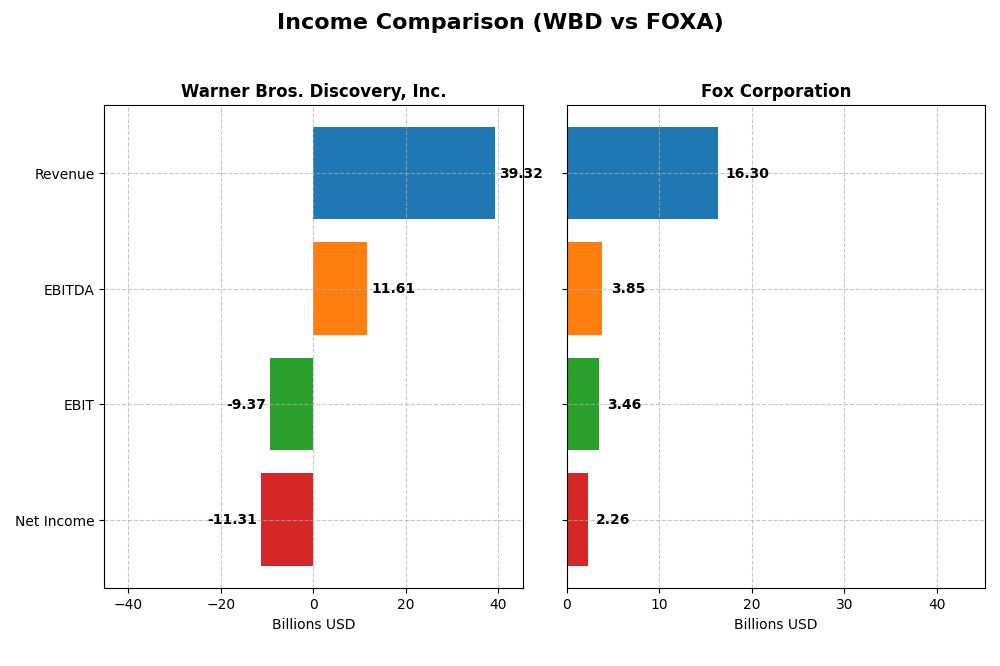
The table below presents a side-by-side comparison of key income statement metrics for Warner Bros. Discovery, Inc. and Fox Corporation for their most recent fiscal years.
| Metric | Warner Bros. Discovery, Inc. (2024) | Fox Corporation (2025) |
|---|---|---|
| Market Cap | 70.4B | 33.4B |
| Revenue | 39.3B | 16.3B |
| EBITDA | 11.6B | 3.85B |
| EBIT | -9.37B | 3.46B |
| Net Income | -11.3B | 2.26B |
| EPS | -4.62 | 4.97 |
| Fiscal Year | 2024 | 2025 |
Income Statement Interpretations
Warner Bros. Discovery, Inc.
Warner Bros. Discovery saw revenue grow sharply by 268.48% over 2020-2024 but posted a net income decline of over 1B%, reflecting deep losses. Margins deteriorated, with a gross margin at 41.58% remaining favorable but EBIT and net margins turning strongly negative. In 2024, revenue dropped 4.84%, net income worsened considerably, and margins declined, indicating operational and profitability challenges.
Fox Corporation
Fox Corporation experienced steady revenue growth of 26.27% over 2021-2025 and a 5.26% increase in net income. Margins remained robust, with gross, EBIT, and net margins all favorable, supported by efficient cost control and moderate interest expense. The most recent year showed a 16.6% revenue rise and strong net margin and EPS expansion, signaling improving profitability and operational strength.
Which one has the stronger fundamentals?
Fox Corporation exhibits stronger fundamentals with consistent revenue and net income growth, positive margin trends, and a favorable overall income statement evaluation. Conversely, Warner Bros. Discovery faces significant profitability pressure despite revenue gains, suffering from negative EBIT and net margins, and unfavorable margin and income growth, reflecting ongoing financial strain and weaker operational performance.
Financial Ratios Comparison
The following table presents a side-by-side comparison of key financial ratios for Warner Bros. Discovery, Inc. (WBD) and Fox Corporation (FOXA), based on their most recent fiscal year data.
| Ratios | Warner Bros. Discovery, Inc. (2024 FY) | Fox Corporation (2025 FY) |
|---|---|---|
| ROE | -33.2% | 18.9% |
| ROIC | -11.0% | 11.9% |
| P/E | -2.29 | 11.42 |
| P/B | 0.76 | 2.16 |
| Current Ratio | 0.89 | 2.91 |
| Quick Ratio | 0.89 | 2.76 |
| D/E (Debt to Equity) | 1.26 | 0.62 |
| Debt-to-Assets | 41.1% | 32.2% |
| Interest Coverage | -4.97 | 8.01 |
| Asset Turnover | 0.38 | 0.70 |
| Fixed Asset Turnover | 6.46 | 6.47 |
| Payout Ratio | 0% | 12.2% |
| Dividend Yield | 0% | 1.07% |
Interpretation of the Ratios
Warner Bros. Discovery, Inc.
Warner Bros. Discovery shows predominantly unfavorable ratios with a negative net margin of -28.77% and a return on equity (ROE) of -33.23%, indicating weak profitability and returns. The company’s current ratio of 0.89 signals liquidity concerns. Its dividend yield is zero, reflecting no dividend payments, likely due to ongoing financial challenges and reinvestment needs.
Fox Corporation
Fox Corporation displays strong financial health with favorable net margin at 13.88%, ROE at 18.92%, and return on invested capital (ROIC) at 11.89%. Liquidity ratios are robust, with a current ratio of 2.91. Fox pays dividends, with a moderate yield of 1.07%, supported by solid earnings and manageable debt levels, indicating sustainable shareholder returns.
Which one has the best ratios?
Fox Corporation has the best ratios overall, with a majority marked favorable, showing profitability, liquidity, and dividend stability. Warner Bros. Discovery faces multiple unfavorable financial ratios and lacks dividend payouts, highlighting relative weakness in financial health compared to Fox.
Strategic Positioning
This section compares the strategic positioning of Warner Bros. Discovery, Inc. (WBD) and Fox Corporation (FOXA) in terms of Market position, Key segments, and Exposure to technological disruption:
Warner Bros. Discovery, Inc.
- Large media and entertainment player with diverse content brands and global reach, facing intense competition.
- Operates Studios, Network, and DTC segments, driven by film, TV, streaming, and gaming revenues worldwide.
- Exposure through streaming services and digital distribution; faces disruption from evolving content consumption and tech trends.
Fox Corporation
- U.S.-focused news, sports, and entertainment company with strong cable and broadcast presence amid competitive U.S. market.
- Revenue mainly from Cable Network Programming and Television segments, including news channels and broadcast stations.
- Invests in digital platforms like Tubi and Web3 content; adapts to streaming and digital monetization challenges.
Warner Bros. Discovery, Inc. vs Fox Corporation Positioning
WBD pursues a diversified global strategy across film, TV, streaming, and gaming, offering broad content exposure. FOX concentrates on U.S. news, sports, and entertainment with cable and broadcast focus. WBD’s scale offers varied revenue streams, while FOX’s targeted approach centers on domestic channels and digital innovation.
Which has the best competitive advantage?
FOXA shows a very favorable moat with growing ROIC above WACC, indicating durable competitive advantage and efficient capital use. WBD’s very unfavorable moat reflects value destruction and declining profitability, signaling weaker competitive positioning.
Stock Comparison
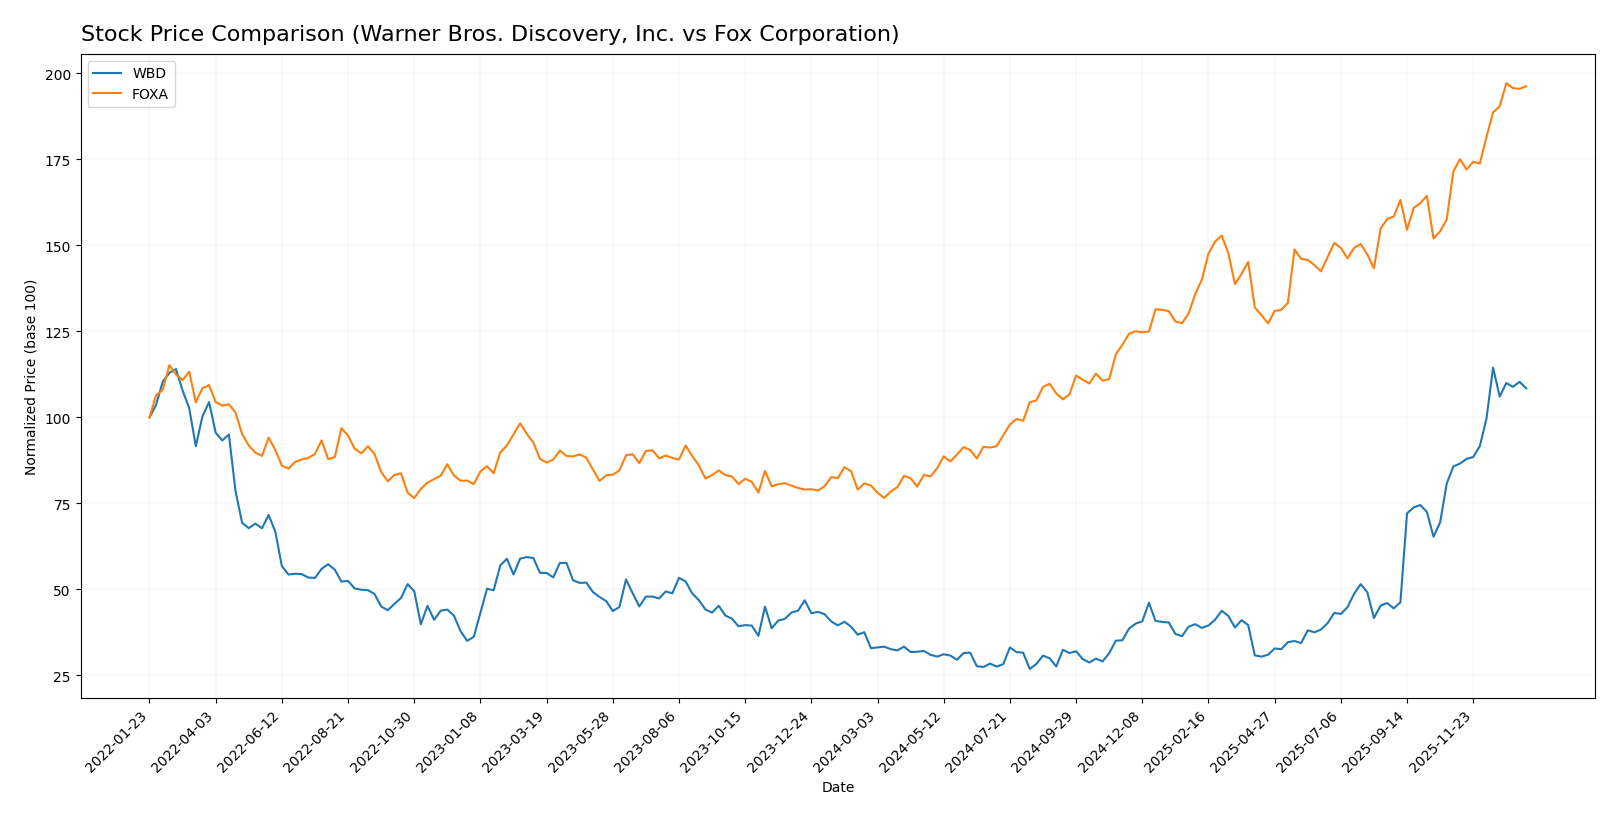
The stock price movements of Warner Bros. Discovery, Inc. (WBD) and Fox Corporation (FOXA) over the past 12 months reveal strong bullish trends with notable acceleration phases and significant gains in market value.
Trend Analysis
Warner Bros. Discovery, Inc. (WBD) experienced a 229.85% price increase over the past year, indicating a bullish trend with accelerating momentum, a price range from 7.03 to 29.98, and moderate volatility (std deviation 6.02).
Fox Corporation (FOXA) showed a 144.66% price increase over the same period, also bullish with acceleration, a price range between 28.86 and 74.3, but with higher volatility (std deviation 12.1).
Comparatively, WBD delivered the highest market performance with a larger percentage gain and steady upward acceleration, outperforming FOXA over the analyzed 12-month period.
Target Prices
The current target price consensus for Warner Bros. Discovery, Inc. and Fox Corporation shows a range of analyst expectations.
| Company | Target High | Target Low | Consensus |
|---|---|---|---|
| Warner Bros. Discovery, Inc. | 29.5 | 16 | 23.68 |
| Fox Corporation | 97 | 64 | 76.63 |
Analysts expect Warner Bros. Discovery’s price to moderate slightly below its current $28.4, while Fox Corporation’s consensus target suggests potential upside from its $73.96 trading price.
Analyst Opinions Comparison
This section compares analysts’ ratings and grades for Warner Bros. Discovery, Inc. (WBD) and Fox Corporation (FOXA):
Rating Comparison
WBD Rating
- Rating: B- indicating a very favorable status overall.
- Discounted Cash Flow Score: Moderate at 3, reflecting average valuation.
- ROE Score: Moderate at 2, showing less efficient profit generation.
- ROA Score: Moderate at 2, showing average asset utilization.
- Debt To Equity Score: Favorable at 4, indicating relatively low financial risk.
- Overall Score: Moderate at 3, summarizing a balanced financial standing.
FOXA Rating
- Rating: B+ with a very favorable overall status.
- Discounted Cash Flow Score: Favorable at 4, suggesting better valuation.
- ROE Score: Favorable at 4, indicating more efficient shareholder profit use.
- ROA Score: Very Favorable at 5, demonstrating excellent asset utilization.
- Debt To Equity Score: Moderate at 2, suggesting higher leverage risk.
- Overall Score: Moderate at 3, reflecting a comparable overall assessment.
Which one is the best rated?
Based strictly on the provided data, FOXA holds higher individual scores in discounted cash flow, ROE, and ROA, although it has a lower debt to equity score than WBD. Both share the same overall score, but FOXA is better rated in most key financial metrics.
Scores Comparison
Here is a comparison of Warner Bros. Discovery, Inc. and Fox Corporation scores:
WBD Scores
- Altman Z-Score: 0.88, indicating financial distress zone risk.
- Piotroski Score: 8, reflecting very strong financial health.
FOXA Scores
- Altman Z-Score: 3.42, indicating a safe financial zone.
- Piotroski Score: 8, reflecting very strong financial health.
Which company has the best scores?
Fox Corporation shows a stronger Altman Z-Score in the safe zone, while both companies have equally very strong Piotroski Scores of 8. This suggests Fox has better bankruptcy risk metrics based on the data provided.
Grades Comparison
Here is the summary of recent grades and ratings for Warner Bros. Discovery, Inc. and Fox Corporation:
Warner Bros. Discovery, Inc. Grades
This table shows recent analyst grades and actions for Warner Bros. Discovery, Inc.:
| Grading Company | Action | New Grade | Date |
|---|---|---|---|
| Seaport Global | Downgrade | Neutral | 2025-12-09 |
| Benchmark | Maintain | Buy | 2025-12-08 |
| Barrington Research | Downgrade | Market Perform | 2025-12-05 |
| Barrington Research | Maintain | Outperform | 2025-11-14 |
| Wells Fargo | Maintain | Equal Weight | 2025-11-07 |
| Rothschild & Co | Upgrade | Buy | 2025-10-30 |
| Argus Research | Upgrade | Buy | 2025-10-28 |
| Barrington Research | Maintain | Outperform | 2025-10-28 |
| Benchmark | Maintain | Buy | 2025-10-22 |
| Wells Fargo | Maintain | Equal Weight | 2025-10-16 |
Overall, Warner Bros. Discovery’s grades show mixed signals with several downgrades to Neutral and Market Perform, balanced by multiple Buy and Outperform ratings maintained or upgraded.
Fox Corporation Grades
This table shows recent analyst grades and actions for Fox Corporation:
| Grading Company | Action | New Grade | Date |
|---|---|---|---|
| Guggenheim | Maintain | Buy | 2025-12-22 |
| B of A Securities | Maintain | Buy | 2025-12-19 |
| Goldman Sachs | Maintain | Buy | 2025-12-19 |
| Morgan Stanley | Maintain | Equal Weight | 2025-12-18 |
| Citigroup | Maintain | Buy | 2025-11-12 |
| Wells Fargo | Maintain | Overweight | 2025-10-31 |
| TD Cowen | Maintain | Hold | 2025-10-31 |
| Barclays | Maintain | Equal Weight | 2025-10-31 |
| Evercore ISI Group | Maintain | In Line | 2025-10-31 |
| JP Morgan | Maintain | Neutral | 2025-10-31 |
Fox Corporation’s grades predominantly maintain Buy and Overweight ratings, indicating generally positive analyst sentiment without recent downgrades.
Which company has the best grades?
Fox Corporation holds a more favorable grade consensus with a majority of Buy and Overweight ratings, whereas Warner Bros. Discovery shows a more cautious outlook with several downgrades to Neutral and Market Perform. Investors may interpret Fox’s stronger grades as reflecting greater analyst confidence relative to Warner Bros. Discovery’s mixed signals.
Strengths and Weaknesses
Below is a comparative overview of key strengths and weaknesses for Warner Bros. Discovery, Inc. (WBD) and Fox Corporation (FOXA) based on the most recent data.
| Criterion | Warner Bros. Discovery, Inc. (WBD) | Fox Corporation (FOXA) |
|---|---|---|
| Diversification | Moderate: Revenue streams from advertising, distribution, content licensing, and services but limited growth diversity | Moderate: Revenue mainly from cable programming and television segments, focused but stable |
| Profitability | Weak: Negative net margin (-28.77%), negative ROE (-33.23%), negative ROIC (-11%) | Strong: Positive net margin (13.88%), solid ROE (18.92%), healthy ROIC (11.89%) |
| Innovation | Low: Declining ROIC trend indicating challenges in capital efficiency and innovation | High: Growing ROIC trend showing efficient capital use and innovation capability |
| Global presence | Broad: Significant presence with international networks and US networks | Focused: Primarily US cable and television market |
| Market Share | Large but pressured: Strong content distribution but declining profitability | Stable and growing: Competitive advantage with increasing profitability |
Key takeaway: Fox Corporation stands out with strong profitability, growing returns on invested capital, and a durable competitive advantage. Warner Bros. Discovery faces significant profitability challenges and declining capital efficiency, signaling caution for investors despite its diversified revenue sources.
Risk Analysis
Below is a comparative table highlighting key risks for Warner Bros. Discovery, Inc. (WBD) and Fox Corporation (FOXA) based on the most recent data from 2025-2026:
| Metric | Warner Bros. Discovery (WBD) | Fox Corporation (FOXA) |
|---|---|---|
| Market Risk | High (Beta 1.57, volatile) | Moderate (Beta 0.51, stable) |
| Debt Level | Elevated (D/E 1.26, interest coverage negative) | Moderate (D/E 0.62, strong interest coverage) |
| Regulatory Risk | Moderate (media & entertainment sector scrutiny) | Moderate (news and broadcasting regulations) |
| Operational Risk | High (negative profitability, integration challenges) | Low to Moderate (solid margins, diversified segments) |
| Environmental Risk | Low (media sector, limited exposure) | Low (similar sector exposure) |
| Geopolitical Risk | Moderate (global content distribution) | Moderate (US-focused, but sensitive to political climate) |
Warner Bros. Discovery faces significant operational and financial risks, with negative profitability and high leverage posing the greatest threats. Fox Corporation demonstrates stronger financial health and lower debt risk, making it more resilient in volatile market conditions. Investors should weigh WBD’s turnaround potential against its elevated distress signals.
Which Stock to Choose?
Warner Bros. Discovery, Inc. (WBD) shows a declining income with a -4.84% revenue drop in 2024 and unfavorable profitability ratios including a -33.23% ROE and -28.77% net margin. Its debt levels are elevated with a 1.26 debt-to-equity ratio, and the company is rated B- with mostly moderate to unfavorable financial ratios. The company is shedding value with a very unfavorable moat rating and a distress-zone Altman Z-Score.
Fox Corporation (FOXA) exhibits favorable income growth, including a 16.6% revenue increase in 2025, and strong profitability metrics such as an 18.92% ROE and 13.88% net margin. Leverage is moderate with a 0.62 debt-to-equity ratio, and the company holds a B+ rating supported by mostly favorable financial ratios. FOXA is creating value with a very favorable moat rating and a safe-zone Altman Z-Score.
Investors seeking growth and stronger profitability may find FOXA more attractive given its favorable rating and robust income statement, while those with a high risk tolerance might interpret WBD’s distressed financials and value destruction as potential for turnaround. The choice could depend on the investor’s risk profile and preference for stability versus speculative opportunity.
Disclaimer: Investment carries a risk of loss of initial capital. The past performance is not a reliable indicator of future results. Be sure to understand risks before making an investment decision.
Go Further
I encourage you to read the complete analyses of Warner Bros. Discovery, Inc. and Fox Corporation to enhance your investment decisions: