Home > Comparison > Communication Services > NFLX vs FOXA
The strategic rivalry between Netflix, Inc. and Fox Corporation defines the current trajectory of the communication services sector. Netflix operates as a global streaming powerhouse with a subscription-driven model, while Fox Corporation focuses on diversified content distribution through cable networks, broadcast TV, and emerging digital platforms. This analysis explores which corporate strategy offers a superior risk-adjusted return, balancing growth potential against operational resilience for a diversified portfolio.
Table of contents
Companies Overview
Netflix and Fox Corporation stand as key pillars in the evolving entertainment landscape, each commanding distinct audience segments and revenue models.
Netflix, Inc.: Global Streaming Pioneer
Netflix dominates the global streaming market with a vast subscriber base of approximately 222M paid members across 190 countries. Its core revenue engine centers on subscription fees for on-demand TV series, films, documentaries, and games delivered via internet-connected devices. In 2026, Netflix focuses strategically on expanding content diversity and technological innovation to deepen engagement in its competitive streaming ecosystem.
Fox Corporation: U.S. Sports and News Powerhouse
Fox Corporation commands a strong foothold in the U.S. through its integrated portfolio of cable networks, broadcast TV, and digital platforms. Its primary revenue driver includes licensing and advertising across news, sports, and entertainment segments, including FOX News, FS1, and Tubi’s ad-supported streaming. In 2026, Fox emphasizes growth in sports content and Web3 monetization to capture shifting viewer preferences and digital ad spend.
Strategic Collision: Similarities & Divergences
Both companies thrive in entertainment but adopt sharply different philosophies: Netflix bets on a subscription-based global streaming model, while Fox leverages a hybrid of traditional broadcasting and ad-supported platforms focused on U.S. audiences. Their primary battleground is content delivery and monetization in an increasingly fragmented media landscape. Netflix appeals to investors seeking global scale and innovation; Fox attracts those valuing diversified media assets and steady advertising cash flow.
Income Statement Comparison
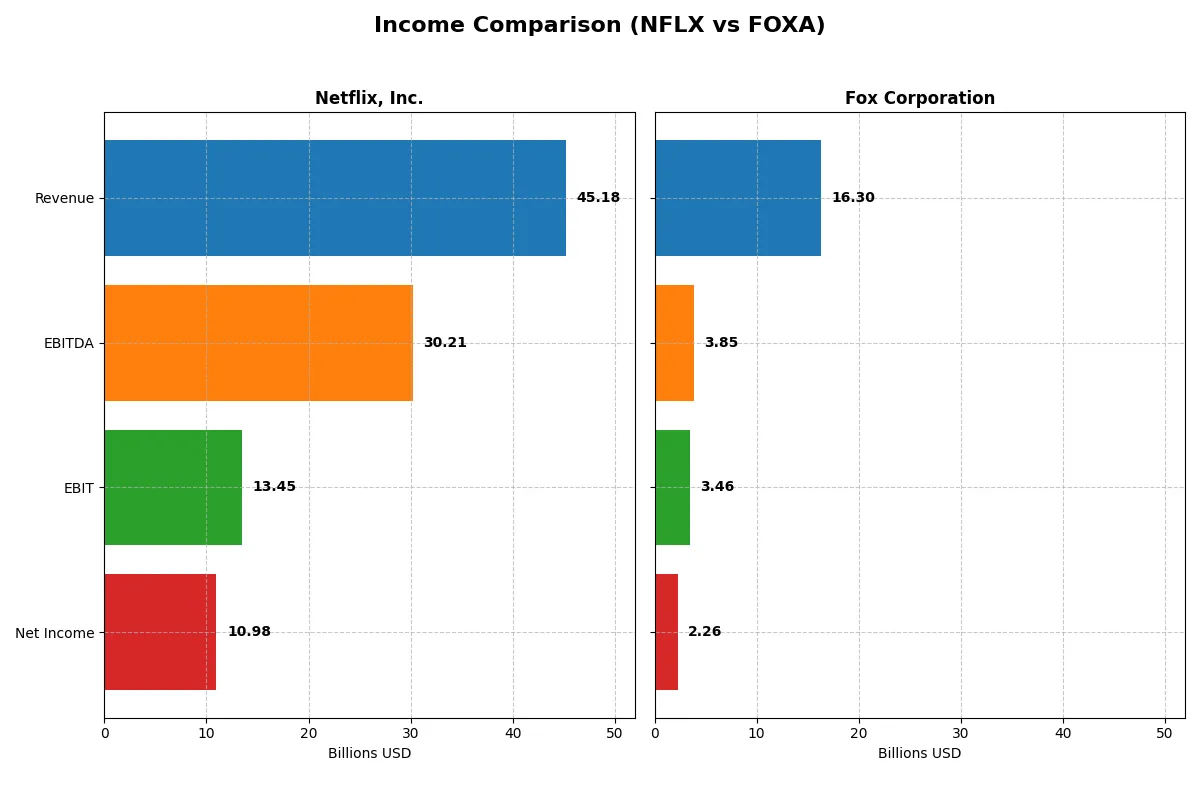
This data dissects the core profitability and scalability of both corporate engines to reveal who dominates the bottom line:
| Metric | Netflix, Inc. (NFLX) | Fox Corporation (FOXA) |
|---|---|---|
| Revenue | 45.2B | 16.3B |
| Cost of Revenue | 23.3B | 10.9B |
| Operating Expenses | 8.6B | 2.2B |
| Gross Profit | 21.9B | 5.4B |
| EBITDA | 30.2B | 3.8B |
| EBIT | 13.5B | 3.5B |
| Interest Expense | 777M | 403M |
| Net Income | 11.0B | 2.3B |
| EPS | 2.58 | 4.97 |
| Fiscal Year | 2025 | 2025 |
Income Statement Analysis: The Bottom-Line Duel
This income statement comparison reveals which company runs a more efficient and profitable corporate engine through recent financial performance.
Netflix, Inc. Analysis
Netflix’s revenue surged 15.85% in 2025 to $45.2B, with net income climbing 26% to $11B. Gross margin stands strong at 48.5%, reflecting robust cost control. Netflix’s net margin at 24.3% highlights exceptional profitability, supported by a 29.8% EBIT margin. The company’s efficiency and momentum accelerated, driven by consistent revenue and margin expansion.
Fox Corporation Analysis
Fox Corporation grew revenue 16.6% in 2025 to $16.3B, while net income rose 51% to $2.26B. Gross margin is a healthy 33.1%, though it suffered a large one-year decline in gross profit growth. Fox maintains a solid net margin of 13.9% and improved EBIT margin to 21.3%. Despite some volatility in profitability, Fox shows strong top-line growth and margin recovery.
Margin Leadership vs. Growth Resilience
Netflix dominates both scale and margin efficiency, delivering higher absolute profits and superior margin expansion consistently. Fox shows impressive revenue growth and a notable net income jump, but its lower margins and gross profit volatility temper enthusiasm. For investors, Netflix’s profile offers stronger bottom-line reliability and margin power over Fox’s growth resilience.
Financial Ratios Comparison
These vital ratios act as a diagnostic tool to expose the underlying fiscal health, valuation premiums, and capital efficiency of the companies compared:
| Ratios | Netflix, Inc. (NFLX) | Fox Corporation (FOXA) |
|---|---|---|
| ROE | 41.3% | 18.9% |
| ROIC | 25.2% | 11.9% |
| P/E | 36.1 | 11.4 |
| P/B | 14.9 | 2.16 |
| Current Ratio | 1.19 | 2.91 |
| Quick Ratio | 1.19 | 2.76 |
| D/E (Debt-to-Equity) | 0.54 | 0.62 |
| Debt-to-Assets | 26.0% | 32.2% |
| Interest Coverage | 17.2 | 8.01 |
| Asset Turnover | 0.81 | 0.70 |
| Fixed Asset Turnover | 22.5 | 6.47 |
| Payout ratio | 0% | 12.2% |
| Dividend yield | 0% | 1.07% |
| Fiscal Year | 2025 | 2025 |
Efficiency & Valuation Duel: The Vital Signs
Financial ratios serve as a company’s DNA, uncovering unseen risks and showcasing operational strengths that shape investment decisions.
Netflix, Inc.
Netflix demonstrates robust profitability with a 41.3% ROE and a strong 24.3% net margin, signaling operational efficiency. However, its valuation appears stretched, with a high P/E of 36.1 and P/B of 14.9. The company pays no dividend, opting instead to reinvest heavily in R&D and growth initiatives, supporting future expansion.
Fox Corporation
Fox posts solid profitability with an 18.9% ROE and a 13.9% net margin, reflecting steady operational returns. Its valuation is attractive, boasting a low P/E of 11.4 and a reasonable P/B of 2.16. Fox distributes a modest 1.07% dividend yield, balancing shareholder returns with stable cash flow generation.
Premium Valuation vs. Operational Safety
Netflix offers superior profitability but commands a premium valuation that elevates investment risk. Fox presents a more balanced profile with favorable valuation metrics and steady returns. Investors prioritizing growth may favor Netflix’s reinvestment strategy, while those seeking valuation safety might lean toward Fox.
Which one offers the Superior Shareholder Reward?
Netflix (NFLX) pays no dividends but reinvests heavily in growth, boasting a free cash flow per share of 2.24 and minimal debt leverage (debt/equity 0.54). Fox Corporation (FOXA) yields 1.07% with a modest payout ratio (~12%) and robust buybacks reflected in a free cash flow per share of 6.49. FOXA’s distribution balances income and capital returns, supported by a strong current ratio (2.91), while NFLX prioritizes expansion in a competitive streaming market. I find FOXA’s yield plus buyback approach more sustainable and attractive for total shareholder return in 2026.
Comparative Score Analysis: The Strategic Profile
The radar chart reveals the fundamental DNA and trade-offs of Netflix, Inc. and Fox Corporation, highlighting core financial strengths and vulnerabilities:
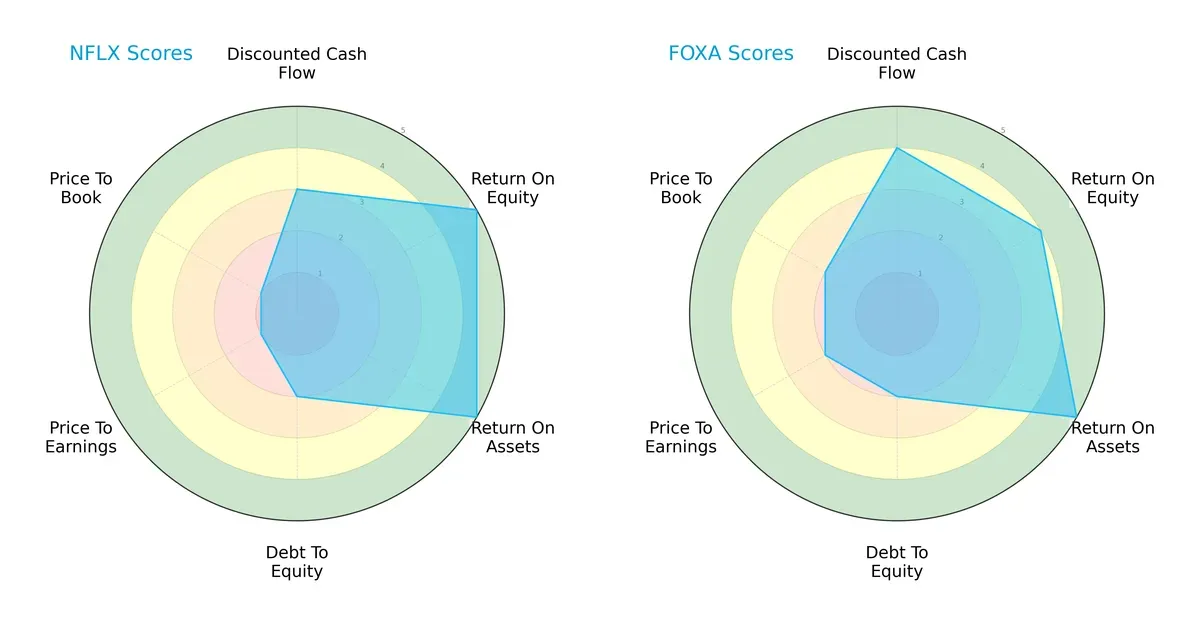
Netflix excels in profitability metrics with very favorable ROE and ROA scores of 5 each, signaling superior asset and equity efficiency. Fox Corporation shows a more balanced profile, scoring favorably in discounted cash flow (4) and valuation metrics (P/E and P/B at 2), indicating a more prudent capital allocation and valuation discipline. Both firms share moderate debt-to-equity risk (2), but Netflix’s valuation scores lag significantly (both at 1), exposing potential overvaluation risks. Overall, Fox’s diversified strengths suggest steadier resilience versus Netflix’s reliance on operational efficiency.
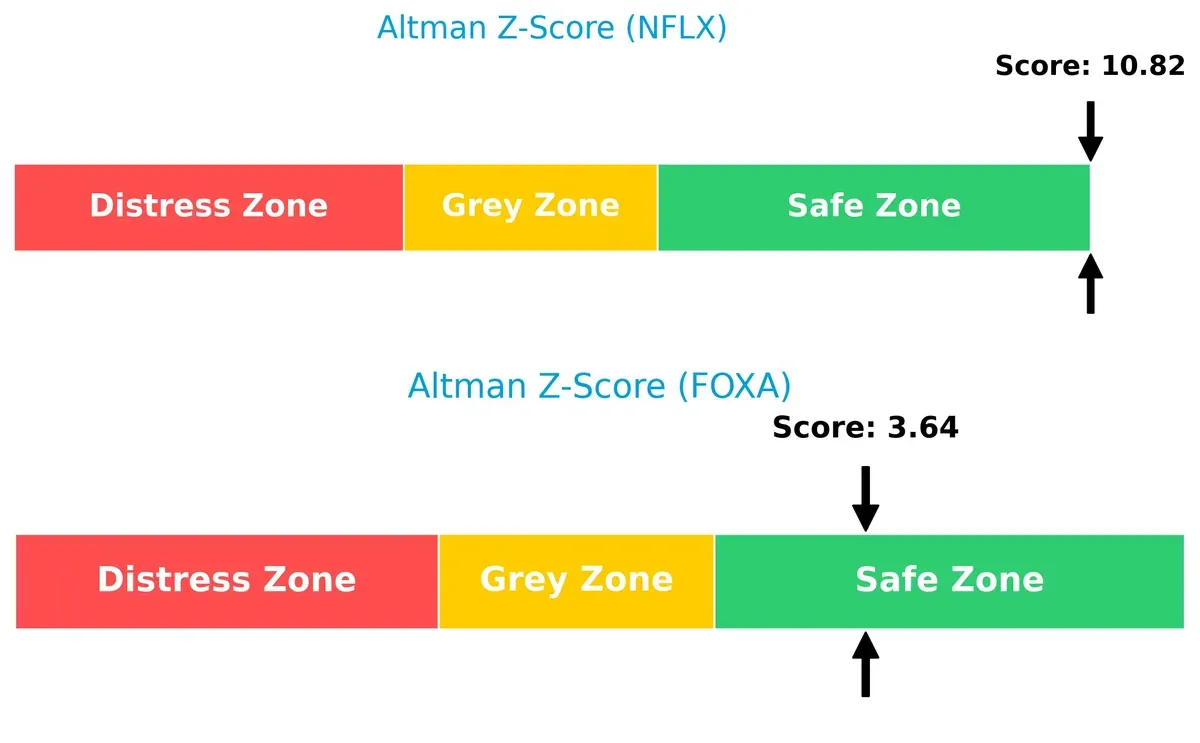
Bankruptcy Risk: Solvency Showdown
Netflix’s Altman Z-Score of 10.8 vastly outpaces Fox’s 3.6, both safely above the distress threshold. This gap implies Netflix stands on rock-solid solvency footing, reducing bankruptcy risk even in downturns, while Fox’s moderate score suggests adequate but less robust financial safety:
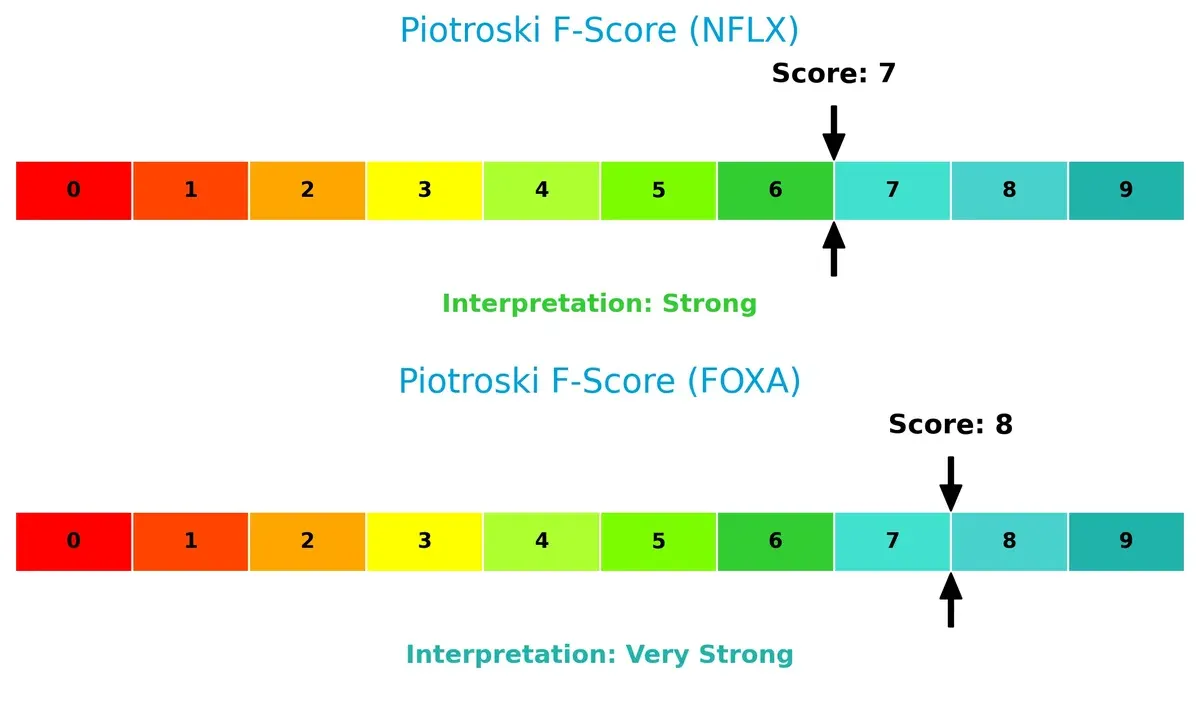
Financial Health: Quality of Operations
Fox Corporation’s Piotroski F-Score of 8 slightly surpasses Netflix’s 7, indicating marginally stronger financial health and operational quality. Netflix’s score remains strong, but Fox’s near-peak rating flags fewer internal red flags and better fundamentals overall:
How are the two companies positioned?
This section dissects the operational DNA of Netflix and Fox by comparing their revenue distribution and internal dynamics. The goal is to confront their economic moats to identify which model offers the most resilient competitive advantage today.
Revenue Segmentation: The Strategic Mix
The following visual comparison dissects how both firms diversify their income streams and where their primary sector bets lie:
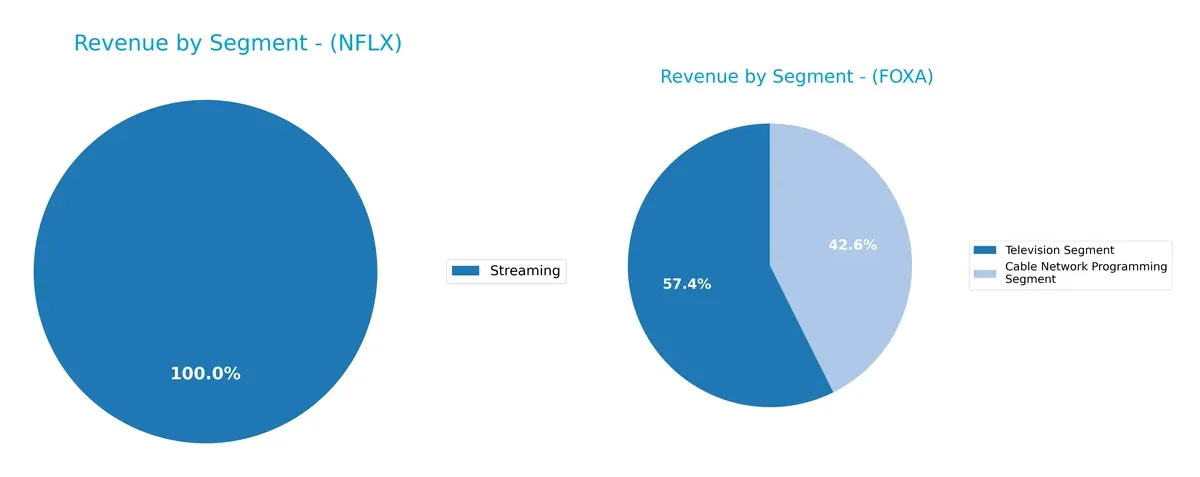
Netflix anchors almost entirely on streaming, generating $39B in 2024, with negligible DVD revenues. Fox Corporation shows a more diversified model, splitting roughly between its Television segment ($9.3B) and Cable Network Programming ($6.9B). Netflix’s heavy streaming reliance signals strong ecosystem lock-in but exposes it to subscription volatility. Fox’s dual-segment approach mitigates risk yet depends on traditional media strength amid industry shifts.
Strengths and Weaknesses Comparison
This table compares the Strengths and Weaknesses of Netflix and Fox Corporation:
Netflix Strengths
- Strong profitability with 24.3% net margin and 41.26% ROE
- Favorable ROIC of 25.22% well above WACC
- High interest coverage at 17.33
- Significant global presence with broad geographic revenue
- Robust streaming revenue growth to $39B in 2024
Fox Corporation Strengths
- Solid profitability with 13.88% net margin and 18.92% ROE
- Lower WACC at 5.76%, indicating cheaper capital
- Strong current and quick ratios above 2.7
- Stable and diversified segments including Cable and Television
- Favorable P/E of 11.42 supporting valuation attractiveness
Netflix Weaknesses
- High P/E (36.11) and P/B (14.9) ratios suggest overvaluation risk
- WACC (11.59%) exceeds cost of capital, challenging value creation
- Limited diversification, streaming dominates revenue
- Current ratio neutral at 1.19, potential liquidity constraints
- No dividend yield may deter income investors
Fox Corporation Weaknesses
- Moderate ROIC of 11.89% only slightly above WACC
- Debt to assets at 32.18% is neutral, implying moderate leverage
- Neutral P/B ratio at 2.16 limits asset efficiency signal
- Dividend yield low at 1.07%, less attractive for yield focus
- Asset turnover neutral at 0.7, indicating average operational efficiency
Overall, Netflix demonstrates superior profitability metrics and a dominant global streaming presence but faces valuation and capital cost headwinds. Fox benefits from a more favorable capital structure and stable cash flows across segments but shows moderate return on invested capital and average operational efficiency. These contrasts highlight differing strategic focuses and financial profiles in the media sector.
The Moat Duel: Analyzing Competitive Defensibility
A structural moat is the only true barrier protecting long-term profits from relentless competition erosion. Here is how Netflix and Fox Corporation defend their turf:
Netflix, Inc.: Streaming Content and Scale Moat
Netflix’s primary moat is its vast content library and global scale, creating strong switching costs. This manifests in a high ROIC of 13.6% above WACC, with margin stability. Expansion into mobile gaming and international markets in 2026 should deepen this advantage.
Fox Corporation: Broadcast Network and Sports Content Moat
Fox’s moat centers on exclusive sports and news content, distinct from Netflix’s digital scale. Its ROIC at 6.1% above WACC confirms value creation but at a narrower margin. Growth in digital streaming via Tubi and blockchain content offers new, though less proven, expansion paths.
Streaming Scale vs. Content Exclusivity: The Moat Showdown
Netflix’s wider moat stems from dominant scale and diversified content, driving superior ROIC and margin growth. Fox’s moat is narrower, relying on exclusive rights and traditional media strength. Netflix is better positioned to defend and expand market share in 2026.
Which stock offers better returns?
Over the past 12 months, both Netflix and Fox Corporation exhibited strong price gains with contrasting recent momentum, reflecting notable shifts in trading dynamics.
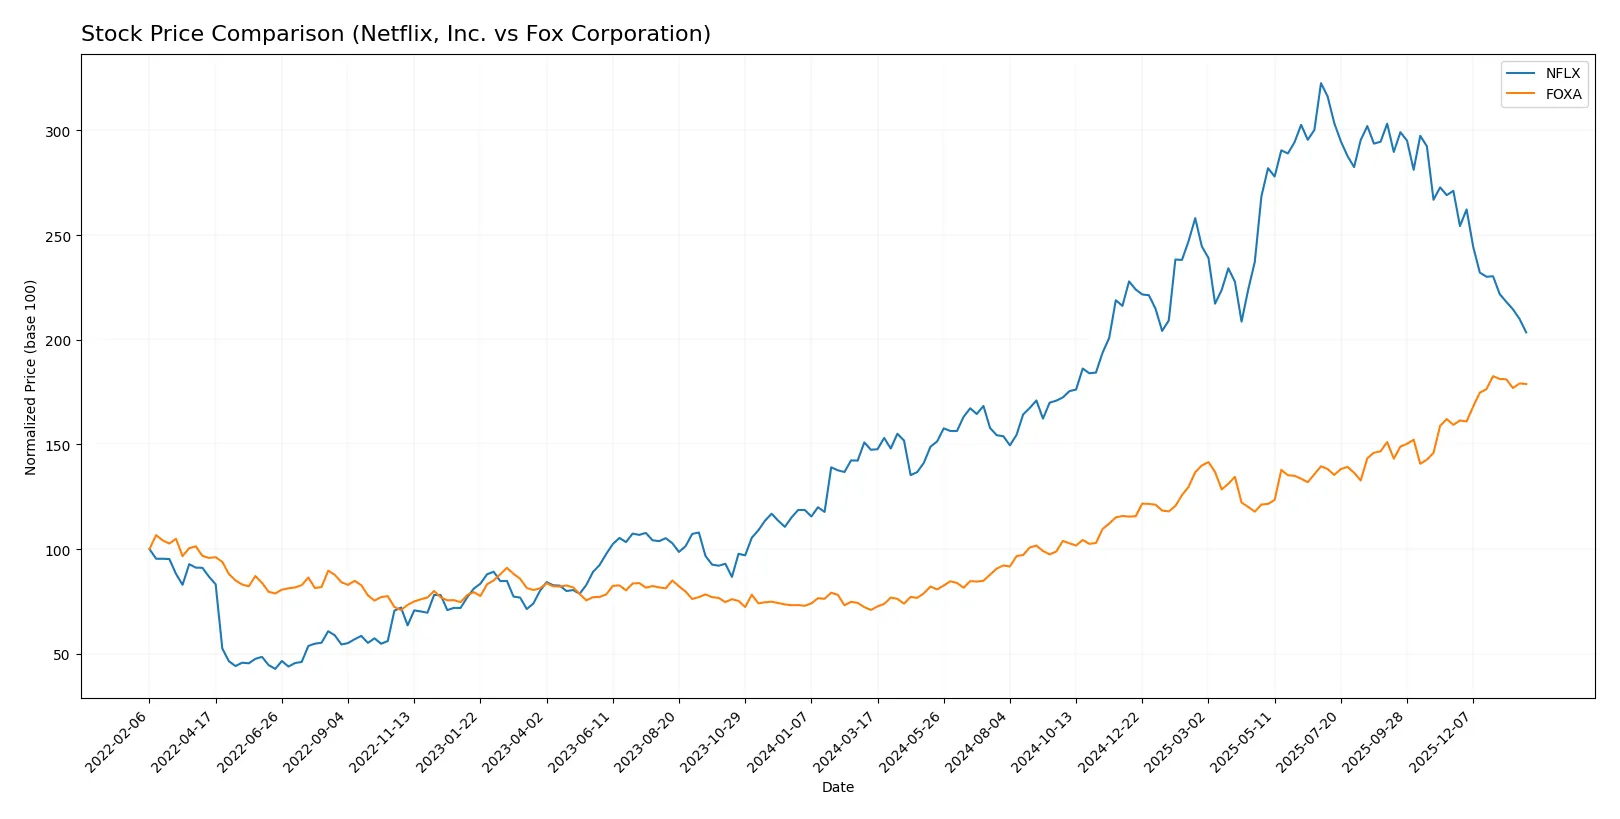
Trend Comparison
Netflix’s stock rose 38.05% over the last year, marking a bullish trend with decelerating gains. It peaked at 132.31 and bottomed at 55.5, showing high volatility (22.37 std deviation).
Fox Corporation surged 152.18% in the same period, an accelerating bullish trend. The stock ranged between 28.86 and 74.3 with moderate volatility (12.21 std deviation).
Fox Corporation outperformed Netflix by a wide margin in overall returns. Recent trends favor Fox, while Netflix faced a sharp 24.93% decline from November 2025 to February 2026.
Target Prices
Analysts present a moderate upside potential for Netflix and Fox Corporation based on current consensus targets.
| Company | Target Low | Target High | Consensus |
|---|---|---|---|
| Netflix, Inc. | 95 | 152 | 117.25 |
| Fox Corporation | 64 | 97 | 76.63 |
Netflix’s target consensus exceeds its current price by over 40%, signaling bullish sentiment amid market volatility. Fox Corporation’s targets suggest modest appreciation, aligning closely with its recent trading range.

Don’t Let Luck Decide Your Entry Point
Optimize your entry points with our advanced ProRealTime indicators. You’ll get efficient buy signals with precise price targets for maximum performance. Start outperforming now!
How do institutions grade them?
Netflix, Inc. Grades
The following table shows recent grades from reputable firms for Netflix, Inc.:
| Grading Company | Action | New Grade | Date |
|---|---|---|---|
| Freedom Capital Markets | Buy | Buy | 2026-01-27 |
| Argus Research | Maintain | Buy | 2026-01-22 |
| Wolfe Research | Maintain | Outperform | 2026-01-21 |
| Needham | Maintain | Buy | 2026-01-21 |
| Pivotal Research | Maintain | Hold | 2026-01-21 |
| Goldman Sachs | Maintain | Neutral | 2026-01-21 |
| BMO Capital | Maintain | Outperform | 2026-01-21 |
| Deutsche Bank | Maintain | Hold | 2026-01-21 |
| Canaccord Genuity | Maintain | Buy | 2026-01-21 |
| Oppenheimer | Maintain | Outperform | 2026-01-21 |
Fox Corporation Grades
Below is a summary of recent institutional grades for Fox Corporation:
| Grading Company | Action | New Grade | Date |
|---|---|---|---|
| Guggenheim | Maintain | Buy | 2025-12-22 |
| B of A Securities | Maintain | Buy | 2025-12-19 |
| Goldman Sachs | Maintain | Buy | 2025-12-19 |
| Morgan Stanley | Maintain | Equal Weight | 2025-12-18 |
| Citigroup | Maintain | Buy | 2025-11-12 |
| UBS | Maintain | Buy | 2025-10-31 |
| TD Cowen | Maintain | Hold | 2025-10-31 |
| Barclays | Maintain | Equal Weight | 2025-10-31 |
| Evercore ISI Group | Maintain | In Line | 2025-10-31 |
| Wells Fargo | Maintain | Overweight | 2025-10-31 |
Which company has the best grades?
Netflix holds a stronger consensus with multiple “Buy” and “Outperform” ratings from top firms. Fox shows solid “Buy” ratings but also several “Hold” and “Equal Weight” grades. This suggests Netflix currently enjoys more favorable institutional sentiment, potentially influencing investor confidence.
Risks specific to each company
In today’s complex 2026 market, these categories highlight the critical pressure points and systemic threats facing both Netflix, Inc. and Fox Corporation:
1. Market & Competition
Netflix, Inc.
- Faces intense global streaming rivalry with rising content costs and subscriber saturation risks.
Fox Corporation
- Competes in U.S. news, sports, and entertainment with significant digital platform pressure and audience fragmentation.
2. Capital Structure & Debt
Netflix, Inc.
- Moderate leverage with D/E at 0.54; interest coverage strong at 17.33, signaling good debt management.
Fox Corporation
- Slightly higher leverage at 0.62 D/E; interest coverage lower at 8.6, indicating tighter debt service capacity.
3. Stock Volatility
Netflix, Inc.
- High beta of 1.71 reflects significant stock price volatility relative to market swings.
Fox Corporation
- Low beta of 0.51 shows relative stability, less sensitive to overall market fluctuations.
4. Regulatory & Legal
Netflix, Inc.
- Faces evolving global content regulation and data privacy laws impacting distribution and user data handling.
Fox Corporation
- Subject to stringent U.S. broadcasting regulations and political scrutiny affecting content and advertising revenues.
5. Supply Chain & Operations
Netflix, Inc.
- Relies heavily on digital infrastructure and content creation pipelines vulnerable to tech disruptions.
Fox Corporation
- Dependent on traditional and digital broadcast infrastructure; operational risks tied to media production facilities.
6. ESG & Climate Transition
Netflix, Inc.
- Increasing pressure to demonstrate sustainable content production and reduce carbon footprint in data centers.
Fox Corporation
- Must address environmental impacts in studio operations and align with growing ESG investor expectations.
7. Geopolitical Exposure
Netflix, Inc.
- Global subscriber base exposes it to geopolitical risks including censorship and trade tensions.
Fox Corporation
- Primarily U.S.-focused, reducing direct geopolitical risks but sensitive to domestic regulatory shifts.
Which company shows a better risk-adjusted profile?
Netflix’s highest risk stems from fierce global competition and subscriber growth challenges amid capital-intensive content spending. Fox’s main risk lies in regulatory scrutiny and operational dependencies in a fragmented U.S. media landscape. Fox’s lower volatility and stronger valuation metrics suggest a better risk-adjusted profile in 2026. Netflix’s high leverage and stock volatility warrant cautious monitoring despite strong profitability. Recent data confirms Fox’s healthier balance sheet and more stable market behavior, supporting its relative risk advantage.
Final Verdict: Which stock to choose?
Netflix’s superpower lies in its unmatched ability to generate high returns on invested capital, signaling a durable competitive edge in streaming. Its point of vigilance is the elevated valuation multiples, which could pressure future gains. Netflix fits well in aggressive growth portfolios seeking innovation leaders.
Fox Corporation’s moat stems from its stable cash flow and attractive valuation, reinforced by strong free cash flow yield and a conservative capital structure. It offers better safety metrics relative to Netflix. Fox suits investors favoring GARP—growth at a reasonable price—with more income stability.
If you prioritize high-growth exposure and market leadership, Netflix is the compelling choice due to its superior ROIC and expanding profitability. However, if you seek a more defensive growth profile with solid cash flow and valuation discipline, Fox offers better stability and a favorable risk-return balance for conservative growth investors.
Disclaimer: Investment carries a risk of loss of initial capital. The past performance is not a reliable indicator of future results. Be sure to understand risks before making an investment decision.
Go Further
I encourage you to read the complete analyses of Netflix, Inc. and Fox Corporation to enhance your investment decisions: