Home > Comparison > Technology > FTV vs TRMB
The strategic rivalry between Fortive Corporation and Trimble Inc. defines the current trajectory of the technology hardware and equipment sector. Fortive operates as a diversified industrial technology company with a broad portfolio of professional products and enterprise software. In contrast, Trimble focuses on precision solutions across construction, agriculture, and transportation. This analysis will assess which corporate model delivers superior risk-adjusted returns for a diversified portfolio amid evolving sector dynamics.

Table of contents
Companies Overview
Fortive and Trimble both command significant roles in the hardware and equipment sector with distinct technological emphases.
Fortive Corporation: Diverse Industrial Technology Leader
Fortive dominates as a provider of professional and engineered products globally. Its revenue stems from a broad portfolio, including reliability tools, enterprise software, and precision instruments. In 2026, Fortive sharpens its focus on connected operating solutions and advanced healthcare technologies, leveraging well-known brands like FLUKE and TEKTRONIX to strengthen its industrial and healthcare market foothold.
Trimble Inc.: Integrated Technology Solutions Specialist
Trimble centers on technology solutions that optimize field and mobile workflows. It generates income through software for construction, geospatial products, precision agriculture, and transportation management. Trimble’s 2026 strategy revolves around enhancing integrated software platforms for infrastructure and resource management, capitalizing on its expertise in 3D design and autonomous farming technologies to drive operational efficiency.
Strategic Collision: Similarities & Divergences
Fortive embraces a diversified hardware-software model, while Trimble prioritizes integrated software ecosystems for specialized sectors. Their competition converges mainly in construction and infrastructure technology markets. Fortive’s broad industrial scope contrasts with Trimble’s focused innovation in mobility and agriculture, creating distinct risk-return profiles for investors seeking industrial diversification versus sector-specific growth.
Income Statement Comparison
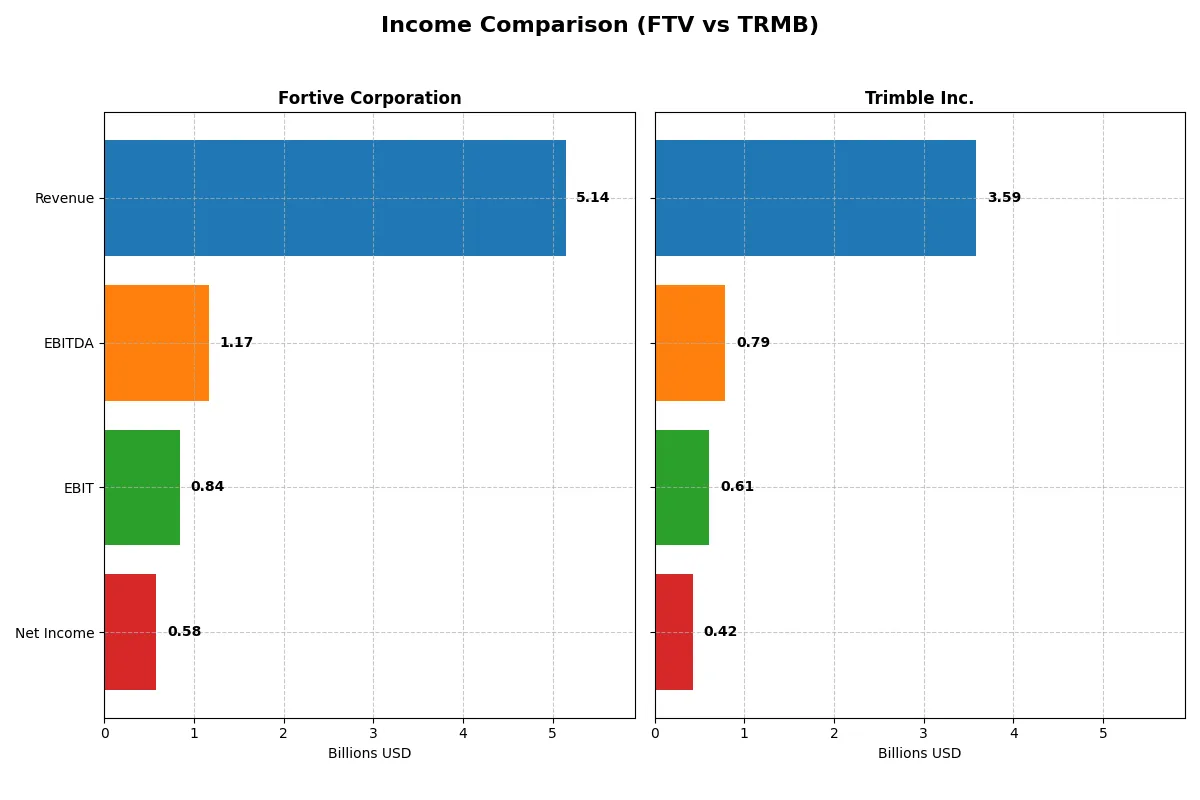
This data dissects the core profitability and scalability of both corporate engines to reveal who dominates the bottom line:
| Metric | Fortive Corporation (FTV) | Trimble Inc. (TRMB) |
|---|---|---|
| Revenue | 5.14B | 3.59B |
| Cost of Revenue | 2.01B | 1.14B |
| Operating Expenses | 2.23B | 1.84B |
| Gross Profit | 3.13B | 2.45B |
| EBITDA | 1.17B | 789.5M |
| EBIT | 843.4M | 609.6M |
| Interest Expense | 120.5M | 74.4M |
| Net Income | 579.2M | 424M |
| EPS | 1.75 | 1.77 |
| Fiscal Year | 2025 | 2025 |
Income Statement Analysis: The Bottom-Line Duel
This income statement comparison reveals which company drives stronger profitability and operational efficiency across recent years.
Fortive Corporation Analysis
Fortive’s revenue peaked at 6.2B in 2024 before dropping 17.5% to 5.1B in 2025, dragging net income down from 833M to 579M. Despite this decline, Fortive maintains robust gross margins near 61% and a solid net margin above 11%. The 2025 results show weakening momentum but consistent operational discipline, reflected in a favorable 16.4% EBIT margin.
Trimble Inc. Analysis
Trimble’s revenue remained more stable, dipping only 2.6% to 3.6B in 2025, with net income sharply falling from 1.5B in 2024 to 424M. The company sustains a higher gross margin of 68% and a slightly better net margin of 11.8%. However, the steep 71% decline in net margin and EPS growth in 2025 signals severe profit erosion despite operational leverage.
Margin Stability vs. Profit Volatility
Fortive shows stronger margin stability but suffers from notable revenue and profit contraction. Trimble offers higher gross margins but faces acute earnings volatility. Fortive’s consistent margin profile suits investors prioritizing operational efficiency. Trimble’s profile may attract those focused on top-line resilience but wary of profit swings.
Financial Ratios Comparison
These vital ratios act as a diagnostic tool to expose the underlying fiscal health, valuation premiums, and capital efficiency of the companies compared below:
| Ratios | Fortive Corporation (FTV) | Trimble Inc. (TRMB) |
|---|---|---|
| ROE | 8.98% | 7.27% |
| ROIC | 7.44% | 6.48% |
| P/E | 30.16 | 43.87 |
| P/B | 2.71 | 3.19 |
| Current Ratio | 0.71 | 1.09 |
| Quick Ratio | 0.58 | 0.96 |
| D/E (Debt-to-Equity) | 0.50 | 0.24 |
| Debt-to-Assets | 27.3% | 15.0% |
| Interest Coverage | 7.54 | 8.17 |
| Asset Turnover | 0.44 | 0.39 |
| Fixed Asset Turnover | 19.06 | 19.62 |
| Payout Ratio | 15.9% | 0% |
| Dividend Yield | 0.53% | 0% |
| Fiscal Year | 2025 | 2025 |
Efficiency & Valuation Duel: The Vital Signs
Financial ratios serve as the company’s DNA, exposing hidden risks and operational strengths essential for investor insight.
Fortive Corporation
Fortive shows a solid net margin of 11.26% but a modest ROE of 8.98%, signaling moderate profitability. Its P/E ratio at 30.16 suggests the stock trades at a stretched valuation. Fortive maintains a low dividend yield of 0.53%, focusing shareholder returns on reinvestment in R&D, evident from its 6.66% R&D-to-revenue ratio.
Trimble Inc.
Trimble posts a slightly higher net margin of 11.82% but a lower ROE at 7.27%, indicating less efficient equity use. Its P/E of 43.87 marks it as expensive compared to Fortive. Trimble pays no dividend, reinvesting aggressively in growth with a 17.58% R&D-to-revenue ratio, reflecting a strategy focused on innovation over immediate returns.
Valuation Stretch vs. Operational Efficiency
Fortive balances moderate profitability with a more reasonable valuation and a commitment to R&D alongside a modest dividend. Trimble, while profitable, commands a premium price with weaker equity returns and no dividends, investing heavily in growth. Risk-tolerant investors seeking innovation may prefer Trimble; those favoring valuation discipline might lean toward Fortive.
Which one offers the Superior Shareholder Reward?
I compare Fortive Corporation (FTV) and Trimble Inc. (TRMB) on shareholder reward through dividends, buybacks, and sustainability. Fortive yields 0.53% with a 16% payout ratio, maintaining steady dividends covered 5.5x by FCF. Trimble pays no dividends but reinvests heavily, evidenced by a low free cash flow yield and a 34% price-to-free-cash-flow ratio. Buybacks are more pronounced at Fortive, supporting total return. Trimble’s aggressive reinvestment targets growth but risks valuation premium. I conclude Fortive offers a more balanced, sustainable shareholder reward in 2026, favoring income and buybacks over Trimble’s growth gamble.
Comparative Score Analysis: The Strategic Profile
The radar chart reveals the fundamental DNA and trade-offs of Fortive Corporation and Trimble Inc., highlighting their core financial strengths and vulnerabilities:
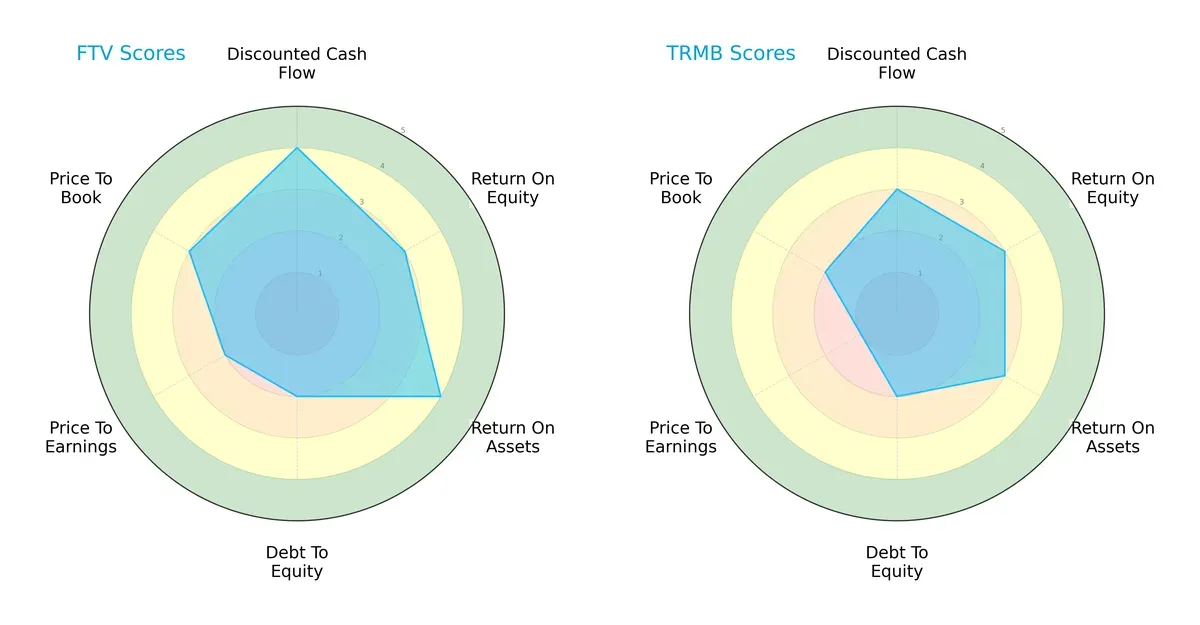
Fortive leads with stronger discounted cash flow (4 vs. 3) and return on assets (4 vs. 3), showing superior cash generation and asset efficiency. Both firms share moderate return on equity (3 each) and weak debt-to-equity scores (2 each), signaling elevated leverage risks. Trimble’s valuation metrics lag more significantly, with very unfavorable price-to-earnings (1 vs. 2) and price-to-book (2 vs. 3) scores. Fortive presents a more balanced financial profile, while Trimble relies heavily on operational efficiency but suffers from valuation and leverage concerns.
—
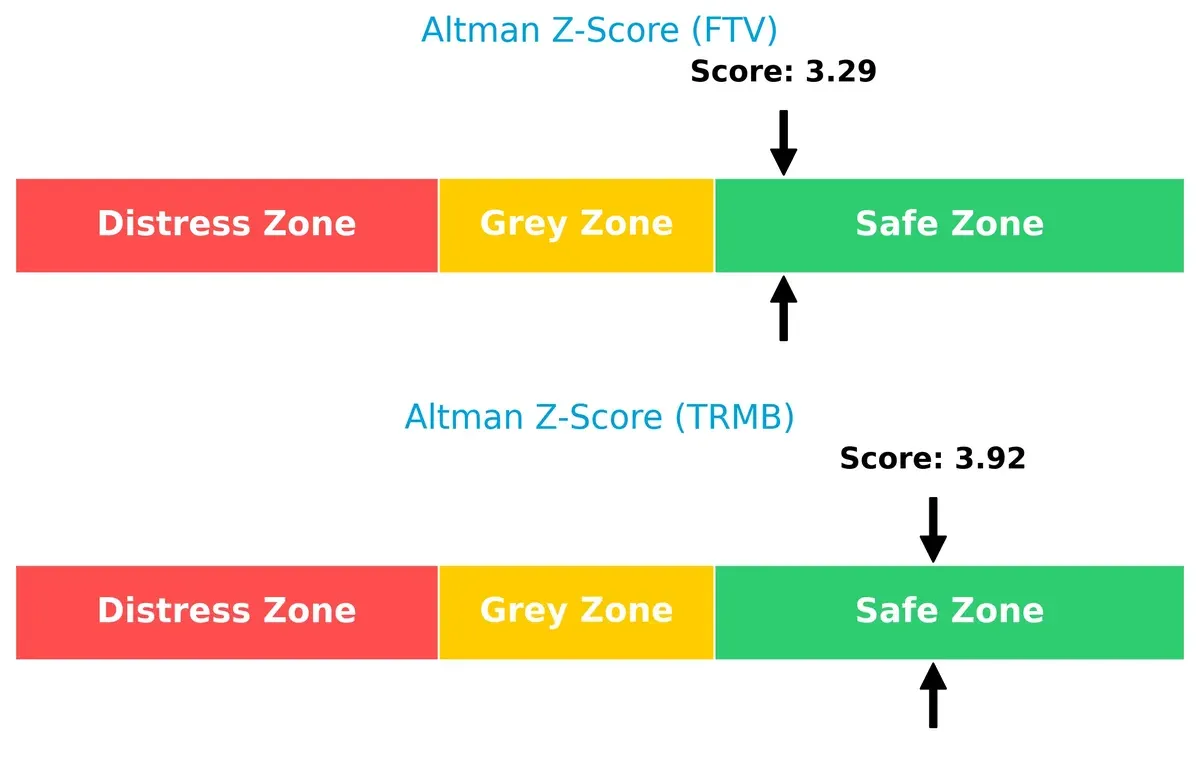
Bankruptcy Risk: Solvency Showdown
Fortive and Trimble both reside in the safe zone, but Trimble’s higher Altman Z-Score (3.92 vs. 3.29) suggests a stronger buffer against bankruptcy risks in this economic cycle:
—
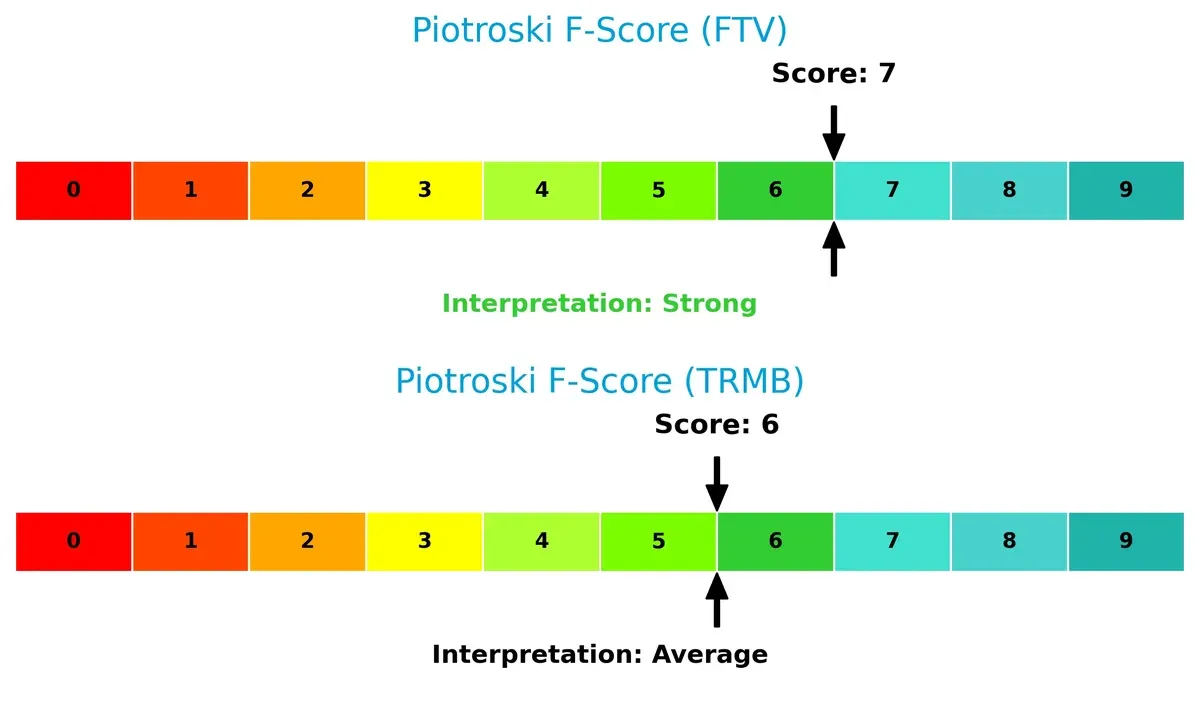
Financial Health: Quality of Operations
Fortive’s Piotroski F-Score of 7 indicates robust financial health, outperforming Trimble’s moderate score of 6. This suggests Fortive manages profitability, leverage, and liquidity more effectively, while Trimble shows modest red flags in internal financial metrics:
How are the two companies positioned?
This section dissects the operational DNA of Fortive and Trimble by comparing their revenue distribution and internal dynamics. The goal is to confront their economic moats to identify which model offers the most resilient, sustainable competitive advantage today.
Revenue Segmentation: The Strategic Mix
The following visual comparison dissects how Fortive Corporation and Trimble Inc. diversify their income streams and where their primary sector bets lie:
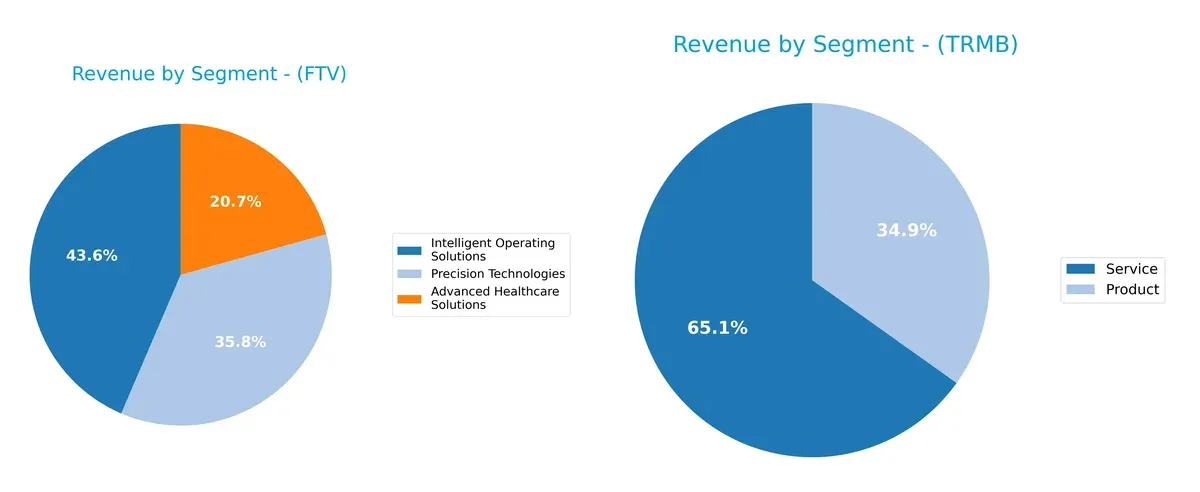
Fortive anchors its revenue in three nearly balanced segments: Intelligent Operating Solutions at $2.7B, Precision Technologies at $2.2B, and Advanced Healthcare Solutions at $1.3B. This mix signals a strong diversification across healthcare, tech, and industrial markets. Trimble, however, pivots heavily toward Services at $2.4B, dwarfs its Product segment at $1.3B, revealing a dependency on recurring revenue but also concentration risk if service demand wanes. Fortive’s balanced portfolio mitigates volatility better than Trimble’s service-heavy model.
Strengths and Weaknesses Comparison
This table compares the strengths and weaknesses of Fortive Corporation and Trimble Inc. based on diversification, profitability, financials, innovation, global presence, and market share:
Fortive Corporation Strengths
- Diversified revenue across Advanced Healthcare, Intelligent Operating, and Precision Technologies
- Favorable net margin at 11.26%
- Strong interest coverage at 7.0
- Lower debt-to-assets ratio at 27.31% supports financial stability
- High fixed asset turnover at 19.06
Trimble Inc. Strengths
- Favorable net margin at 11.82%
- Strong interest coverage at 8.19
- Lower debt-to-assets ratio at 14.95% indicates conservative leverage
- Diversified product and service segments including Buildings, Geospatial, and Transportation
- Global presence with broad geographic revenue
Fortive Corporation Weaknesses
- Current ratio at 0.71 signals liquidity concerns
- Unfavorable ROE at 8.98% below typical benchmarks
- Elevated P/E at 30.16 suggests premium valuation
- Asset turnover at 0.44 reflects moderate operational efficiency
- Dividend yield low at 0.53%
Trimble Inc. Weaknesses
- Unfavorable WACC at 10.51% may increase capital costs
- Unfavorable P/E at 43.87 indicates high market expectations
- Unfavorable PB ratio at 3.19 suggests overvaluation
- ROE at 7.27% is weak compared to peers
- Zero dividend yield limits income investor appeal
Fortive’s strength lies in diversified segments and solid financial leverage, though liquidity and return on equity raise caution. Trimble shows profitability and conservative debt but faces valuation and capital cost challenges. Both firms must balance growth investments with prudent capital allocation to sustain competitiveness.
The Moat Duel: Analyzing Competitive Defensibility
A structural moat alone protects long-term profits from relentless competitive erosion. Let’s dissect how Fortive and Trimble defend their turf:
Fortive Corporation: Diversified Product Portfolio Moat
Fortive’s moat stems from its broad hardware and software ecosystem serving multiple industries. This diversification drives margin stability and a growing ROIC trend despite recent revenue setbacks. New healthcare and industrial solutions could expand its moat in 2026.
Trimble Inc.: Technology Integration and Precision Solutions Moat
Trimble’s moat relies on specialized GPS and software solutions tightly integrated across construction, agriculture, and transportation. Though facing a declining ROIC trend, its niche tech commands premium pricing and operational efficiency. Expansion into autonomous systems may disrupt markets ahead.
RoIC Growth vs. Decline: Fortive’s Diversity Battles Trimble’s Specialization
Fortive’s slightly unfavorable moat status contrasts with Trimble’s very unfavorable rating, driven by shrinking ROIC and profitability. I see Fortive’s diversified product base as a wider moat, better positioned to defend market share amid evolving tech demands.
Which stock offers better returns?
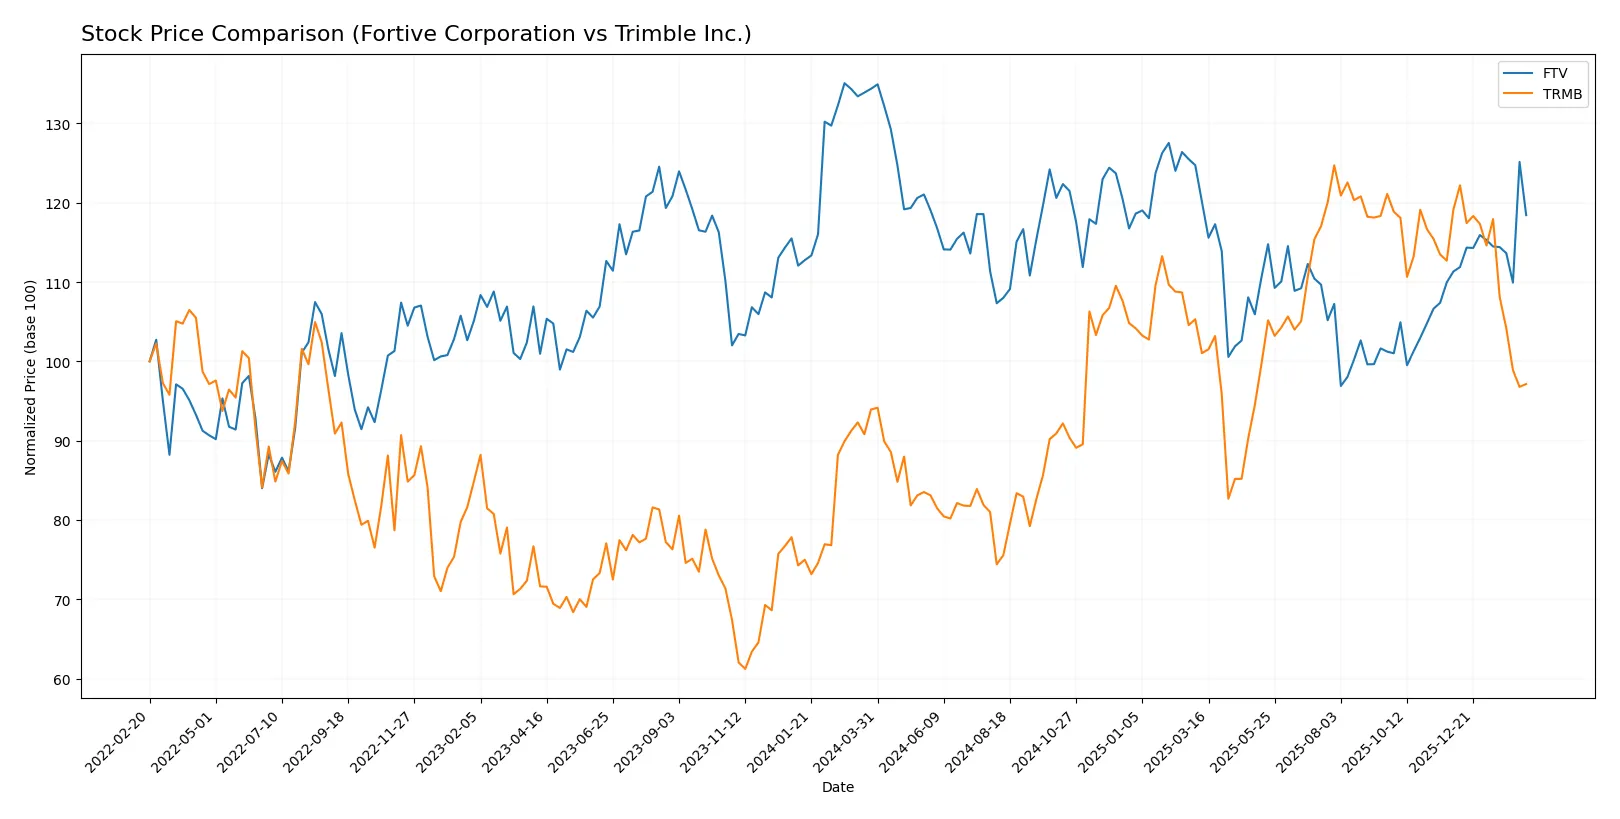
The past year shows contrasting price dynamics: Fortive Corporation’s shares declined sharply before a recent rebound, while Trimble Inc. posted modest gains overall but faced a steep recent drop.
Trend Comparison
Fortive Corporation’s stock fell 11.85% over the past 12 months, signaling a bearish trend with accelerating decline. It reached a high of 64.82 and a low of 46.55, reflecting notable volatility with a 4.06 standard deviation.
Trimble Inc.’s stock rose 3.43% in the same period, indicating a bullish trend with decelerating growth. The price ranged between 50.86 and 85.24, but recent months saw an 18.45% drop, increasing volatility to 9.67 standard deviation.
Trimble outperformed Fortive over the full period, despite recent weakness. Fortive’s accelerated recovery contrasts with Trimble’s decelerating trend and higher volatility.
Target Prices
Analysts present a moderately optimistic consensus for Fortive Corporation and Trimble Inc., reflecting growth potential.
| Company | Target Low | Target High | Consensus |
|---|---|---|---|
| Fortive Corporation | 51 | 70 | 61 |
| Trimble Inc. | 86 | 101 | 95 |
Fortive’s consensus target of 61 sits above its current price of 56.9, suggesting modest upside. Trimble’s consensus of 95 significantly exceeds its current price of 66.4, indicating strong analyst confidence in future gains.

Don’t Let Luck Decide Your Entry Point
Optimize your entry points with our advanced ProRealTime indicators. You’ll get efficient buy signals with precise price targets for maximum performance. Start outperforming now!
How do institutions grade them?
The following tables summarize the latest institutional grades for Fortive Corporation and Trimble Inc.:
Fortive Corporation Grades
This table shows recent grade actions from major financial institutions for Fortive.
| Grading Company | Action | New Grade | Date |
|---|---|---|---|
| JP Morgan | Maintain | Underweight | 2026-02-11 |
| Barclays | Maintain | Equal Weight | 2026-02-09 |
| Wells Fargo | Maintain | Equal Weight | 2026-02-05 |
| RBC Capital | Maintain | Sector Perform | 2026-02-05 |
| Citigroup | Maintain | Neutral | 2026-02-05 |
Trimble Inc. Grades
This table lists recent institutional grades and actions for Trimble.
| Grading Company | Action | New Grade | Date |
|---|---|---|---|
| Wells Fargo | Maintain | Overweight | 2026-02-12 |
| Barclays | Maintain | Overweight | 2026-01-12 |
| Keybanc | Upgrade | Overweight | 2025-12-16 |
| Piper Sandler | Maintain | Overweight | 2025-11-07 |
| JP Morgan | Maintain | Overweight | 2025-09-19 |
Which company has the best grades?
Trimble consistently receives Overweight and Outperform grades, signaling stronger institutional confidence. Fortive mostly holds Neutral to Underweight ratings, implying more cautious sentiment. Investors may view Trimble as the favored pick based on current grading trends.
Risks specific to each company
The following categories identify the critical pressure points and systemic threats facing Fortive Corporation and Trimble Inc. in the 2026 market environment:
1. Market & Competition
Fortive Corporation
- Operates in diverse industrial markets with strong brand portfolio but faces intense hardware competition.
Trimble Inc.
- Focuses on tech-enabled solutions in construction and agriculture; higher beta indicates greater sensitivity to market swings.
2. Capital Structure & Debt
Fortive Corporation
- Moderate leverage with debt-to-assets at 27%; interest coverage strong at 7x, signaling manageable debt load.
Trimble Inc.
- Lower leverage at 15% debt-to-assets and higher interest coverage at 8.2x; more conservative capital structure.
3. Stock Volatility
Fortive Corporation
- Beta near 1.03 signals typical market volatility aligned with S&P 500 benchmarks.
Trimble Inc.
- Beta at 1.58 reflects elevated volatility, increasing risk for risk-averse investors.
4. Regulatory & Legal
Fortive Corporation
- Exposure to complex industrial and healthcare regulations; risk of compliance costs and litigation.
Trimble Inc.
- Faces evolving regulations in geospatial and agricultural tech; regulatory compliance could impact margins.
5. Supply Chain & Operations
Fortive Corporation
- Supply chain complexity across multiple segments, with some operational inefficiencies signaled by low asset turnover.
Trimble Inc.
- Relies on precision tech supply chains; moderate asset turnover suggests room to improve operational efficiency.
6. ESG & Climate Transition
Fortive Corporation
- Industrial footprint demands active management of environmental and social risks; moderate transition exposure.
Trimble Inc.
- Geospatial and ag-tech focus aligns with climate solutions but requires ongoing innovation to meet ESG standards.
7. Geopolitical Exposure
Fortive Corporation
- Global industrial exposure subjects it to trade tensions and supply disruptions.
Trimble Inc.
- Global markets and agricultural tech solutions face risks from geopolitical instability and trade policies.
Which company shows a better risk-adjusted profile?
Fortive’s most impactful risk lies in its liquidity constraints, with an unfavorable current ratio of 0.71 signaling potential short-term financial stress. Trimble’s principal risk is its high stock volatility, with a beta of 1.58 exposing it to wider market swings. Overall, Fortive presents a better risk-adjusted profile, supported by a safer Altman Z-Score and stronger Piotroski Score, despite some liquidity red flags. The recent data highlight Fortive’s solid debt management and operational scale as pillars mitigating risk more effectively than Trimble’s market sensitivity and valuation concerns.
Final Verdict: Which stock to choose?
Fortive Corporation (FTV) stands out for its resilient cash-generation ability and improving profitability despite value erosion. Its notable liquidity constraints warrant caution, marking it as suited for investors comfortable with operational risks seeking steady growth in cyclical industries.
Trimble Inc. (TRMB) leverages a strategic moat through its technological leadership and recurring revenue streams, delivering relative balance-sheet strength. While facing profitability headwinds and valuation premiums, it fits portfolios favoring innovation-driven growth with a tolerance for volatility.
If you prioritize stable cash conversion and improving returns amid operational challenges, Fortive offers a compelling scenario due to its growing ROIC trend and solid cash flow. However, if you seek exposure to technology-driven growth with a stronger balance sheet, Trimble presents better stability despite its declining profitability and higher valuation. Both choices carry distinct risks and reward profiles aligned with different investor appetites.
Disclaimer: Investment carries a risk of loss of initial capital. The past performance is not a reliable indicator of future results. Be sure to understand risks before making an investment decision.
Go Further
I encourage you to read the complete analyses of Fortive Corporation and Trimble Inc. to enhance your investment decisions: