Home > Comparison > Technology > TDY vs FTV
The strategic rivalry between Teledyne Technologies Incorporated and Fortive Corporation shapes the evolution of the technology hardware sector. Teledyne operates as a diversified industrial technology powerhouse, specializing in instrumentation and aerospace electronics. Fortive focuses on professional and engineered products with a strong emphasis on software-driven solutions and precision technologies. This comparison explores their contrasting growth strategies to identify which company offers a superior risk-adjusted return for a diversified portfolio in 2026.
Table of contents
Companies Overview
Teledyne Technologies and Fortive Corporation stand as pivotal players in the global hardware and equipment sector.
Teledyne Technologies Incorporated: Enabler of Industrial Precision
Teledyne dominates industrial growth markets through its Instrumentation, Digital Imaging, Aerospace, and Engineered Systems segments. It generates revenue by supplying advanced monitoring instruments, digital sensors, and defense electronics globally. In 2026, its strategic focus remains on expanding high-technology offerings in aerospace and defense while enhancing integrated system solutions for industrial clients.
Fortive Corporation: Provider of Intelligent Operational Tools
Fortive commands the market with its Intelligent Operating Solutions, Precision Technologies, and Advanced Healthcare Solutions segments. It earns from software, professional tools, and hardware servicing diverse industries like manufacturing, healthcare, and aerospace. Fortive’s 2026 strategy emphasizes connected reliability tools and subscription-based healthcare software to strengthen customer lifecycle management and compliance solutions.
Strategic Collision: Similarities & Divergences
Both companies excel in hardware and equipment but diverge in their business philosophies: Teledyne pursues a high-tech integrated systems model, while Fortive champions a software-enabled tools and services approach. Their primary battleground is industrial and aerospace sectors, competing on innovation and customer integration. This contrast highlights Teledyne’s capital-intensive, defense-centric profile against Fortive’s diversified, software-driven growth trajectory.
Income Statement Comparison
This data dissects the core profitability and scalability of both corporate engines to reveal who dominates the bottom line:
| Metric | Teledyne Technologies (TDY) | Fortive Corporation (FTV) |
|---|---|---|
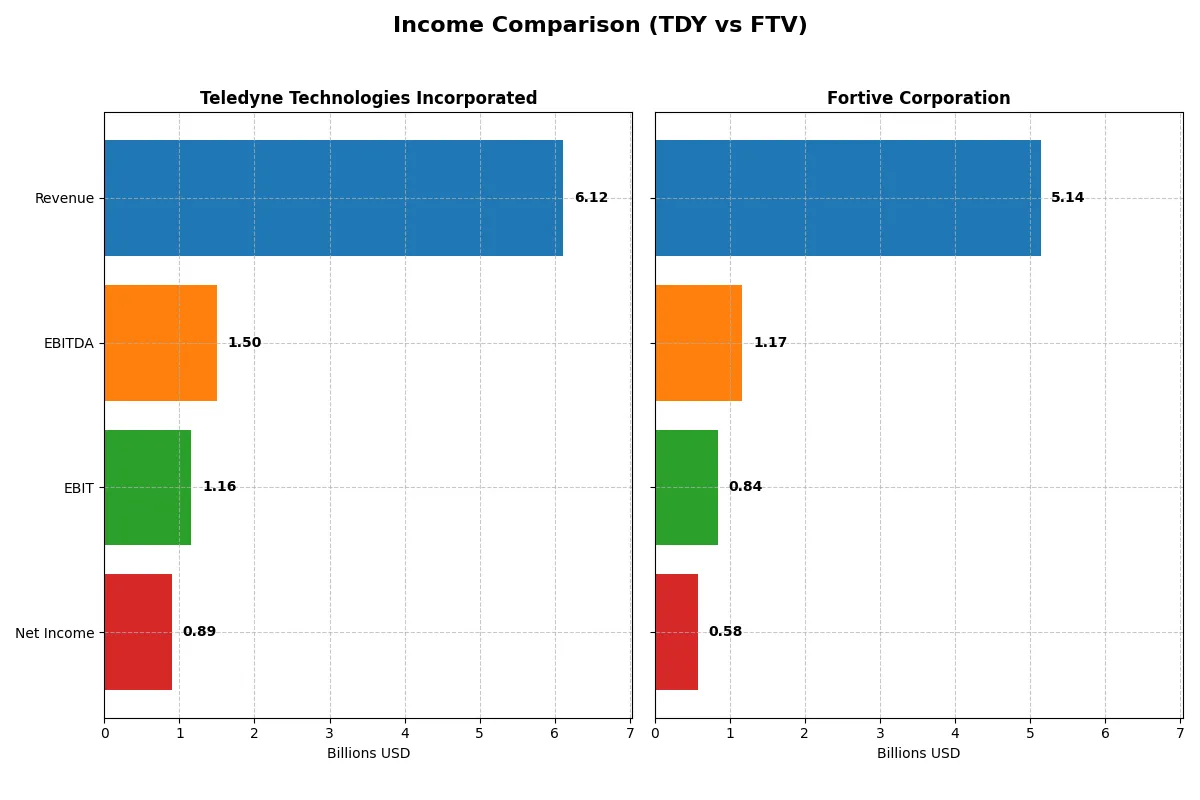
| Revenue | 6.12B | 5.14B |
| Cost of Revenue | 3.72B | 2.01B |
| Operating Expenses | 1.25B | 2.23B |
| Gross Profit | 2.40B | 3.13B |
| EBITDA | 1.50B | 1.17B |
| EBIT | 1.16B | 843M |
| Interest Expense | 60M | 121M |
| Net Income | 895M | 579M |
| EPS | 18.88 | 1.75 |
| Fiscal Year | 2025 | 2025 |
Income Statement Analysis: The Bottom-Line Duel
This income statement comparison reveals which company operates its business more efficiently and delivers stronger profitability in 2025.
Teledyne Technologies Incorporated Analysis
Teledyne’s revenue rose steadily to $6.1B in 2025, with net income reaching $895M, nearly doubling since 2021. Its gross margin remains healthy at 39.2%, while a net margin of 14.6% signals strong cost control. The 2025 EBIT growth of 16.6% highlights improving operational momentum and robust earnings quality.
Fortive Corporation Analysis
Fortive’s 2025 revenue declined 17.5% year-over-year to $5.1B, with net income falling to $579M. Despite a premium gross margin near 61%, its net margin shrunk to 11.3%, reflecting margin compression. The sharp drop in EBIT by 24.9% shows weakening profitability and operational challenges heading into 2026.
Verdict: Consistent Growth vs. Recent Decline
Teledyne demonstrates consistent revenue and profit growth with expanding margins, underscoring operational efficiency. Fortive’s higher gross margin is offset by recent declines in revenue, net income, and margins, indicating business headwinds. For investors prioritizing stability and margin expansion, Teledyne presents a fundamentally stronger profile.
Financial Ratios Comparison
These vital ratios act as a diagnostic tool to expose the underlying fiscal health, valuation premiums, and capital efficiency of the companies compared:
| Ratios | Teledyne Technologies (TDY) | Fortive Corporation (FTV) |
|---|---|---|
| ROE | 8.5% | 9.0% |
| ROIC | 6.8% | 7.4% |
| P/E | 27.3 | 30.2 |
| P/B | 2.33 | 2.71 |
| Current Ratio | 1.64 | 0.71 |
| Quick Ratio | 1.08 | 0.58 |
| D/E | 0.24 | 0.50 |
| Debt-to-Assets | 16.2% | 27.3% |
| Interest Coverage | 19.3 | 7.5 |
| Asset Turnover | 0.40 | 0.44 |
| Fixed Asset Turnover | 7.29 | 19.06 |
| Payout ratio | 0% | 16% |
| Dividend yield | 0% | 0.53% |
| Fiscal Year | 2025 | 2025 |
Efficiency & Valuation Duel: The Vital Signs
Financial ratios act as a company’s DNA, unveiling hidden risks and revealing operational efficiency critical for investment decisions.
Teledyne Technologies Incorporated
Teledyne posts a solid net margin of 14.63%, yet its ROE at 8.51% lags behind sector leaders, reflecting moderate profitability. The stock trades at a stretched P/E of 27.35, suggesting premium valuation. Teledyne refrains from dividends, focusing on reinvestment in R&D, aiming to fuel future growth despite mixed efficiency signals.
Fortive Corporation
Fortive’s net margin stands at a favorable 11.26%, with a slightly better ROE of 8.98%, indicating efficient capital use. However, its P/E ratio of 30.16 signals an expensive stock. The company pays a modest dividend yield of 0.53%, balancing shareholder returns with ongoing investments in innovation and operational improvements.
Premium Valuation vs. Operational Safety
Teledyne offers a more favorable liquidity profile and a disciplined reinvestment strategy but trades at a high valuation with muted ROE. Fortive, while expensive and less liquid, delivers slightly higher returns on equity and modest dividends. Risk-tolerant investors seeking growth may prefer Teledyne, while income-focused ones might lean toward Fortive’s dividend profile.
Which one offers the Superior Shareholder Reward?
I see Teledyne Technologies Incorporated (TDY) opts for zero dividends but aggressively reinvests free cash flow, boasting a payout ratio of 0%. Fortive Corporation (FTV) pays a modest 0.53% dividend yield with a 13-16% payout ratio. Both sustain solid buyback programs, but TDY’s free cash flow per share of 23.7 versus FTV’s 4.0 signals greater reinvestment capacity. FTV’s lower current ratio (0.71) flags liquidity risk, while TDY’s 1.64 offers comfort. Historically, TDY’s zero-dividend, high-reinvestment model better suits long-term value. I conclude TDY delivers a superior total return profile for 2026, driven by sustainable capital allocation and stronger balance sheet health.
Comparative Score Analysis: The Strategic Profile
The radar chart reveals the fundamental DNA and trade-offs of Teledyne Technologies and Fortive Corporation, outlining their core financial strengths and vulnerabilities:
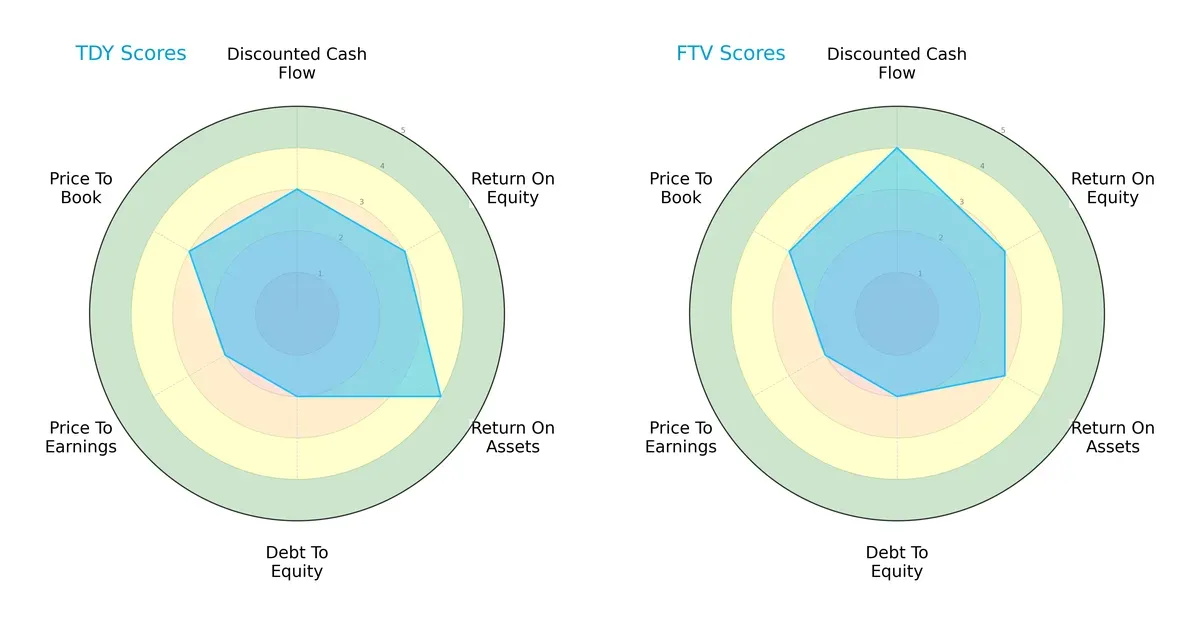
Teledyne exhibits a stronger return on assets (score 4) than Fortive (score 3), signaling more efficient asset utilization. Fortive leads slightly on discounted cash flow (score 4 vs. 3), indicating better cash flow valuation. Both firms share moderate scores in return on equity (3) and price-to-book (3), while each struggles with debt-to-equity and price-to-earnings (both scoring 2). Teledyne’s profile leans on operational efficiency, whereas Fortive leans on future cash flow strength. Overall, their financial profiles balance out closely.
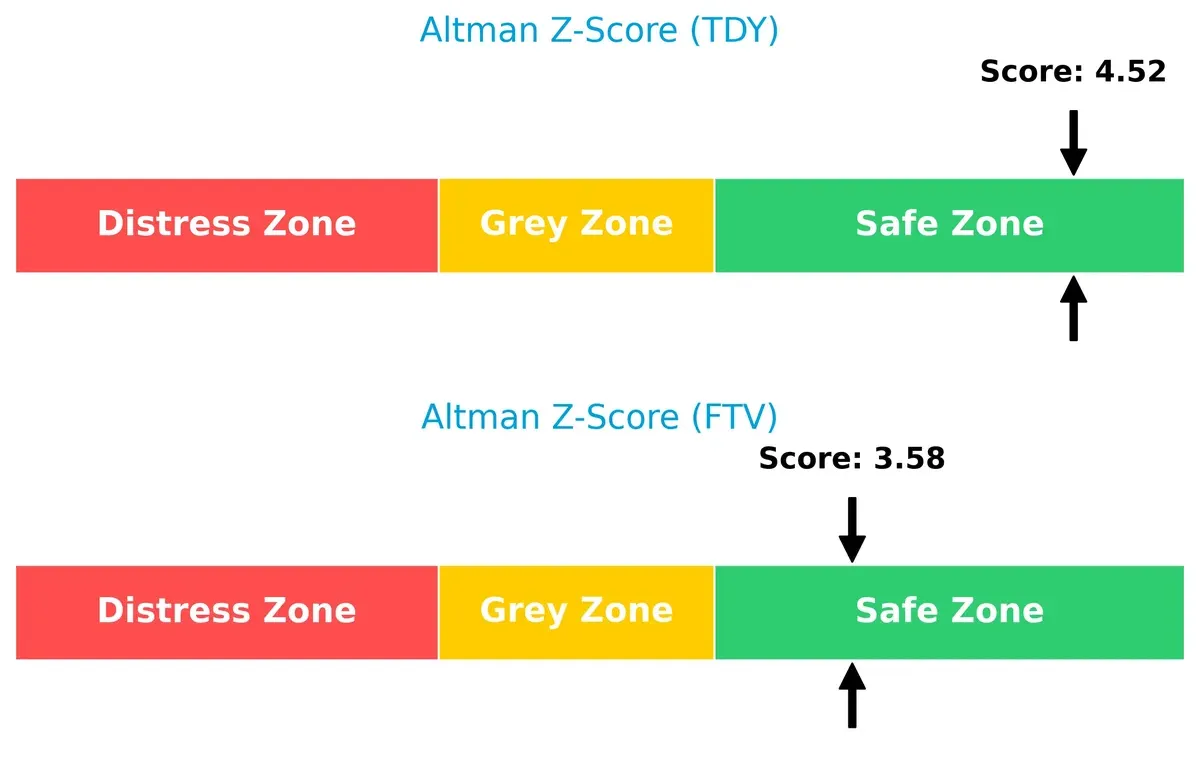
Bankruptcy Risk: Solvency Showdown
Teledyne’s Altman Z-Score of 4.52 surpasses Fortive’s 3.58, both safely above the distress threshold, but Teledyne’s higher score signals superior long-term solvency in this cyclical environment:
Financial Health: Quality of Operations
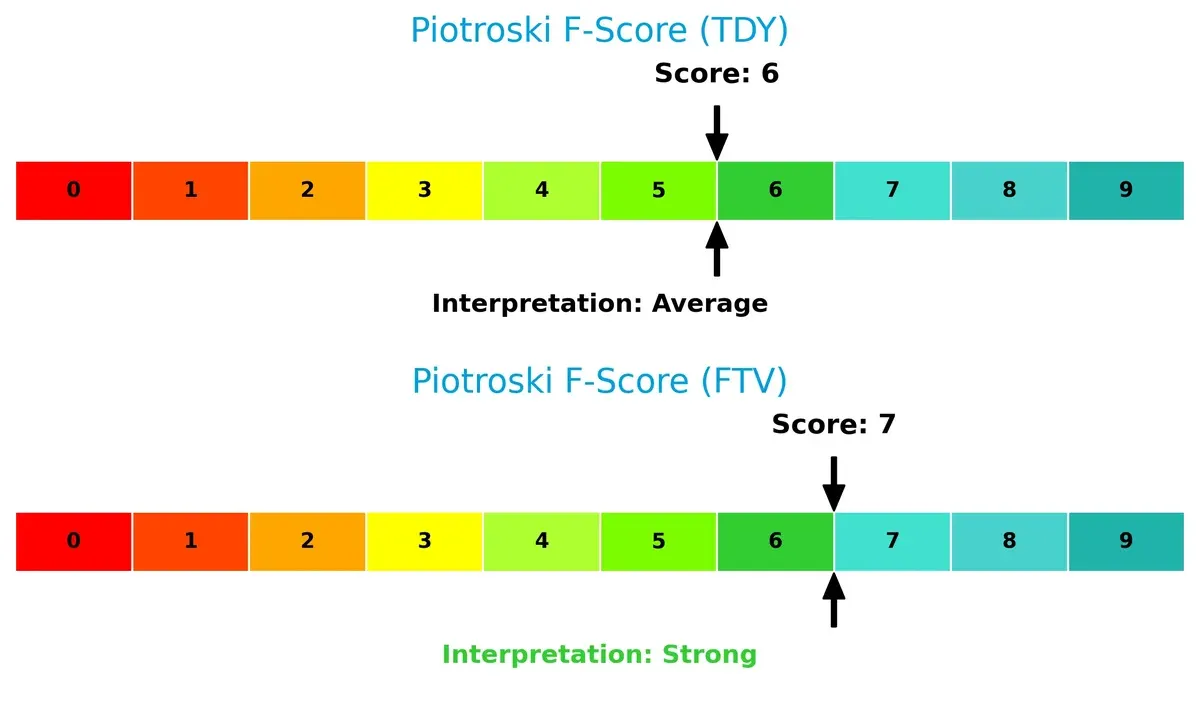
Fortive’s Piotroski F-Score of 7 edges out Teledyne’s 6, marking Fortive as financially stronger with fewer red flags. Both companies are healthy, but Fortive’s internal metrics suggest a more robust operational position:
How are the two companies positioned?
This section dissects the operational DNA of TDY and FTV by comparing their revenue distribution by segment and internal dynamics. The goal is to confront their economic moats and identify which model offers the most resilient competitive advantage today.
Revenue Segmentation: The Strategic Mix
The following comparison dissects how Teledyne Technologies and Fortive diversify their income streams and where their primary sector bets lie:
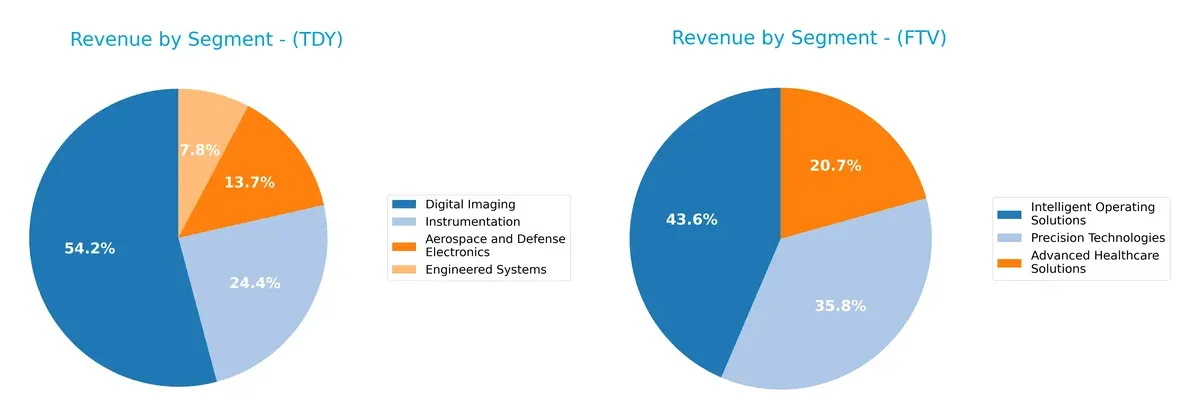
Teledyne’s revenue pivots strongly on Digital Imaging at $3.07B, dwarfing its other segments and signaling reliance on a core technology platform. Fortive showcases a more balanced portfolio, with Intelligent Operating Solutions at $2.71B and Precision Technologies close behind at $2.23B. This spread reduces concentration risk and reflects Fortive’s ecosystem lock-in strategy, while Teledyne’s focus risks cyclical vulnerability despite its infrastructure dominance.
Strengths and Weaknesses Comparison
This table compares the strengths and weaknesses of Teledyne Technologies Incorporated and Fortive Corporation:
Teledyne Technologies Strengths
- Diversified revenue across Aerospace, Imaging, Systems, Instrumentation
- Favorable net margin at 14.63%
- Strong liquidity with current ratio 1.64 and quick ratio 1.08
- Low debt-to-assets at 16.19% and high interest coverage of 19.47
- Solid fixed asset turnover at 7.29
Fortive Strengths
- Revenue spread across Healthcare, Operating Solutions, Precision Tech
- Favorable net margin at 11.26%
- Favorable WACC at 7.86% and reasonable debt-to-assets 27.31%
- Good interest coverage ratio of 7.0
- High fixed asset turnover of 19.06
Teledyne Technologies Weaknesses
- ROE of 8.51% below WACC of 8.15%, indicating weak capital returns
- Unfavorable PE ratio at 27.35
- Asset turnover low at 0.4, below industry norms
- No dividend yield, possibly limiting income investors
- Some neutral to unfavorable financial ratios total 50%
Fortive Weaknesses
- ROE of 8.98% still below WACC of 7.86%, marginally weak capital returns
- Higher PE ratio at 30.16 indicating rich valuation
- Poor liquidity with current ratio 0.71 and quick ratio 0.58
- Dividend yield low at 0.53%, below sector average
- Asset turnover also low at 0.44
Teledyne shows strong liquidity and conservative leverage but struggles with capital efficiency and valuation. Fortive presents solid profitability and asset utilization but faces liquidity constraints and higher valuation risks. Both companies must manage these financial trade-offs to support sustainable growth.
The Moat Duel: Analyzing Competitive Defensibility
A structural moat is the only true shield preserving long-term profits from relentless competition and market pressures:
Teledyne Technologies Incorporated: Diversified Tech Integration Moat
Teledyne’s moat stems from its integrated technology portfolio across aerospace, defense, and imaging. This diversification supports stable margins and improving ROIC, despite slight value erosion. Expansion into space and defense markets could deepen its moat by 2026.
Fortive Corporation: Industrial Software & Services Network Moat
Fortive leverages a network of software and industrial tools brands, creating switching costs. Unlike Teledyne, it shows higher gross margins but recent revenue declines weaken the moat. Growth in connected reliability and healthcare software could reverse this trend.
Verdict: Technology Integration vs. Networked Industrial Solutions
Teledyne’s broader diversification offers a more resilient, expanding moat despite current slight value erosion. Fortive’s moat is narrower and pressured by declining revenue, making Teledyne better equipped to defend market share long term.
Which stock offers better returns?
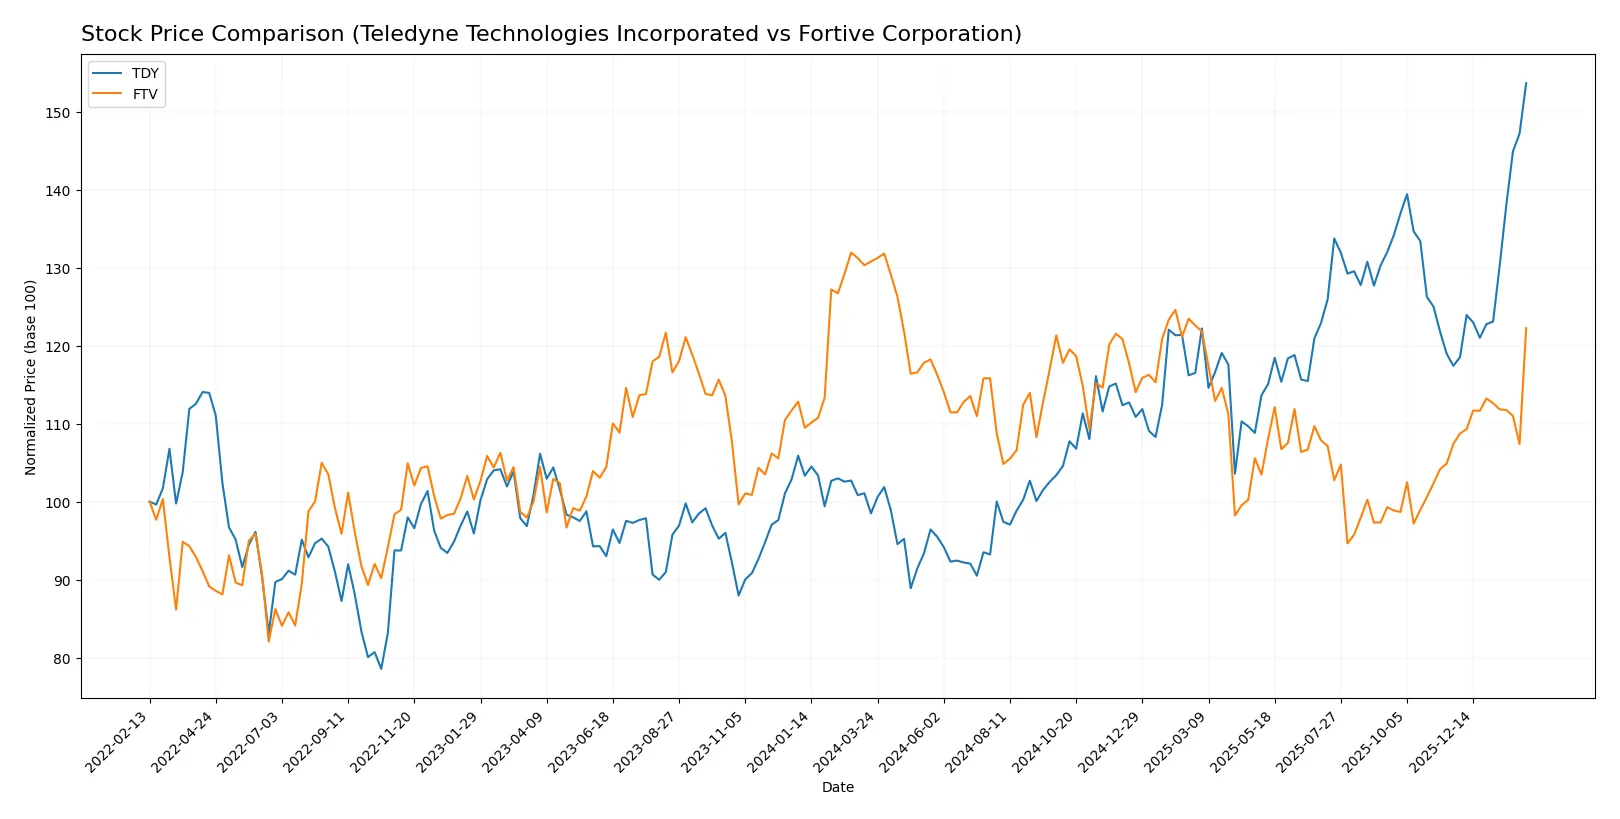
The past year shows Teledyne Technologies with a strong upward move and accelerating gains, while Fortive struggles under a steady decline with milder recent recovery.
Trend Comparison
Teledyne Technologies’ stock gained 56% over the past year, marking a bullish trend with accelerating momentum and a wide price range between 375 and 648. Fortive’s stock fell 6.5%, reflecting a bearish trend despite acceleration and a tighter price range between 47 and 65. Teledyne outperformed Fortive with a sharply bullish trend versus Fortive’s modest recovery from a larger decline.
Target Prices
Analysts present a balanced target price range with moderate upside potential for both Teledyne Technologies and Fortive.
| Company | Target Low | Target High | Consensus |
|---|---|---|---|
| Teledyne Technologies Incorporated | 599 | 720 | 638.5 |
| Fortive Corporation | 51 | 70 | 61 |
Teledyne’s consensus target sits slightly below its current price of $647.56, indicating cautious optimism. Fortive’s consensus aligns closely with its $60.12 market price, suggesting limited near-term price movement.

Don’t Let Luck Decide Your Entry Point
Optimize your entry points with our advanced ProRealTime indicators. You’ll get efficient buy signals with precise price targets for maximum performance. Start outperforming now!
How do institutions grade them?
Here is a comparison of recent institutional grades for Teledyne Technologies Incorporated and Fortive Corporation:
Teledyne Technologies Incorporated Grades
The following table summarizes institutional grades for Teledyne Technologies Incorporated over the past year.
| Grading Company | Action | New Grade | Date |
|---|---|---|---|
| Barclays | Maintain | Equal Weight | 2026-01-22 |
| Stifel | Maintain | Buy | 2026-01-22 |
| Needham | Maintain | Buy | 2026-01-22 |
| Citigroup | Maintain | Neutral | 2026-01-13 |
| Barclays | Maintain | Equal Weight | 2026-01-12 |
| Barclays | Maintain | Equal Weight | 2025-10-23 |
| Needham | Maintain | Buy | 2025-10-23 |
| Stifel | Maintain | Buy | 2025-10-23 |
| Morgan Stanley | Maintain | Equal Weight | 2025-10-15 |
| UBS | Maintain | Buy | 2025-07-24 |
Fortive Corporation Grades
The following table summarizes institutional grades for Fortive Corporation over the past year.
| Grading Company | Action | New Grade | Date |
|---|---|---|---|
| Wells Fargo | Maintain | Equal Weight | 2026-02-05 |
| RBC Capital | Maintain | Sector Perform | 2026-02-05 |
| Citigroup | Maintain | Neutral | 2026-02-05 |
| JP Morgan | Downgrade | Underweight | 2026-01-16 |
| Mizuho | Downgrade | Underperform | 2026-01-05 |
| Wells Fargo | Maintain | Equal Weight | 2025-12-22 |
| Citigroup | Maintain | Neutral | 2025-12-08 |
| Morgan Stanley | Maintain | Equal Weight | 2025-11-05 |
| Baird | Maintain | Outperform | 2025-11-04 |
| JP Morgan | Maintain | Neutral | 2025-10-30 |
Which company has the best grades?
Teledyne Technologies enjoys more Buy ratings and consistently maintains positive grades. Fortive shows mixed ratings, including downgrades to Underweight and Underperform. Investors may see Teledyne as currently favored by analysts.
Risks specific to each company
The following categories identify the critical pressure points and systemic threats facing both firms in the 2026 market environment:
1. Market & Competition
Teledyne Technologies Incorporated
- Faces pressure from industrial tech rivals with higher asset turnover challenges.
Fortive Corporation
- Competes across diverse industrial segments, balancing innovation and market share retention.
2. Capital Structure & Debt
Teledyne Technologies Incorporated
- Maintains low debt-to-equity (0.24) and strong interest coverage (19.47), signaling financial stability.
Fortive Corporation
- Higher leverage (debt-to-equity 0.5) and lower interest coverage (7.0) raise financial risk concerns.
3. Stock Volatility
Teledyne Technologies Incorporated
- Beta near 1.01 implies market-level volatility; price range shows recent strong performance.
Fortive Corporation
- Beta slightly higher at 1.03, but wider volume swings increase short-term volatility risk.
4. Regulatory & Legal
Teledyne Technologies Incorporated
- Exposure to defense and aerospace sectors implies regulatory scrutiny and compliance costs.
Fortive Corporation
- Diverse industrial and healthcare products face evolving regulatory landscapes, increasing compliance complexity.
5. Supply Chain & Operations
Teledyne Technologies Incorporated
- Moderate asset turnover (0.4) suggests operational efficiency improvements are needed.
Fortive Corporation
- Slightly better asset turnover (0.44) but challenged by supply chain complexity across multiple verticals.
6. ESG & Climate Transition
Teledyne Technologies Incorporated
- Industrial focus requires proactive climate strategy amid tightening environmental standards.
Fortive Corporation
- Broad exposure to healthcare and industrial sectors necessitates robust ESG initiatives to meet stakeholder demands.
7. Geopolitical Exposure
Teledyne Technologies Incorporated
- Significant defense and aerospace contracts expose TDY to geopolitical tensions and budget shifts.
Fortive Corporation
- Global operations across sensitive markets carry risks from trade policies and regional instability.
Which company shows a better risk-adjusted profile?
Teledyne’s strongest risk is its moderate profitability efficiency and sector-specific regulatory pressure. Fortive’s greatest risk lies in its weaker liquidity ratios and higher leverage. Teledyne’s lower debt burden and superior interest coverage give it a more resilient risk-adjusted profile. The recent widening gap in liquidity metrics highlights Fortive’s vulnerability to financial stress in volatile markets.
Final Verdict: Which stock to choose?
Teledyne Technologies Incorporated’s superpower lies in its consistent improvement in profitability paired with a robust cash flow generation engine. I see its slightly unfavorable ROIC versus WACC as a point of vigilance, signaling value destruction despite growing profitability. It suits investors with an appetite for aggressive growth seeking operational leverage.
Fortive Corporation’s strategic moat is its operational efficiency and recurring revenue streams, which provide a safety buffer against economic swings. While it lags Teledyne in recent momentum, its strong cash flow yield and higher Piotroski score offer relative stability. It fits well within a GARP (Growth at a Reasonable Price) portfolio focused on balanced risk and reward.
If you prioritize dynamic growth and are comfortable navigating some capital efficiency risks, Teledyne outshines with its accelerating earnings and bullish price action. However, if you seek better stability and a steadier cash flow profile, Fortive offers a more conservative scenario despite recent revenue headwinds. Both companies present analytical scenarios worth considering based on your risk tolerance and investment horizon.
Disclaimer: Investment carries a risk of loss of initial capital. The past performance is not a reliable indicator of future results. Be sure to understand risks before making an investment decision.
Go Further
I encourage you to read the complete analyses of Teledyne Technologies Incorporated and Fortive Corporation to enhance your investment decisions: