Home > Comparison > Technology > TEL vs FTV
The strategic rivalry between TE Connectivity Ltd. and Fortive Corporation shapes the hardware, equipment, and parts industry within the technology sector. TE Connectivity operates as a global connectivity and sensor solutions manufacturer with a capital-intensive model. Fortive, by contrast, focuses on professional engineered products and software, blending hardware with service-oriented solutions. This analysis assesses which company’s operational model delivers the superior risk-adjusted return for a diversified portfolio in today’s competitive landscape.
Table of contents
Companies Overview
TE Connectivity Ltd. and Fortive Corporation stand as key players in the hardware and equipment sector, each commanding significant market influence.
TE Connectivity Ltd.: Global Connectivity Innovator
TE Connectivity Ltd. dominates the connectivity and sensor solutions market globally. Its core revenue stems from manufacturing terminals, connector systems, sensors, and related components across transportation, industrial, and communications sectors. In 2026, the company strategically focuses on expanding its product reach in automotive and industrial markets, leveraging its broad geographic footprint across 140 countries.
Fortive Corporation: Precision Technology Leader
Fortive Corporation excels in delivering professional and engineered products alongside software solutions. Its revenue engine thrives on intelligent operating tools, calibration devices, and healthcare hardware, targeting diverse verticals like manufacturing, healthcare, and aerospace. In 2026, Fortive sharpens its strategic emphasis on integrated software and hardware solutions to enhance operational reliability and asset lifecycle management.
Strategic Collision: Similarities & Divergences
Both companies operate in hardware and equipment markets but diverge in scope and approach. TE Connectivity emphasizes broad-based hardware components with a global sales network, while Fortive integrates software with precision tools for niche industrial and healthcare markets. The primary battleground lies in their ability to innovate connectivity versus integrated operational solutions. Their investment profiles reflect this: TE Connectivity as a global hardware stalwart, Fortive as a software-driven industrial innovator.
Income Statement Comparison
This data dissects the core profitability and scalability of both corporate engines to reveal who dominates the bottom line:
| Metric | TE Connectivity Ltd. (TEL) | Fortive Corporation (FTV) |
|---|---|---|
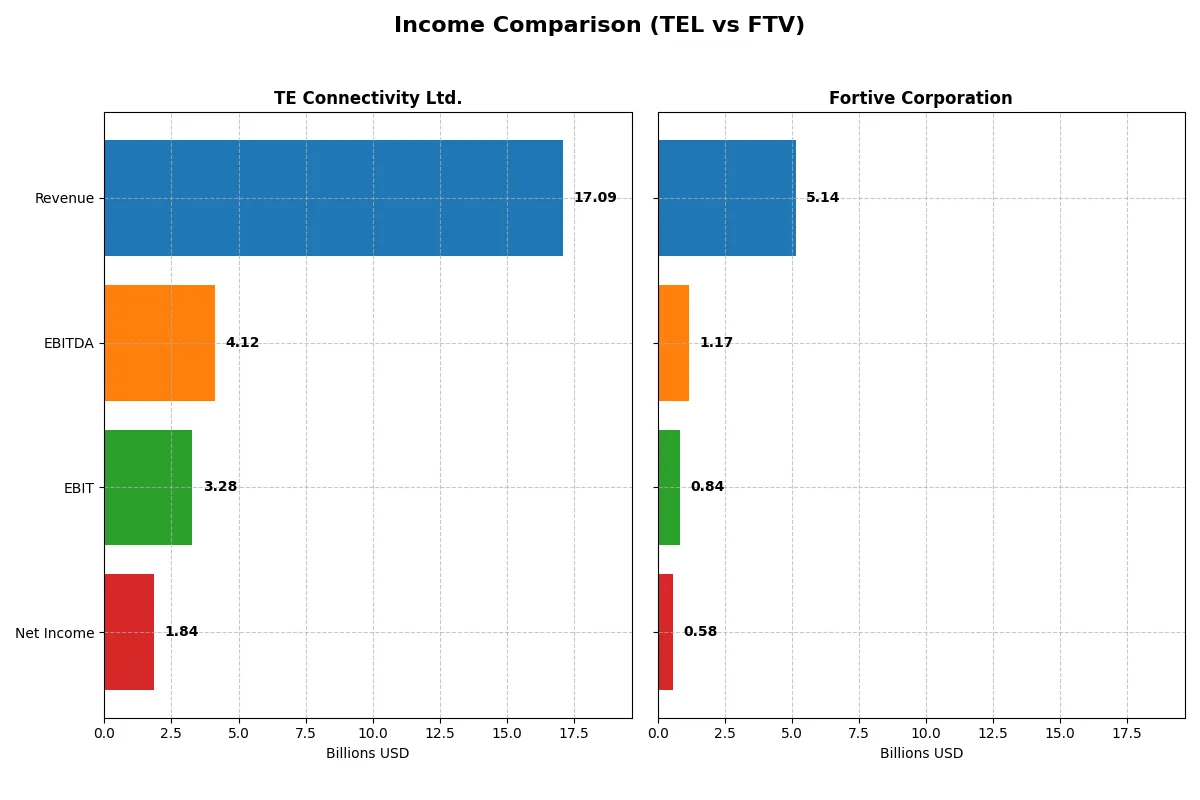
| Revenue | 17B | 5.14B |
| Cost of Revenue | 11.18B | 2.01B |
| Operating Expenses | 2.7B | 2.23B |
| Gross Profit | 5.91B | 3.13B |
| EBITDA | 4.12B | 1.17B |
| EBIT | 3.28B | 843M |
| Interest Expense | 77M | 121M |
| Net Income | 1.84B | 579M |
| EPS | 6.2 | 1.75 |
| Fiscal Year | 2025 | 2025 |
Income Statement Analysis: The Bottom-Line Duel
The income statement comparison reveals which company leverages its revenue into efficient profits and sustainable margins more effectively.
TE Connectivity Ltd. Analysis
TE Connectivity’s revenue grew steadily to $17.1B in 2025, with net income at $1.84B. Its gross margin remains healthy at 34.6%, and EBIT margin stands at a robust 19.2%. Despite a 7.9% revenue rise last year, net margin slid nearly 47%, signaling recent margin pressure despite solid operational gains.
Fortive Corporation Analysis
Fortive reported $5.14B revenue in 2025, down 17.5% year-over-year, with net income shrinking to $579M. However, it maintains a superior gross margin of 61% and a net margin of 11.3%. The decline in revenue and EBIT by roughly 25% reflects a challenging environment, yet margin resilience points to operational discipline.
Margin Strength vs. Revenue Momentum
TE Connectivity delivers stronger revenue growth and operational expansion but suffers margin contraction, while Fortive shows margin superiority amid declining sales. TE’s scale and recent revenue momentum suggest growth potential, but Fortive’s higher margins appeal for those valuing profitability stability amid volatility.
Financial Ratios Comparison
These vital ratios act as a diagnostic tool to expose the underlying fiscal health, valuation premiums, and capital efficiency of the companies compared below:
| Ratios | TE Connectivity Ltd. (TEL) | Fortive Corporation (FTV) |
|---|---|---|
| ROE | 14.64% | 8.98% |
| ROIC | 8.82% | 7.44% |
| P/E | 35.0 | 30.2 |
| P/B | 5.12 | 2.71 |
| Current Ratio | 1.56 | 0.71 |
| Quick Ratio | 1.03 | 0.58 |
| D/E | 0.52 | 0.50 |
| Debt-to-Assets | 26.1% | 27.3% |
| Interest Coverage | 41.7 | 7.54 |
| Asset Turnover | 0.68 | 0.44 |
| Fixed Asset Turnover | 3.96 | 19.06 |
| Payout ratio | 43.6% | 15.9% |
| Dividend yield | 1.25% | 0.53% |
| Fiscal Year | 2025 | 2025 |
Efficiency & Valuation Duel: The Vital Signs
Financial ratios serve as a company’s DNA, revealing hidden risks and operational strengths that define its market standing and future prospects.
TE Connectivity Ltd.
TE Connectivity shows a solid net margin of 10.78%, signaling efficient core profitability. Its ROE and ROIC are neutral relative to its 9% WACC, suggesting stable capital returns. However, the stock appears expensive with a P/E of 35 and P/B of 5.12. TE Connectivity offers a moderate 1.25% dividend yield, balancing shareholder returns with reinvestment in R&D at 4.85% of revenue.
Fortive Corporation
Fortive posts a slightly higher net margin of 11.26% but suffers from a weaker ROE of 8.98%, below its WACC of 7.86%. Its valuation is less stretched with a P/E of 30.16 and P/B of 2.71, though liquidity ratios flag caution. Fortive’s dividend yield is low at 0.53%, reflecting a focus on reinvestment in R&D at 6.66% of revenue to drive growth.
Premium Valuation vs. Operational Safety
TE Connectivity presents a more balanced operational profile with favorable liquidity and shareholder returns despite its premium valuation. Fortive offers slightly better margins but weaker ROE and liquidity, indicating higher risk. Investors prioritizing stable dividends and operational safety lean toward TE; growth-focused investors may consider Fortive’s reinvestment strategy despite financial caution.
Which one offers the Superior Shareholder Reward?
I compare TE Connectivity Ltd. (TEL) and Fortive Corporation (FTV) focusing on dividends, payout ratios, and buybacks. TEL offers a 1.25% dividend yield, with a 44% payout ratio and strong free cash flow coverage, signaling a sustainable dividend. TEL also backs this with sizable buybacks, enhancing total returns. Conversely, FTV yields only 0.53%, with a modest 16% payout ratio but retains more cash for growth and acquisitions. Its buyback program, while active, is less aggressive than TEL’s. Historically, TEL’s balanced distribution between dividends and buybacks offers a more robust, sustainable shareholder reward in 2026. I conclude TEL provides the more attractive total return profile amid current market conditions.
Comparative Score Analysis: The Strategic Profile
The radar chart reveals the fundamental DNA and trade-offs of TE Connectivity and Fortive Corporation, highlighting their financial strengths and valuation nuances:
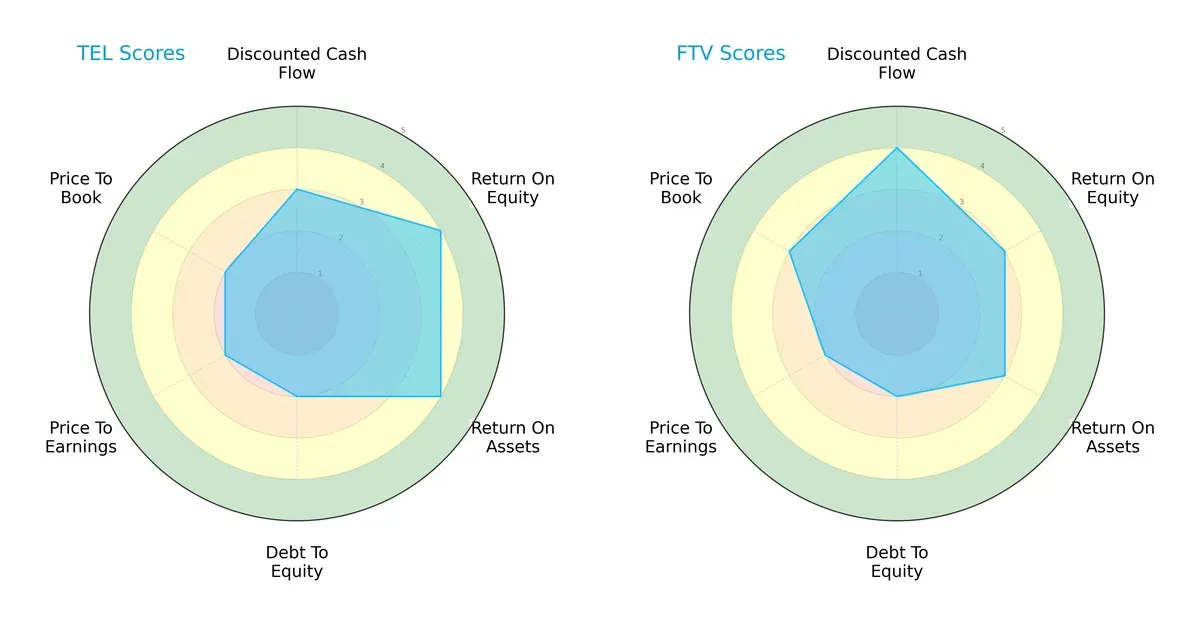
TE Connectivity excels in profitability metrics with stronger ROE (4) and ROA (4) scores, indicating efficient capital and asset utilization. Fortive leads slightly in discounted cash flow (4) and price-to-book (3) scores, reflecting a more favorable valuation perspective. Both companies show vulnerability in debt-to-equity (2) and price-to-earnings (2) scores, signaling balance sheet leverage and valuation concerns. TE Connectivity presents a more balanced profitability profile, while Fortive leans on valuation advantages amid similar overall moderate ratings.
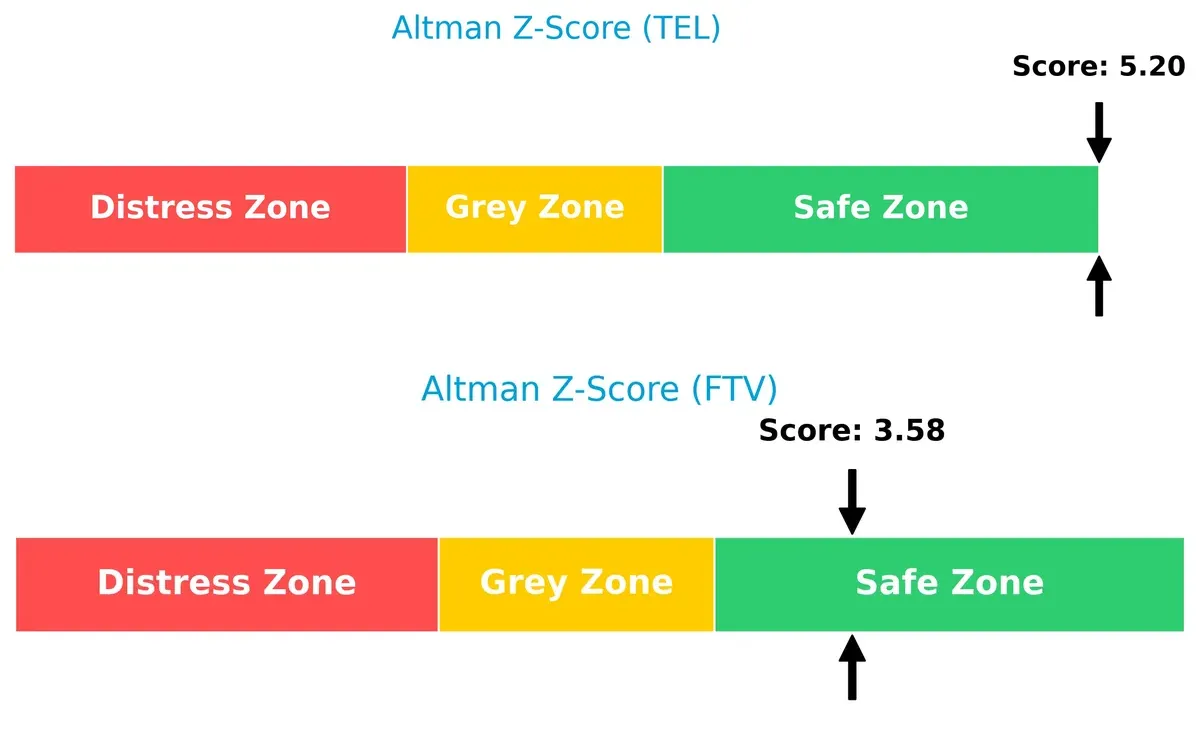
Bankruptcy Risk: Solvency Showdown
TE Connectivity’s Altman Z-Score of 5.20 versus Fortive’s 3.58 places both firmly in the safe zone, but TE Connectivity shows superior financial resilience for long-term survival in this cycle:
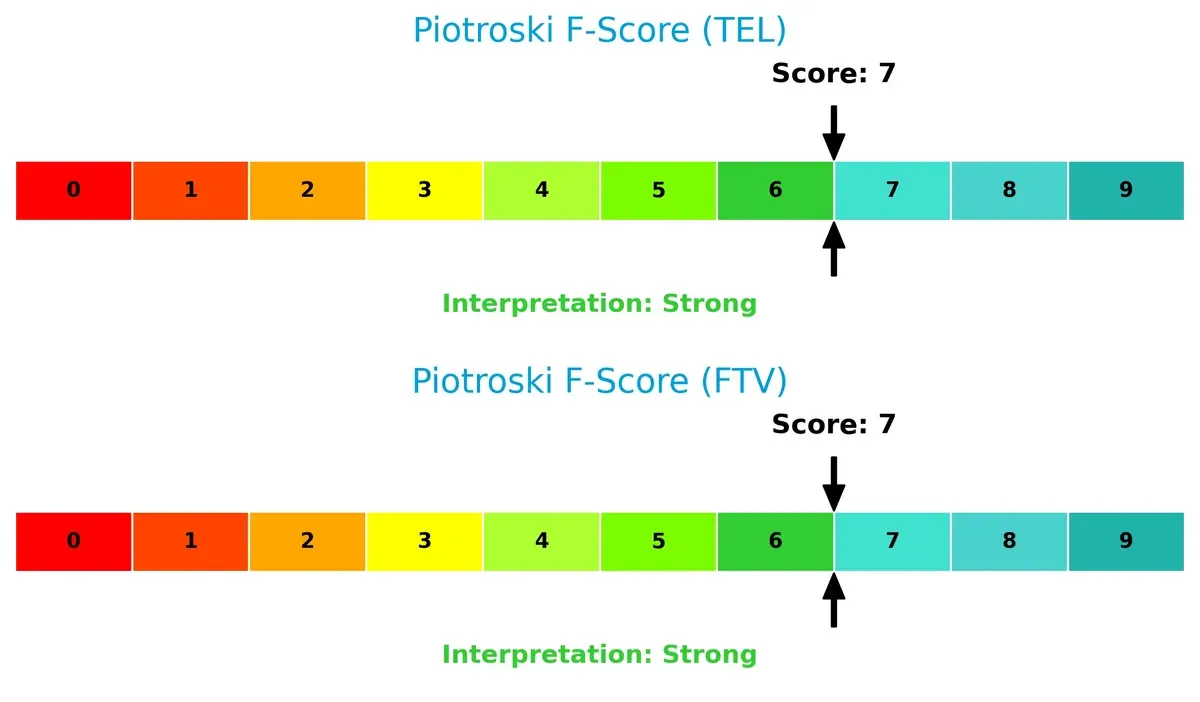
Financial Health: Quality of Operations
Both TE Connectivity and Fortive score a strong 7 on the Piotroski F-Score, indicating robust internal financial health and operational quality without immediate red flags:
How are the two companies positioned?
This section dissects TEL and FTV’s operational DNA by comparing revenue distribution and internal dynamics, including strengths and weaknesses. The goal is to confront their economic moats and identify which model offers the most resilient competitive advantage today.
Revenue Segmentation: The Strategic Mix
This visual comparison dissects how TE Connectivity Ltd. and Fortive Corporation diversify their income streams and where their primary sector bets lie:
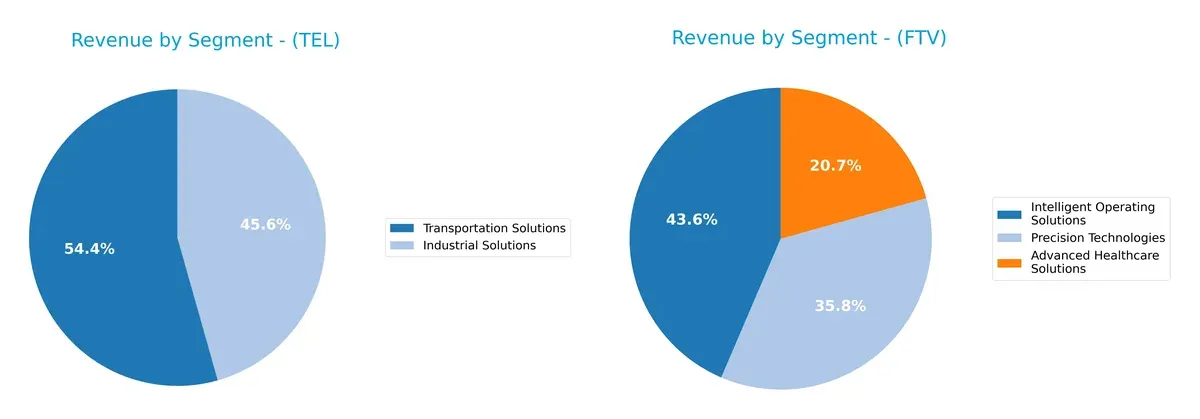
TE Connectivity anchors its revenue in Transportation Solutions at $9.4B, complemented by $7.9B from Industrial Solutions, showing a focused, two-segment model. Fortive spreads risk across Intelligent Operating Solutions ($2.7B), Precision Technologies ($2.2B), and Advanced Healthcare Solutions ($1.3B), reflecting broader diversification. TE’s concentration pivots on infrastructure dominance in transportation, while Fortive’s mix signals resilience through innovation-driven segments. Concentration risk is higher for TE, but it benefits from ecosystem lock-in.
Strengths and Weaknesses Comparison
This table compares the strengths and weaknesses of TE Connectivity Ltd. (TEL) and Fortive Corporation (FTV):
TEL Strengths
- Strong diversification across Industrial and Transportation Solutions
- Favorable net margin at 10.78%
- High interest coverage at 42.61
- Favorable current and quick ratios indicating liquidity
- Robust fixed asset turnover at 3.96
- Balanced global presence with significant revenue from China and US
FTV Strengths
- Favorable net margin at 11.26%
- Lower WACC at 7.86% supporting efficient capital allocation
- Favorable debt-to-equity and debt-to-assets ratios
- High fixed asset turnover at 19.06
- Diversified revenue streams in Healthcare, Operating Solutions, and Precision Technologies
- Strong US and international market presence
TEL Weaknesses
- Unfavorable valuation metrics (PE 35.0, PB 5.12) suggesting overvaluation risk
- Neutral ROIC below WACC at 8.82% vs. 9%
- Neutral ROE at 14.64% indicating moderate profitability
- Asset turnover moderate at 0.68
- Less favorable price multiples may limit upside
FTV Weaknesses
- Unfavorable liquidity ratios (current 0.71, quick 0.58) signaling potential short-term risk
- Unfavorable ROE at 8.98%, below sector average
- Higher proportion of unfavorable ratios (42.86%)
- Lower asset turnover at 0.44
- Dividend yield low at 0.53%
Both companies demonstrate solid profitability and diversified revenue streams with global reach. TEL shows stronger liquidity and interest coverage, while FTV benefits from a lower cost of capital and efficient fixed asset use. Valuation and liquidity metrics highlight key risks for investors to monitor.
The Moat Duel: Analyzing Competitive Defensibility
A structural moat alone protects long-term profits from competition’s relentless erosion. Let’s dissect the moats of TE Connectivity and Fortive Corporation:
TE Connectivity Ltd.: Intangible Assets and Scale Moat
TE Connectivity leverages extensive intangible assets and global scale, reflected in stable gross margins near 35%. However, declining ROIC signals weakening capital efficiency in 2026.
Fortive Corporation: Operational Efficiency and Emerging Profitability
Fortive’s moat stems from operational efficiency and diverse brands, shown in high gross margins above 60%. Although currently shedding value, its rising ROIC trend suggests improving competitive strength.
Moat Resilience: Intangible Assets vs. Operational Momentum
TE Connectivity’s wider moat rests on scale and product breadth, but deteriorating ROIC threatens sustainability. Fortive’s narrower moat shows promise with a growing ROIC trajectory, better positioning it to defend market share.
Which stock offers better returns?
Over the past 12 months, TE Connectivity Ltd. surged over 55%, showing a strong but decelerating uptrend. Fortive Corporation declined 6.5% overall, despite recent signs of upward momentum.
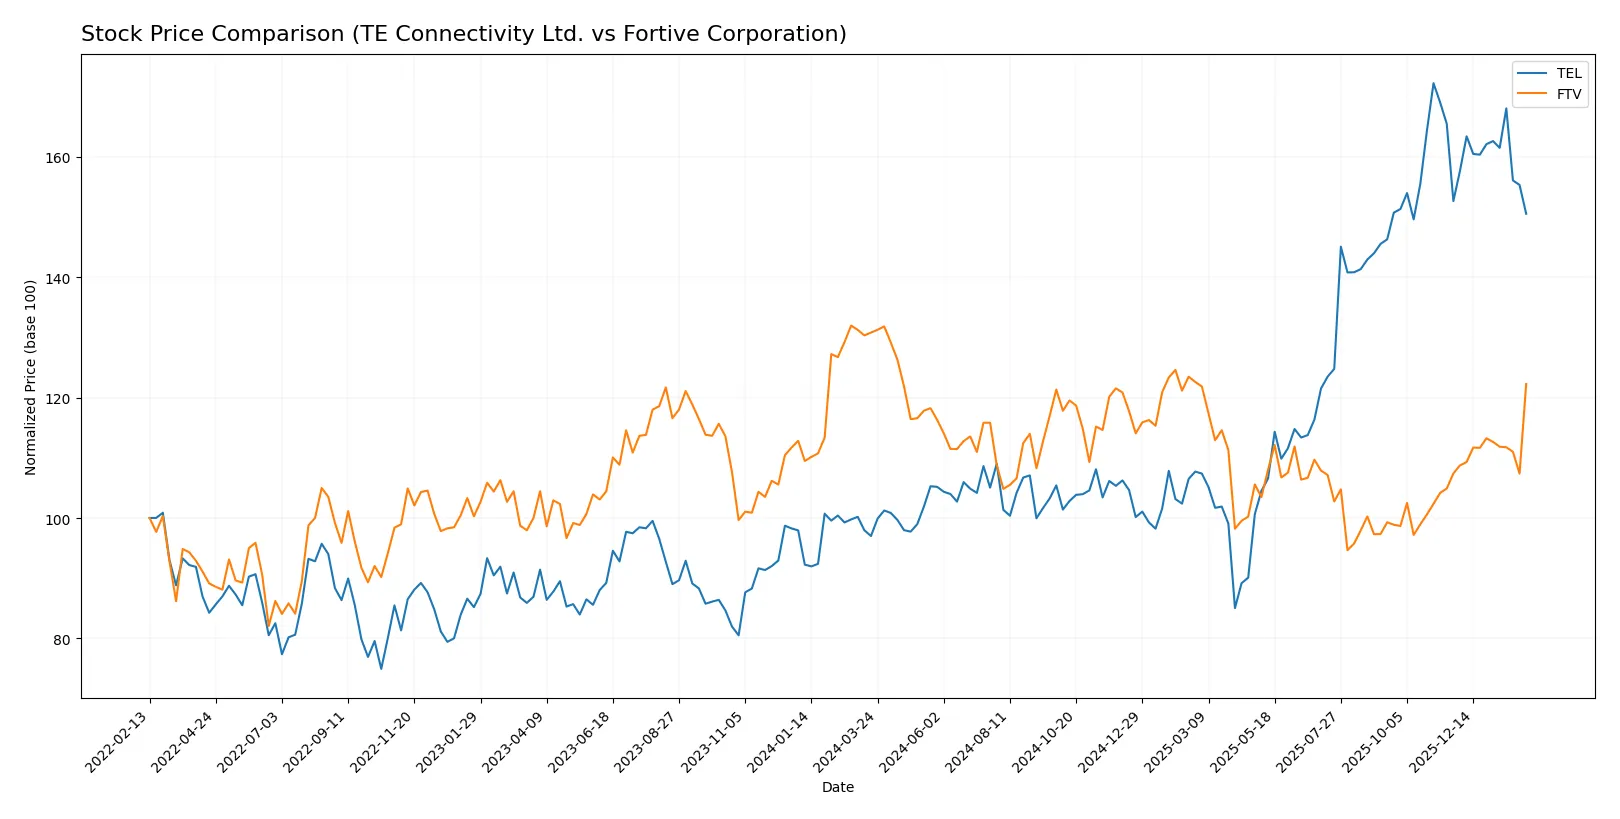
Trend Comparison
TE Connectivity’s stock rose 55.15% over the past year, confirming a bullish trend with decelerating gains. Volatility is high, with a standard deviation of 34.41 and price ranging between 122.0 and 247.01.
Fortive’s stock fell 6.53% in the same period, marking a bearish trend but accelerating downside. Recent months show a 13.82% rebound, indicating a short-term positive shift with low volatility at 4.16.
TE Connectivity outperformed Fortive over the last year, delivering the highest market return despite recent slight weakness. Fortive’s recent gains have yet to offset its annual decline.
Target Prices
Analysts present a bullish consensus for TE Connectivity Ltd. and Fortive Corporation.
| Company | Target Low | Target High | Consensus |
|---|---|---|---|
| TE Connectivity Ltd. | 238 | 306 | 270.29 |
| Fortive Corporation | 51 | 70 | 61 |
TE Connectivity’s target consensus at 270.29 implies a substantial upside versus the current 215.91 price. Fortive’s consensus of 61 aligns closely with its 60.12 market price, suggesting limited near-term price movement.

Don’t Let Luck Decide Your Entry Point
Optimize your entry points with our advanced ProRealTime indicators. You’ll get efficient buy signals with precise price targets for maximum performance. Start outperforming now!
How do institutions grade them?
Here is a comparison of recent institutional grades for TE Connectivity Ltd. and Fortive Corporation:
TE Connectivity Ltd. Grades
The following table lists recent grades from major financial institutions for TE Connectivity Ltd.:
| Grading Company | Action | New Grade | Date |
|---|---|---|---|
| Oppenheimer | Upgrade | Outperform | 2026-01-27 |
| Barclays | Maintain | Overweight | 2026-01-23 |
| Wells Fargo | Maintain | Equal Weight | 2026-01-22 |
| Truist Securities | Maintain | Hold | 2026-01-22 |
| UBS | Maintain | Buy | 2026-01-14 |
| Truist Securities | Maintain | Hold | 2025-12-19 |
| Wells Fargo | Maintain | Equal Weight | 2025-12-09 |
| Barclays | Maintain | Overweight | 2025-11-21 |
| Truist Securities | Maintain | Hold | 2025-11-21 |
| TD Cowen | Maintain | Buy | 2025-11-17 |
Fortive Corporation Grades
Below are recent institutional grades for Fortive Corporation from recognized financial analysts:
| Grading Company | Action | New Grade | Date |
|---|---|---|---|
| Wells Fargo | Maintain | Equal Weight | 2026-02-05 |
| RBC Capital | Maintain | Sector Perform | 2026-02-05 |
| Citigroup | Maintain | Neutral | 2026-02-05 |
| JP Morgan | Downgrade | Underweight | 2026-01-16 |
| Mizuho | Downgrade | Underperform | 2026-01-05 |
| Wells Fargo | Maintain | Equal Weight | 2025-12-22 |
| Citigroup | Maintain | Neutral | 2025-12-08 |
| Morgan Stanley | Maintain | Equal Weight | 2025-11-05 |
| Baird | Maintain | Outperform | 2025-11-04 |
| JP Morgan | Maintain | Neutral | 2025-10-30 |
Which company has the best grades?
TE Connectivity Ltd. consistently receives stronger grades, including “Outperform,” “Buy,” and “Overweight.” Fortive Corporation’s ratings cluster around “Equal Weight” and have recent downgrades to “Underperform” and “Underweight.” Investors may view TE Connectivity as having more favorable institutional support.
Risks specific to each company
The following categories identify the critical pressure points and systemic threats facing both firms in the 2026 market environment:
1. Market & Competition
TE Connectivity Ltd.
- Operates globally in connectivity and sensor solutions with strong diversification across industries. Faces intense competition in hardware and equipment sectors.
Fortive Corporation
- Focuses on professional and engineered products with strong software integration. Competes heavily in industrial and healthcare markets.
2. Capital Structure & Debt
TE Connectivity Ltd.
- Debt-to-assets ratio is favorable at 26.1%. Interest coverage is very strong at 42.6x, indicating low financial risk.
Fortive Corporation
- Debt-to-assets also favorable at 27.3%, but interest coverage is lower at 7.0x, signaling higher leverage risk.
3. Stock Volatility
TE Connectivity Ltd.
- Beta of 1.24 suggests moderate volatility, slightly above market average. Price range wide from 116.3 to 250.7 USD.
Fortive Corporation
- Beta of 1.03 indicates lower volatility, closer to market average. Price range narrower at 45.5 to 62.8 USD.
4. Regulatory & Legal
TE Connectivity Ltd.
- Global footprint in 140 countries exposes it to complex regulatory environments, increasing compliance costs.
Fortive Corporation
- Also global but more focused in US and select markets, slightly less regulatory burden but still exposed.
5. Supply Chain & Operations
TE Connectivity Ltd.
- Extensive global supply chain with exposure to geopolitical disruptions. Relies on industrial and transportation segments.
Fortive Corporation
- Supply chain complexity due to diverse product lines, but smaller employee base suggests more agility.
6. ESG & Climate Transition
TE Connectivity Ltd.
- Significant industrial exposure requires aggressive adaptation to climate regulations and ESG standards.
Fortive Corporation
- Faces pressure to innovate in sustainability, especially in healthcare and environmental solutions.
7. Geopolitical Exposure
TE Connectivity Ltd.
- Incorporated in Switzerland, with broad international operations subject to currency and trade risks.
Fortive Corporation
- US-based, more exposed to domestic policies but less vulnerable to currency fluctuations.
Which company shows a better risk-adjusted profile?
TE Connectivity’s strongest risk lies in regulatory complexity and geopolitical exposure, but it benefits from robust liquidity and coverage ratios. Fortive’s key risk is weaker liquidity and higher operational leverage despite lower stock volatility. TE’s superior interest coverage and safer Altman Z-Score provide a better risk-adjusted profile. Recent data shows Fortive’s troubling current and quick ratios below 1, flagging liquidity constraints amid market uncertainties.
Final Verdict: Which stock to choose?
TE Connectivity’s superpower lies in its operational efficiency and strong cash generation, which underpin its slightly favorable financial health. However, its declining return on invested capital signals a need for vigilance. It fits well in an aggressive growth portfolio that can tolerate some profitability erosion for potential upside.
Fortive’s strategic moat centers on its robust intangible assets and improving profitability trajectory despite value destruction. Its lower valuation multiples and stronger balance sheet stability relative to TE Connectivity make it appealing for investors seeking growth at a reasonable price with a more conservative risk profile.
If you prioritize operational efficiency and aggressive growth potential, TE Connectivity presents a compelling scenario despite its deteriorating ROIC trend. However, if you seek a steadier growth story with improving profitability and better balance sheet resilience, Fortive offers better stability and a more balanced risk-reward profile.
Disclaimer: Investment carries a risk of loss of initial capital. The past performance is not a reliable indicator of future results. Be sure to understand risks before making an investment decision.
Go Further
I encourage you to read the complete analyses of TE Connectivity Ltd. and Fortive Corporation to enhance your investment decisions: