Home > Comparison > Technology > FTV vs SANM
The strategic rivalry between Fortive Corporation and Sanmina Corporation shapes the evolution of the technology hardware sector. Fortive operates as a diversified industrial technology firm focused on professional tools and software solutions, while Sanmina leads in integrated manufacturing and complex system assembly. This head-to-head pits Fortive’s innovation-driven model against Sanmina’s scale and manufacturing expertise. This analysis aims to reveal which company presents the superior risk-adjusted opportunity for a balanced, diversified portfolio.
Table of contents
Companies Overview
Fortive Corporation and Sanmina Corporation stand as key players in the hardware and equipment sector, shaping industrial technology landscapes.
Fortive Corporation: Precision Tools and Software Innovator
Fortive leads as a provider of engineered products and software for reliability, safety, and lifecycle management. It generates revenue from connected tools, enterprise software, and advanced healthcare solutions. In 2026, Fortive sharpened its focus on expanding software subscriptions and integrating IoT capabilities across manufacturing and healthcare verticals.
Sanmina Corporation: Integrated Manufacturing Powerhouse
Sanmina operates as a top-tier integrated manufacturing and supply chain solutions provider. It earns primarily from product design, assembly, and after-market services tailored to industrial, medical, and aerospace sectors. In 2026, Sanmina emphasized scaling its cloud-based manufacturing execution software and strengthening defense and automotive supply chains.
Strategic Collision: Similarities & Divergences
Both firms serve industrial technology but diverge in approach: Fortive prioritizes software-enabled service ecosystems, while Sanmina focuses on manufacturing scale and logistics. They compete chiefly in industrial automation and mission-critical hardware markets. This contrast defines Fortive’s tech-driven subscription model versus Sanmina’s asset-heavy manufacturing profile.
Income Statement Comparison
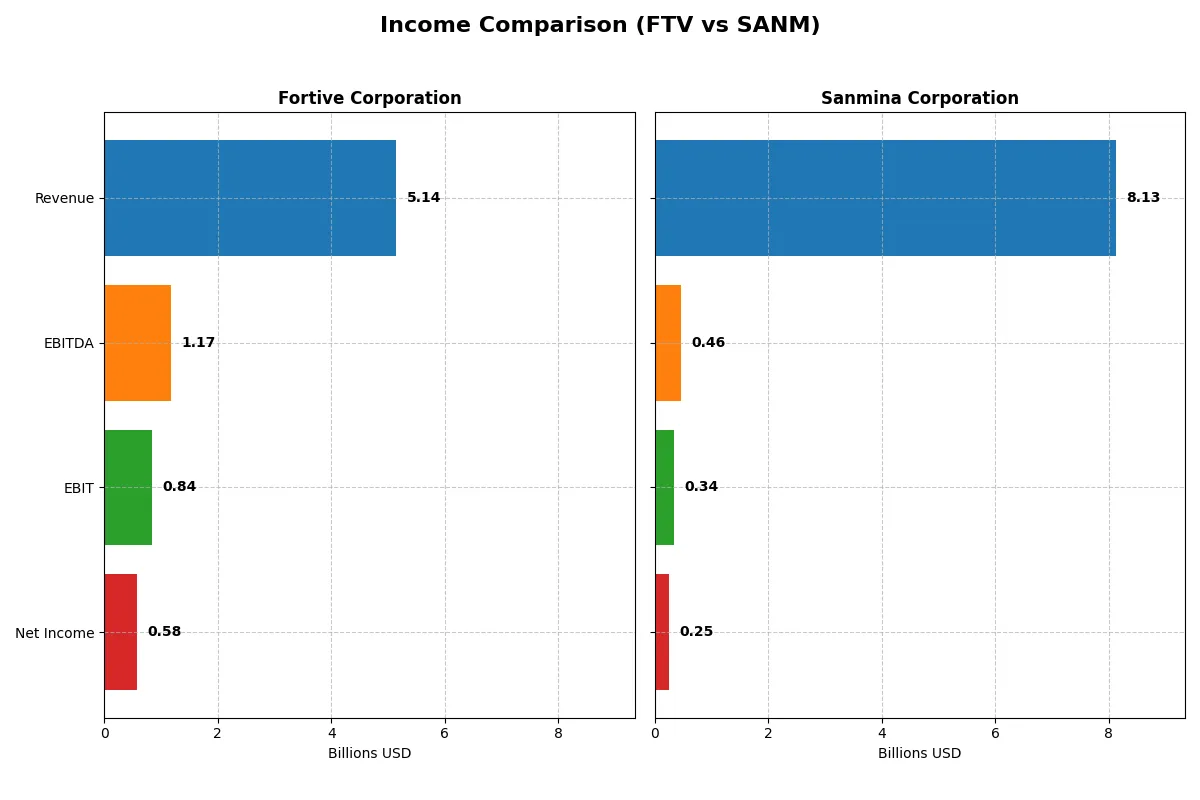
The following data dissects the core profitability and scalability of both corporate engines to reveal who dominates the bottom line:
| Metric | Fortive (FTV) | Sanmina (SANM) |
|---|---|---|
| Revenue | 5.14B | 8.13B |
| Cost of Revenue | 2.01B | 7.41B |
| Operating Expenses | 2.23B | 362M |
| Gross Profit | 3.13B | 716M |
| EBITDA | 1.17B | 463M |
| EBIT | 843M | 344M |
| Interest Expense | 121M | 4.30M |
| Net Income | 579M | 246M |
| EPS | 1.75 | 4.56 |
| Fiscal Year | 2025 | 2025 |
Income Statement Analysis: The Bottom-Line Duel
This income statement comparison exposes each company’s operational efficiency and profit sustainability across recent years.
Fortive Corporation Analysis
Fortive’s revenue peaks at 6.2B in 2024 before falling 17.5% to 5.1B in 2025, dragging net income down from 833M to 579M. Its gross margin stands robust near 61%, and net margin remains healthy at 11.3%. Despite a one-year decline, Fortive shows strong margin discipline, though momentum weakens in the latest fiscal year.
Sanmina Corporation Analysis
Sanmina’s revenue climbs steadily to 8.1B in 2025, up 7.4% year-over-year, yet net income slips slightly to 246M. Gross margin is thin at 8.8%, with net margin just 3%. Sanmina’s EPS growth of 14% signals operational improvements, but low profitability ratios highlight ongoing margin pressure and efficiency challenges.
Margin Strength vs. Revenue Growth
Fortive delivers superior margins and higher absolute profits but suffers recent revenue and net income declines. Sanmina expands revenue consistently with modest earnings growth but struggles with slim margins. For investors, Fortive’s strong profitability profile offers defensive earnings quality, while Sanmina presents a growth story constrained by margin compression.
Financial Ratios Comparison
These vital ratios act as a diagnostic tool to expose the underlying fiscal health, valuation premiums, and capital efficiency:
| Ratios | Fortive (FTV) | Sanmina (SANM) |
|---|---|---|
| ROE | 8.98% | 10.45% |
| ROIC | 7.44% | 9.04% |
| P/E | 30.16 | 25.59 |
| P/B | 2.71 | 2.67 |
| Current Ratio | 0.71 | 1.72 |
| Quick Ratio | 0.58 | 1.02 |
| D/E | 0.50 | 0.17 |
| Debt-to-Assets | 27.31% | 6.73% |
| Interest Coverage | 7.54 | 82.53 |
| Asset Turnover | 0.44 | 1.39 |
| Fixed Asset Turnover | 19.06 | 11.91 |
| Payout ratio | 15.92% | 0% |
| Dividend yield | 0.53% | 0% |
| Fiscal Year | 2025 | 2025 |
Efficiency & Valuation Duel: The Vital Signs
Financial ratios serve as a company’s DNA, unveiling hidden risks and operational strengths crucial for investor insight.
Fortive Corporation
Fortive shows moderate profitability with an 8.98% ROE and favorable 11.26% net margin, but its P/E of 30.16 suggests a stretched valuation. The company maintains a solid dividend yield of 0.53%, though modest, balancing reinvestment into R&D at 6.66% of revenue. Weak liquidity ratios highlight potential short-term risks.
Sanmina Corporation
Sanmina delivers a stronger 10.45% ROE despite a lower 3.03% net margin, with a more reasonable P/E of 25.59. Its balance sheet shines with a current ratio of 1.72 and a robust interest coverage of 80.01, indicating operational efficiency. Sanmina offers no dividend, focusing capital on growth and operational strength.
Prudent Valuation vs. Operational Efficiency
Fortive’s high valuation and dividend provide steady income but come with liquidity concerns. Sanmina offers better liquidity and operational metrics, albeit with lower profitability and no dividend. Risk-tolerant investors may prefer Fortive’s income profile; those favoring balance sheet strength lean toward Sanmina.
Which one offers the Superior Shareholder Reward?
Fortive (FTV) pays a modest dividend yield near 0.53% with a conservative payout ratio around 13-16%. Its free cash flow coverage exceeds 90%, supporting dividend sustainability. Fortive also executes steady buybacks, enhancing shareholder returns. Sanmina (SANM) pays no dividend, reinvesting free cash flows into growth and capex. Despite no direct distributions, SANM’s aggressive buyback activity and asset turnover above 1.3 signal capital-efficient growth. However, Fortive’s balanced dividend and buyback policy offers a more consistent and sustainable shareholder reward in 2026. I favor Fortive for superior total return driven by income plus buybacks.
Comparative Score Analysis: The Strategic Profile
The radar chart reveals the fundamental DNA and trade-offs of Fortive Corporation and Sanmina Corporation, highlighting their financial strengths and vulnerabilities:
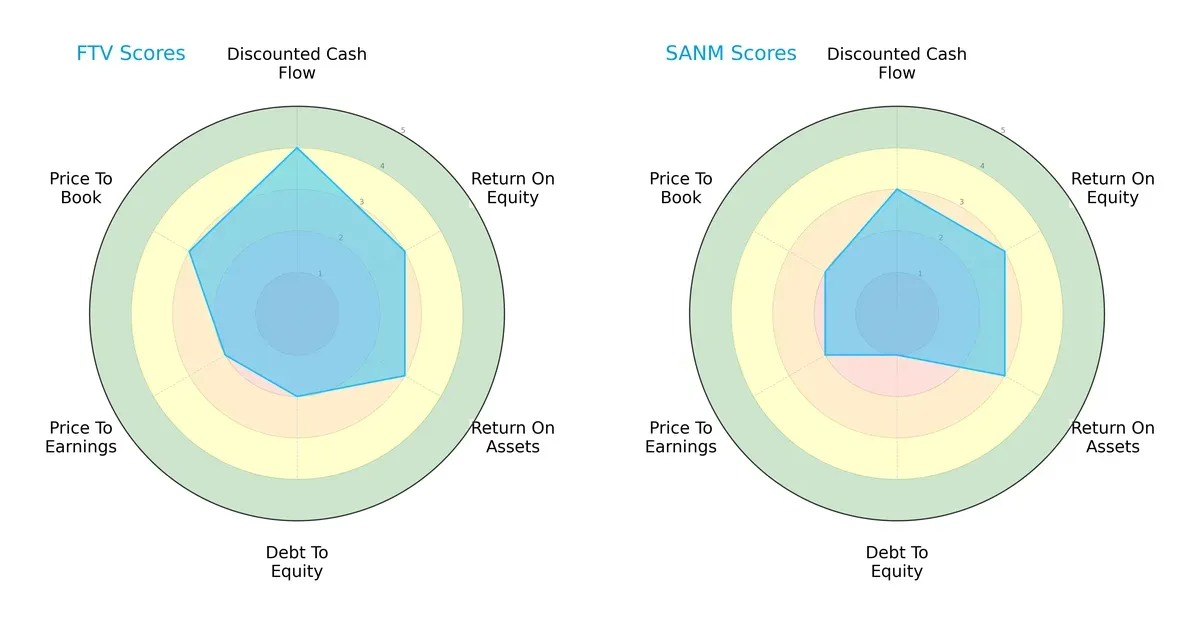
Fortive shows a more balanced profile with a strong discounted cash flow score (4) and moderate returns on equity and assets (3 each). Sanmina relies more heavily on operational efficiency with moderate ROE and ROA but suffers from weaker debt-to-equity (1) and valuation scores (P/B at 2). Fortive’s moderate valuation and stronger cash flow projection suggest a steadier strategic position.
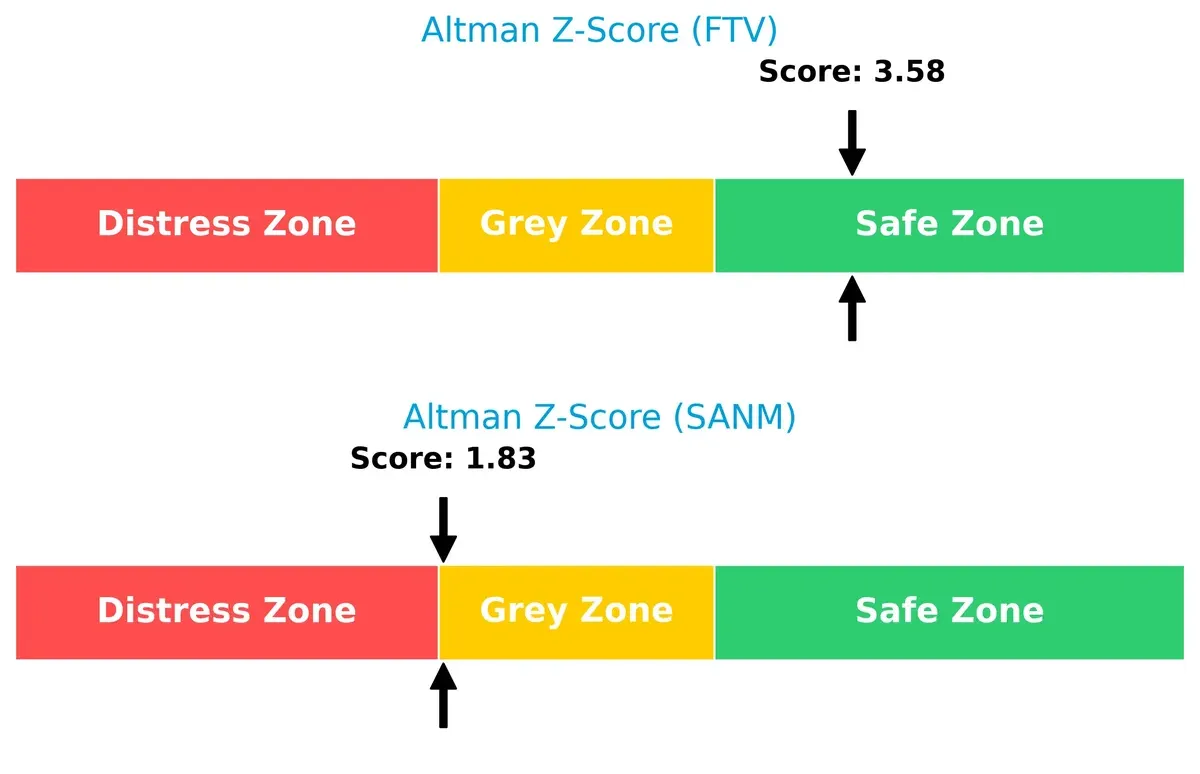
Bankruptcy Risk: Solvency Showdown
Fortive’s Altman Z-Score at 3.58 places it firmly in the safe zone, signaling strong solvency and low bankruptcy risk. Sanmina, at 1.83, sits in the grey zone, indicating moderate financial distress and heightened risk in this market cycle:
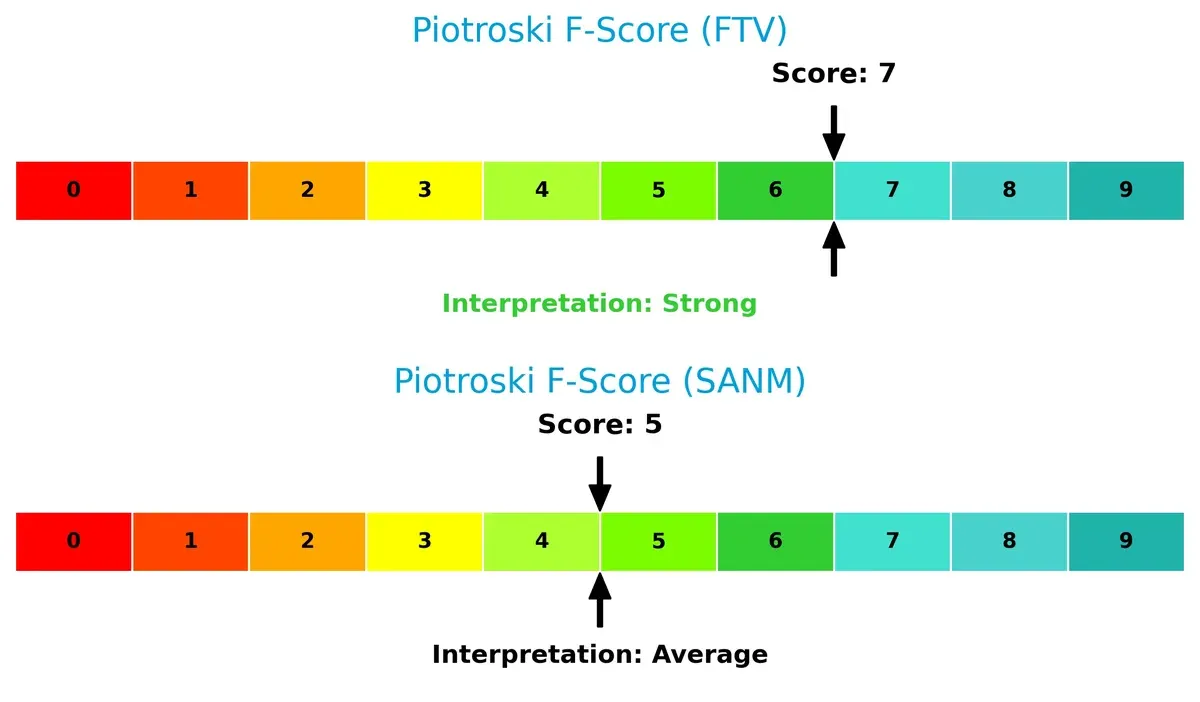
Financial Health: Quality of Operations
Fortive’s Piotroski F-Score of 7 indicates strong financial health and operational quality. Sanmina’s score of 5 reflects average health, suggesting internal weaknesses that could pose risks compared to Fortive’s more robust financial metrics:
How are the two companies positioned?
This section dissects Fortive and Sanmina’s operational DNA by comparing their revenue distribution and internal dynamics. The goal is to confront their economic moats and identify the more resilient competitive advantage in today’s market.
Revenue Segmentation: The Strategic Mix
This visual comparison dissects how Fortive Corporation and Sanmina Corporation diversify their income streams and where their primary sector bets lie:
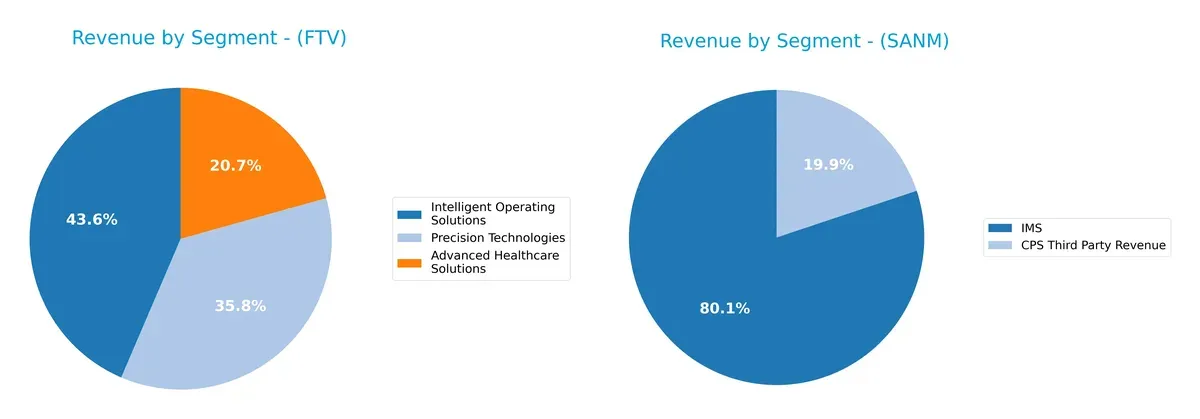
Fortive’s revenue splits across Advanced Healthcare Solutions ($1.29B), Intelligent Operating Solutions ($2.71B), and Precision Technologies ($2.23B) reveal a balanced portfolio. Sanmina leans heavily on its IMS segment ($6.51B), dwarfing CPS Third Party Revenue ($1.62B). Fortive’s diversified mix reduces concentration risk, while Sanmina’s dominance in IMS signals infrastructure reliance but exposes it to segment-specific volatility. This contrast highlights Fortive’s ecosystem breadth versus Sanmina’s focused operational leverage.
Strengths and Weaknesses Comparison
This table compares the Strengths and Weaknesses of Fortive Corporation (FTV) and Sanmina Corporation (SANM):
FTV Strengths
- Diversified revenue across Advanced Healthcare, Operating Solutions, and Precision Technologies
- Favorable net margin at 11.26%
- Strong debt management with D/E of 0.5 and debt/assets 27.31%
- Global presence including significant US and China sales
- High fixed asset turnover at 19.06
SANM Strengths
- Favorable current and quick ratios indicating strong liquidity
- Lower leverage with D/E at 0.17 and debt/assets 6.73%
- High interest coverage of 80.01 supports debt service
- Strong asset turnover at 1.39 shows efficient use of assets
- Diverse geographic sales across Americas, Asia Pacific, and EMEA
FTV Weaknesses
- Low current (0.71) and quick ratios (0.58) raise liquidity concerns
- Return on equity (8.98%) below cost of capital
- Unfavorable PE of 30.16 suggests high valuation
- Asset turnover at 0.44 is weak compared to sector norms
- Dividend yield low at 0.53%
SANM Weaknesses
- Low net margin at 3.03% signals profitability pressure
- PE ratio of 25.59 still unfavorable though better than FTV
- No dividend yield may deter income-focused investors
- Neutral ROIC at 9.04% close to WACC of 8.35% limits value creation
- Geographic revenue less concentrated in largest economies
Fortive shows strength in product diversification and managing leverage but faces liquidity and profitability challenges. Sanmina maintains better liquidity and asset efficiency but struggles with profitability and shareholder returns. Each company’s financial profile suggests different strategic priorities.
The Moat Duel: Analyzing Competitive Defensibility
A structural moat is the only true guard protecting long-term profits from relentless competitive erosion. Let’s dissect the nature and strength of moats for two industry players:
Fortive Corporation: Intangible Assets and Integrated Solutions
Fortive leverages strong intangible assets and brand portfolio, reflected in stable gross margins near 61%. Despite recent revenue declines, its growing ROIC suggests improving capital efficiency, which may deepen its moat through innovation and market expansion in 2026.
Sanmina Corporation: Cost Efficiency and Scale Advantage
Sanmina’s moat centers on cost advantage and scale in integrated manufacturing. Unlike Fortive, Sanmina shows moderate margins but favorable revenue growth. However, a declining ROIC trend signals margin pressure ahead, challenging its ability to sustain value creation despite expansion opportunities.
Moat Strength Showdown: Intangible Assets vs. Cost Leadership
Fortive’s expanding ROIC and margin stability give it a deeper moat than Sanmina’s eroding profitability. I see Fortive better positioned to defend market share through innovation and operational leverage in a competitive hardware sector.
Which stock offers better returns?
The past year shows contrasting price moves: Fortive Corporation’s stock declined overall but gained recently, while Sanmina Corporation surged with decelerating momentum.
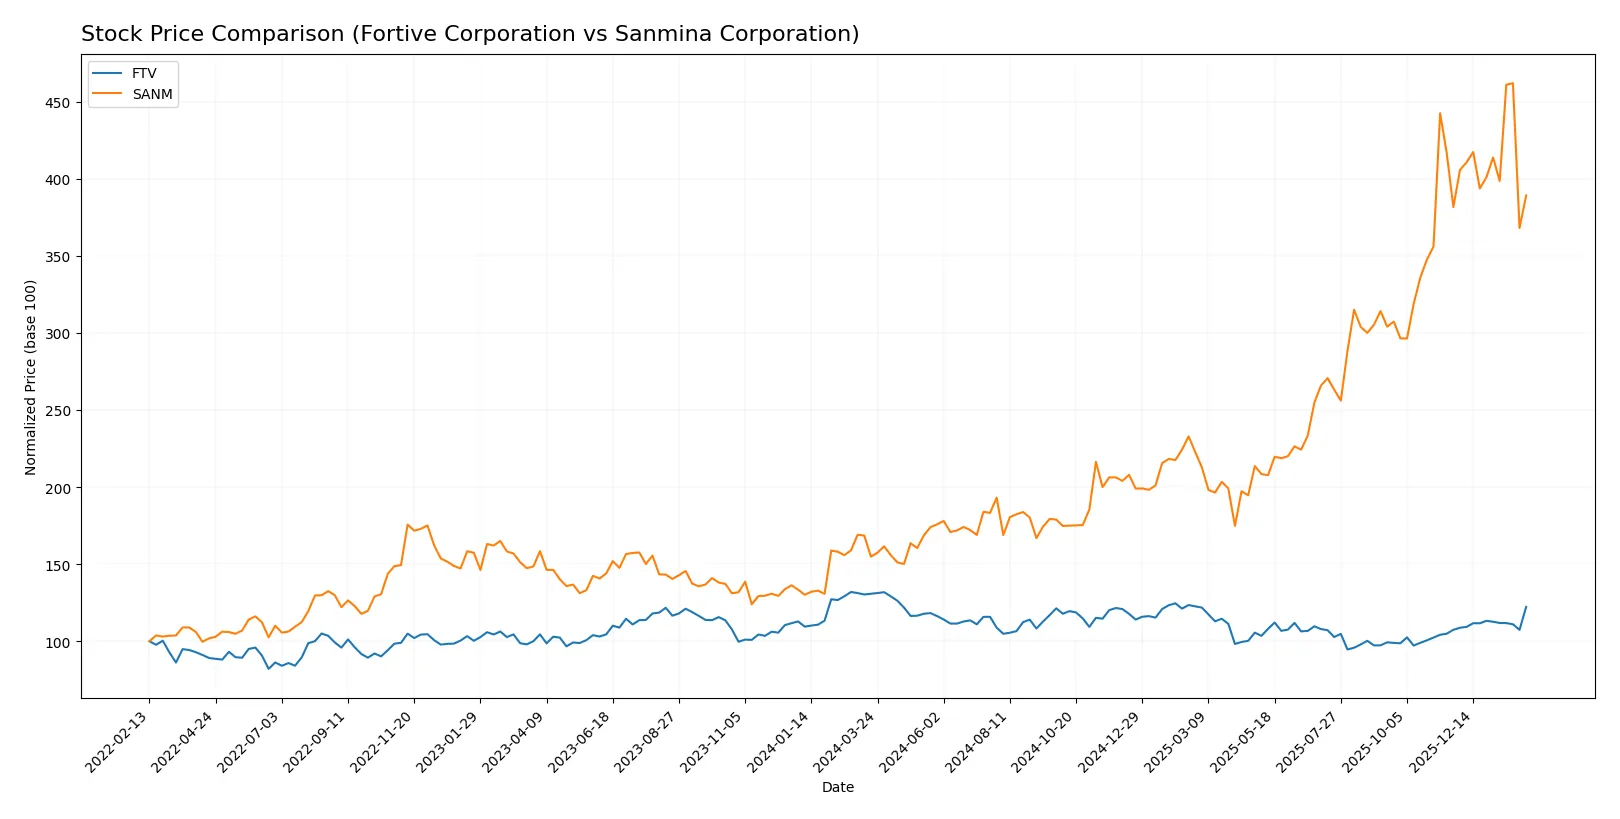
Trend Comparison
Fortive Corporation’s stock fell 6.53% over the past year, marking a bearish trend with accelerating decline. It hit a high of 64.82 and a low of 46.55, with moderate volatility (std dev 4.16).
Sanmina Corporation’s stock rose sharply by 151.28%, showing a bullish trend with decelerating gains. It ranged from 57.79 to 177.83, but experienced high volatility (std dev 32.22).
Sanmina’s stock outperformed Fortive significantly, delivering the highest market return with sustained bullish momentum despite slowing acceleration.
Target Prices
Analysts present a clear target consensus for Fortive Corporation and Sanmina Corporation, indicating distinct growth expectations.
| Company | Target Low | Target High | Consensus |
|---|---|---|---|
| Fortive Corporation | 51 | 70 | 59.83 |
| Sanmina Corporation | 200 | 200 | 200 |
Fortive’s consensus target of 59.83 is slightly below its current price of 60.12, suggesting modest downside risk or stabilization. Sanmina’s target at 200 signals significant upside from its 149.79 market price, reflecting strong analyst confidence.

Don’t Let Luck Decide Your Entry Point
Optimize your entry points with our advanced ProRealTime indicators. You’ll get efficient buy signals with precise price targets for maximum performance. Start outperforming now!
How do institutions grade them?
The following tables summarize recent institutional grades for Fortive Corporation and Sanmina Corporation:
Fortive Corporation Grades
Here are the latest official grades from reputable financial institutions for Fortive Corporation:
| Grading Company | Action | New Grade | Date |
|---|---|---|---|
| Wells Fargo | Maintain | Equal Weight | 2026-02-05 |
| RBC Capital | Maintain | Sector Perform | 2026-02-05 |
| Citigroup | Maintain | Neutral | 2026-02-05 |
| JP Morgan | Downgrade | Underweight | 2026-01-16 |
| Mizuho | Downgrade | Underperform | 2026-01-05 |
| Wells Fargo | Maintain | Equal Weight | 2025-12-22 |
| Citigroup | Maintain | Neutral | 2025-12-08 |
| Morgan Stanley | Maintain | Equal Weight | 2025-11-05 |
| Baird | Maintain | Outperform | 2025-11-04 |
| JP Morgan | Maintain | Neutral | 2025-10-30 |
Sanmina Corporation Grades
Below are recent verified institutional grades assigned to Sanmina Corporation:
| Grading Company | Action | New Grade | Date |
|---|---|---|---|
| Argus Research | Maintain | Buy | 2026-01-28 |
| B of A Securities | Maintain | Neutral | 2025-07-11 |
| B of A Securities | Maintain | Neutral | 2025-06-09 |
| B of A Securities | Upgrade | Neutral | 2025-01-29 |
| Craig-Hallum | Maintain | Hold | 2024-11-05 |
| Craig-Hallum | Downgrade | Hold | 2024-04-30 |
| Sidoti & Co. | Upgrade | Buy | 2022-11-08 |
| Sidoti & Co. | Upgrade | Buy | 2022-11-07 |
| Sidoti & Co. | Downgrade | Neutral | 2022-10-31 |
| Sidoti & Co. | Downgrade | Neutral | 2022-10-30 |
Which company has the best grades?
Sanmina Corporation generally receives higher grades, including repeated “Buy” ratings from Argus Research and Sidoti & Co. Fortive’s grades cluster around neutral or underperform. Investors may interpret Sanmina’s stronger grades as greater confidence from analysts.
Risks specific to each company
The following categories identify the critical pressure points and systemic threats facing both firms in the 2026 market environment:
1. Market & Competition
Fortive Corporation
- Faces pressure from diversified industrial tech rivals, with moderate ROIC and net margin but high P/E ratio signaling growth expectations.
Sanmina Corporation
- Competes in highly commoditized manufacturing with lower net margin and P/E, indicating pricing pressure and margin risks.
2. Capital Structure & Debt
Fortive Corporation
- Maintains moderate leverage (D/E 0.5) with favorable debt coverage, but liquidity ratios below 1 signal short-term stress.
Sanmina Corporation
- Exhibits low leverage (D/E 0.17) and strong liquidity, minimizing refinancing risk and enhancing financial flexibility.
3. Stock Volatility
Fortive Corporation
- Beta near 1.03 suggests typical market volatility; average volume doubled recently, indicating moderate trading interest.
Sanmina Corporation
- Beta slightly lower at 1.03, recent 5.2% price jump with volume surge signals higher short-term volatility.
4. Regulatory & Legal
Fortive Corporation
- Exposure to healthcare and industrial safety regulations creates compliance cost risks but also barriers to entry.
Sanmina Corporation
- Defense and aerospace segments face stringent regulations, raising potential legal and certification risks.
5. Supply Chain & Operations
Fortive Corporation
- Complex global supply chain for specialized instruments risks disruption but benefits from diversified end markets.
Sanmina Corporation
- Heavily reliant on integrated manufacturing with potential supply bottlenecks amid semiconductor and logistics constraints.
6. ESG & Climate Transition
Fortive Corporation
- Progress on environmental software and safety tools aligns with ESG trends, yet industrial footprint remains significant.
Sanmina Corporation
- Faces challenges reducing carbon footprint in manufacturing; ESG initiatives in supply chain management are ongoing.
7. Geopolitical Exposure
Fortive Corporation
- US-centric with global sales; moderate geopolitical risk from international operations and trade policies.
Sanmina Corporation
- Greater exposure to global supply chain risks and overseas manufacturing, increasing geopolitical and tariff vulnerability.
Which company shows a better risk-adjusted profile?
Sanmina’s strongest risk lies in market competition and lower profitability, while Fortive’s main risk is short-term liquidity stress. Sanmina’s low leverage and strong liquidity provide superior financial stability. Fortive’s below-1 current ratio signals caution despite favorable debt metrics. Sanmina’s recent 5% stock price surge amid solid liquidity highlights market confidence. Overall, Sanmina offers a more balanced risk-adjusted profile in 2026.
Final Verdict: Which stock to choose?
Fortive Corporation’s superpower lies in its operational efficiency and strong cash flow generation. However, its stretched liquidity ratios warrant caution. Fortive fits portfolios seeking disciplined capital allocation and moderate growth, where steady operational execution is prized despite cyclical headwinds.
Sanmina Corporation’s strategic moat is its solid balance sheet and superior asset turnover, translating into resilience and operational agility. Compared to Fortive, Sanmina offers a safer profile, appealing to investors favoring stability combined with growth potential, especially in tech manufacturing segments.
If you prioritize operational efficiency and cash flow strength, Fortive is the compelling choice despite liquidity risks. However, if you seek better financial stability and a stronger asset base, Sanmina outshines as a more conservative option with growth upside. Each presents a distinct risk-reward profile aligned with different investor strategies.
Disclaimer: Investment carries a risk of loss of initial capital. The past performance is not a reliable indicator of future results. Be sure to understand risks before making an investment decision.
Go Further
I encourage you to read the complete analyses of Fortive Corporation and Sanmina Corporation to enhance your investment decisions: