Home > Comparison > Technology > SNDK vs FTV
The strategic rivalry between Sandisk Corporation and Fortive Corporation shapes the competitive dynamics of the technology hardware sector. Sandisk focuses on NAND flash storage solutions, emphasizing innovation in solid-state drives and embedded products. Fortive operates as a diversified industrial technology provider, offering professional tools, software, and advanced healthcare solutions. This analysis will assess which company’s operational model presents a superior risk-adjusted opportunity for inclusion in a diversified portfolio.
Table of contents
Companies Overview
Sandisk Corporation and Fortive Corporation stand as pivotal players in the hardware and equipment sector.
Sandisk Corporation: Leader in NAND Flash Storage Solutions
Sandisk commands the NAND flash technology storage market, generating revenue primarily through solid state drives, embedded products, and removable cards. Its strategic focus in 2026 remains on advancing storage device innovation to meet growing digital data demands. The company’s market cap of 88B underscores its dominant role in high-performance storage solutions.
Fortive Corporation: Diverse Industrial Technology Innovator
Fortive operates as a broad-based industrial technology firm, earning revenue from engineered products, software, and services across multiple sectors. Its 2026 strategy emphasizes expanding intelligent operating solutions and precision technologies to enhance operational efficiency. With a market cap near 19B, Fortive leverages its diverse brand portfolio to serve a wide range of end markets.
Strategic Collision: Similarities & Divergences
Sandisk’s focus on specialized storage hardware contrasts with Fortive’s diversified, software-driven industrial approach. Both vie for market share in technology-driven hardware but target distinct verticals—consumer data storage versus industrial operational tools. Their investment profiles diverge sharply: Sandisk bets on storage innovation, while Fortive prioritizes industrial digital transformation and service integration.
Income Statement Comparison
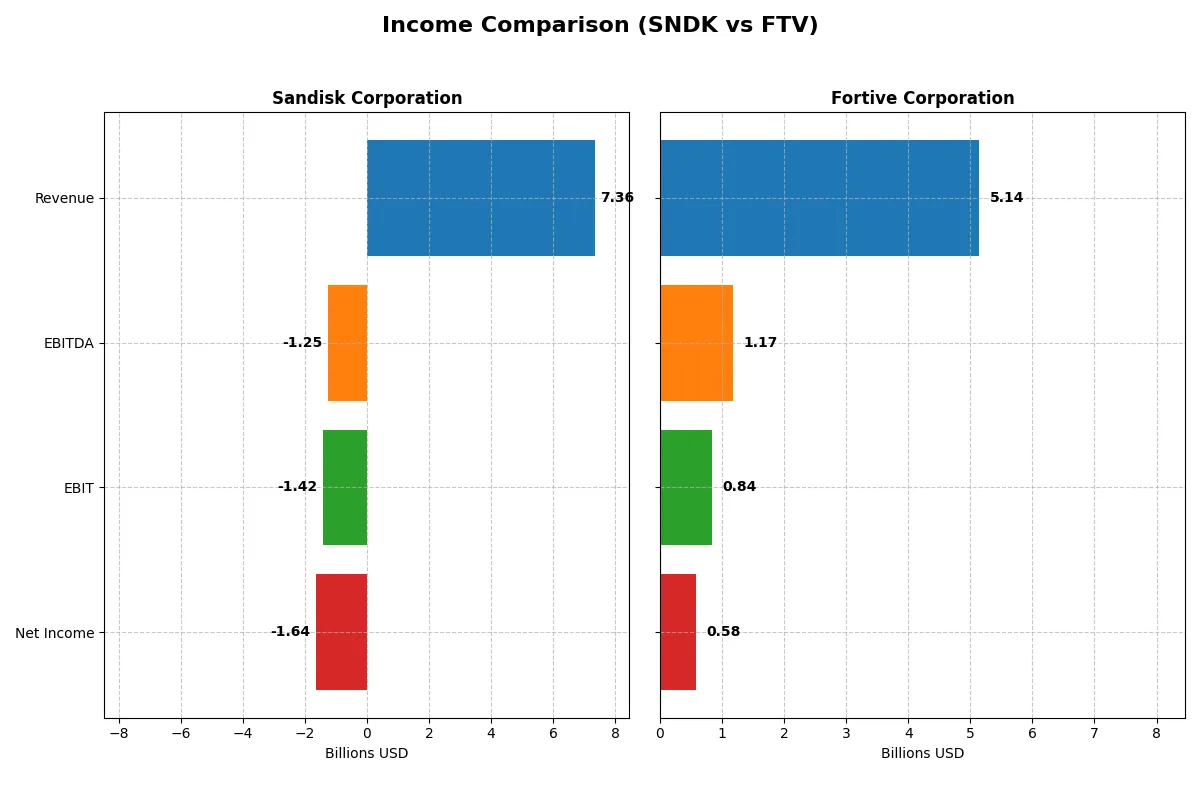
This data dissects the core profitability and scalability of both corporate engines to reveal who dominates the bottom line:
| Metric | Sandisk Corporation (SNDK) | Fortive Corporation (FTV) |
|---|---|---|
| Revenue | 7.36B | 5.14B |
| Cost of Revenue | 5.14B | 2.01B |
| Operating Expenses | 3.59B | 2.23B |
| Gross Profit | 2.21B | 3.13B |
| EBITDA | -1.25B | 1.17B |
| EBIT | -1.42B | 843M |
| Interest Expense | 63M | 121M |
| Net Income | -1.64B | 579M |
| EPS | -11.32 | 1.75 |
| Fiscal Year | 2025 | 2025 |
Income Statement Analysis: The Bottom-Line Duel
This income statement comparison reveals which company drives operational efficiency and bottom-line success through its financial engine.
Sandisk Corporation Analysis
Sandisk’s revenue fell 25% from 2022 to 2025, with net income collapsing from 1.06B to -1.64B. Gross margin improved to 30%, yet the net margin turned sharply negative at -22% in 2025. Despite a 10% revenue uptick in 2025, operating losses deepened, reflecting deteriorating profitability and operational inefficiency.
Fortive Corporation Analysis
Fortive posted steady revenues around 5.1B–6.2B from 2021 to 2025, with a slight overall decline of 2%. Gross margin remained robust near 61%, supporting a positive net margin of 11% in 2025. Though net income dipped 5% over five years, Fortive sustained healthy profitability and operating leverage even amid a recent earnings slowdown.
Clear Profitability vs. Recovery Struggles
Fortive outperforms Sandisk with consistently higher margins and positive net income, underscoring stronger operational control and capital allocation. Sandisk’s steep net losses and margin erosion signal fundamental challenges despite recent revenue gains. For investors, Fortive’s stable profitability offers a more attractive profile than Sandisk’s current recovery struggles.
Financial Ratios Comparison
These vital ratios act as a diagnostic tool to expose the underlying fiscal health, valuation premiums, and capital efficiency of the companies compared below:
| Ratios | Sandisk Corporation (SNDK) | Fortive Corporation (FTV) |
|---|---|---|
| ROE | -17.8% | 8.98% |
| ROIC | -11.9% | 7.44% |
| P/E | -4.17 | 30.16 |
| P/B | 0.74 | 2.71 |
| Current Ratio | 3.56 | 0.71 |
| Quick Ratio | 2.11 | 0.58 |
| D/E (Debt-to-Equity) | 0.22 | 0.50 |
| Debt-to-Assets | 15.7% | 27.3% |
| Interest Coverage | -21.9 | 7.54 |
| Asset Turnover | 0.57 | 0.44 |
| Fixed Asset Turnover | 11.9 | 19.1 |
| Payout ratio | 0 | 16.0% |
| Dividend yield | 0 | 0.53% |
| Fiscal Year | 2025 | 2025 |
Efficiency & Valuation Duel: The Vital Signs
Financial ratios serve as a company’s DNA, exposing hidden risks and revealing operational efficiency and valuation strength.
Sandisk Corporation
Sandisk suffers from negative profitability with a -17.8% ROE and -22.3% net margin, signaling operational challenges. The valuation appears attractive with a low P/E of -4.17 and P/B of 0.74, suggesting undervaluation. Sandisk does not pay dividends, instead likely reinvesting in R&D (15.4% of revenue) to fuel future growth.
Fortive Corporation
Fortive posts a positive net margin of 11.3%, but a modest 9.0% ROE indicates moderate profitability. The stock trades at a stretched P/E of 30.16 and a P/B of 2.71, reflecting premium valuation. Dividend yield is minimal at 0.53%, implying a balanced approach between returns and reinvestment in innovation (6.7% of revenue).
Premium Valuation vs. Operational Struggles
Fortive offers stable profitability and a premium valuation, while Sandisk’s deep operational losses contrast with its appealing valuation multiples. Investors seeking lower risk may prefer Fortive’s steadier profile, whereas those willing to tolerate operational headwinds might consider Sandisk’s potential upside.
Which one offers the Superior Shareholder Reward?
I compare Sandisk Corporation (SNDK) and Fortive Corporation (FTV) on distribution strategies, dividend yields, payout ratios, and buybacks. Sandisk pays no dividend and suffers free cash flow deficits, focusing on reinvestment amid losses. Fortive yields ~0.53%, with a sustainable 13–16% payout ratio and robust buybacks fueling total return. Fortive’s consistent profitability and cash flow support dividends and buybacks. Sandisk’s zero payout and negative cash flow raise sustainability concerns. I conclude Fortive offers a superior total shareholder reward in 2026 through balanced income and capital return.
Comparative Score Analysis: The Strategic Profile
The radar chart reveals the fundamental DNA and trade-offs of Sandisk Corporation and Fortive Corporation, highlighting their core financial strengths and weaknesses:
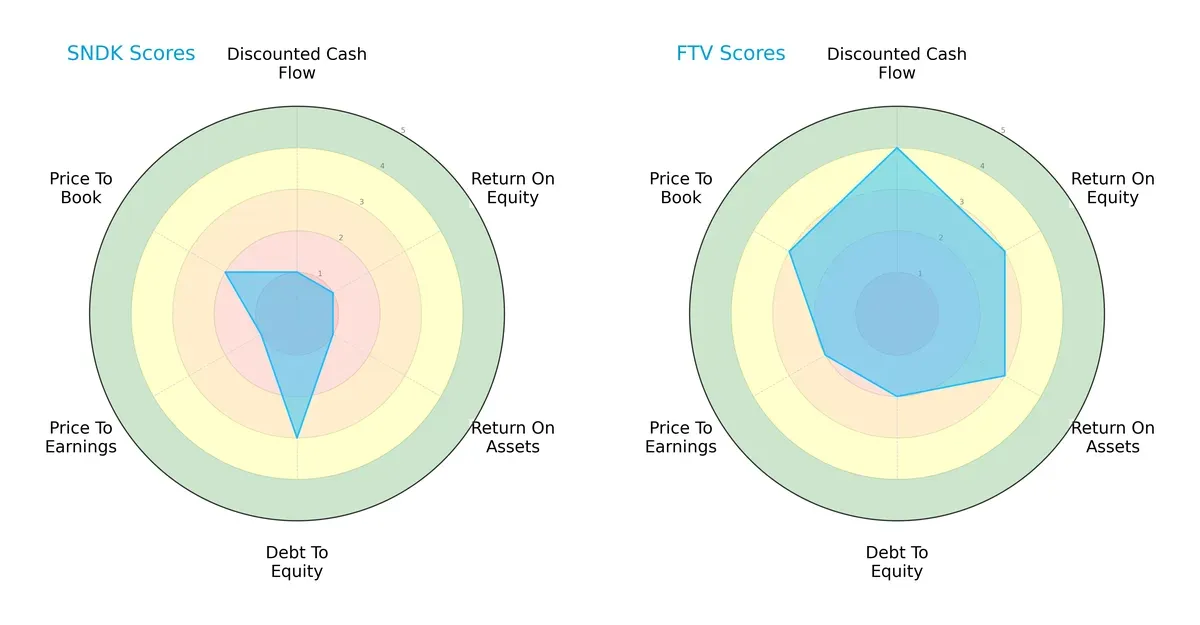
Fortive dominates in discounted cash flow with a strong score of 4, indicating robust future cash flow projections. It also outperforms Sandisk in return on equity (3 vs. 1) and return on assets (3 vs. 1), showing more efficient profit generation and asset use. Sandisk holds a moderate edge in debt-to-equity (3 vs. 2), suggesting a slightly stronger balance sheet. However, Fortive’s valuation metrics (PE and PB scores of 2 and 3) are more balanced compared to Sandisk’s very unfavorable scores, indicating Fortive offers a more stable investment profile. Overall, Fortive presents a more balanced and financially sound profile, while Sandisk relies heavily on its moderate leverage advantage.
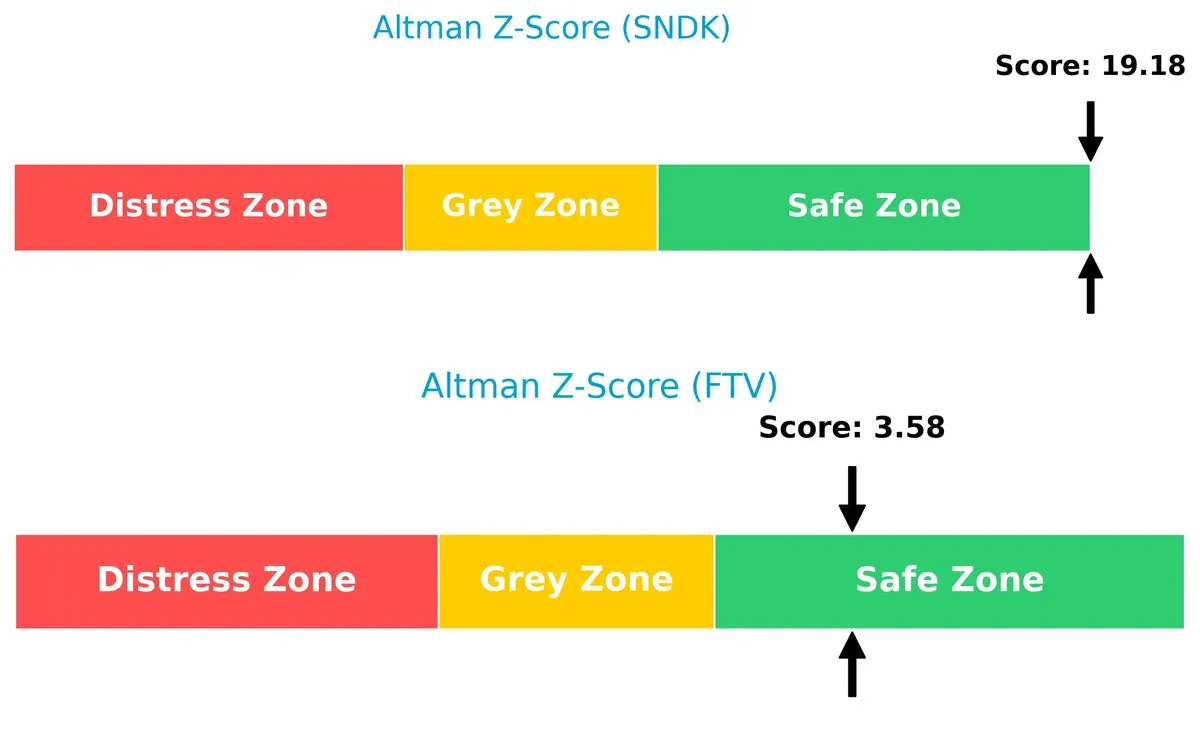
Bankruptcy Risk: Solvency Showdown
Fortive’s Altman Z-Score of 3.58 versus Sandisk’s exceptional 19.18 signals both companies are in the safe zone, but Sandisk’s score implies a far stronger buffer against bankruptcy risks in this cycle:
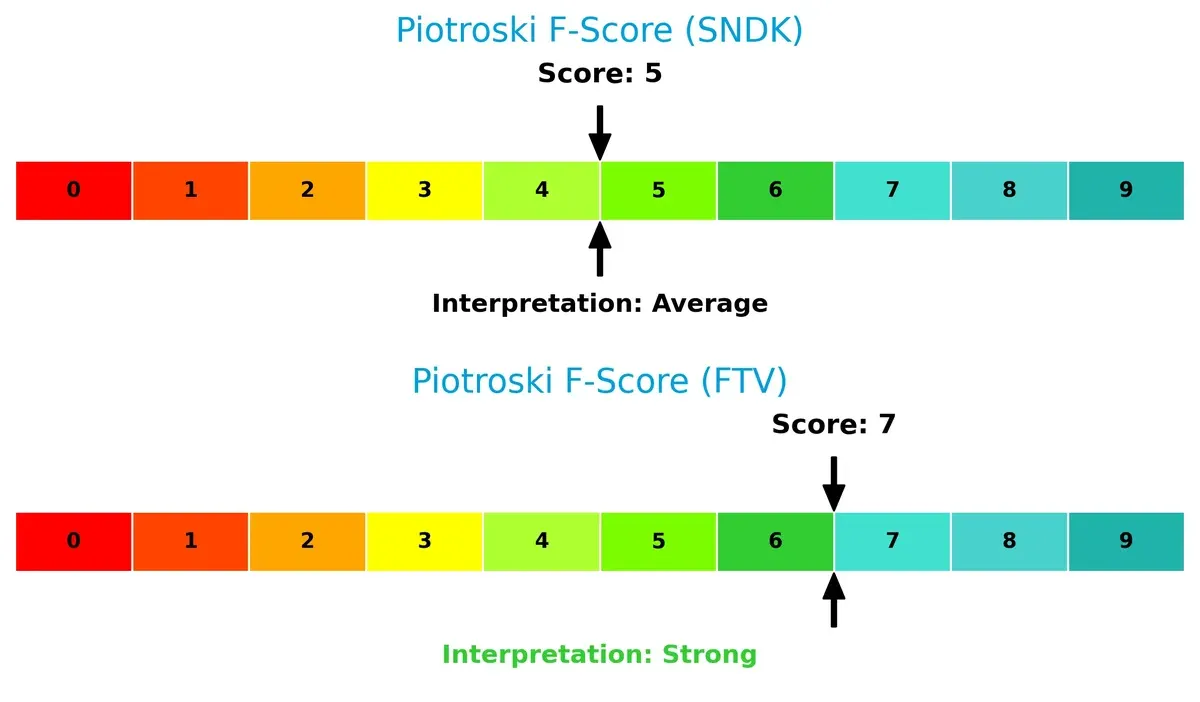
Financial Health: Quality of Operations
Fortive scores a robust 7 on the Piotroski scale, outperforming Sandisk’s average 5. This indicates Fortive operates with healthier internal fundamentals and fewer red flags, making it the safer operational bet:
How are the two companies positioned?
This section dissects Sandisk and Fortive’s operational DNA by comparing their revenue distribution and internal strengths and weaknesses. The goal is to confront their economic moats to identify which model offers the most resilient, sustainable competitive advantage today.
Revenue Segmentation: The Strategic Mix
This visual comparison dissects how Sandisk Corporation and Fortive Corporation diversify their income streams and reveals where their primary sector bets lie:
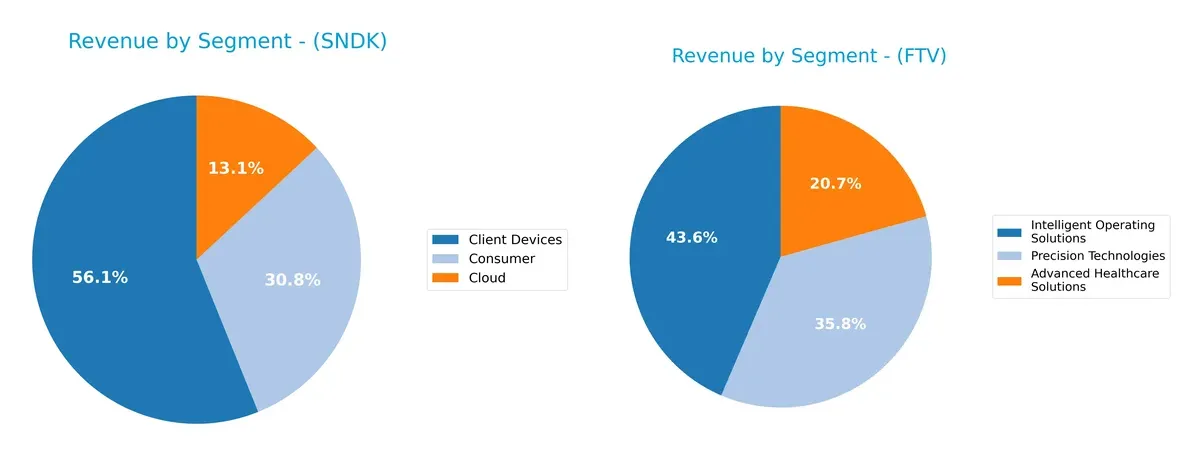
Sandisk’s revenue pivots on Client Devices at $4.13B, with Consumer and Cloud trailing at $2.27B and $960M, respectively. Fortive spreads its $6.82B total more evenly across Intelligent Operating Solutions ($2.71B), Precision Technologies ($2.23B), and Advanced Healthcare Solutions ($1.29B). Sandisk’s reliance on Client Devices signals concentration risk, while Fortive’s balanced mix suggests strategic resilience via diversified industrial and healthcare ecosystems.
Strengths and Weaknesses Comparison
This table compares the strengths and weaknesses of Sandisk Corporation and Fortive Corporation:
Sandisk Corporation Strengths
- Diversified revenue across Client Devices, Consumer, and Cloud segments
- Strong presence in China and Asia regions
- Favorable quick ratio and low debt-to-assets ratio
- Efficient fixed asset turnover
Fortive Corporation Strengths
- Broad product portfolio including Healthcare, Operating Solutions, and Precision Technologies
- Large US market share with growing geographic diversification
- Favorable net margin and interest coverage
- High fixed asset turnover
Sandisk Corporation Weaknesses
- Negative net margin, ROE, and ROIC indicate profitability challenges
- High WACC signals expensive capital
- Unfavorable current ratio and interest coverage
- Zero dividend yield reflects limited shareholder returns
Fortive Corporation Weaknesses
- Low current and quick ratios suggest liquidity concerns
- Unfavorable PE ratio and modest ROE
- Asset turnover below sector average
- Low dividend yield may deter income investors
Both companies show strengths in diversification and asset efficiency but face liquidity and profitability issues. Sandisk struggles with negative returns and capital cost, while Fortive must improve liquidity and valuation metrics to enhance financial robustness.
The Moat Duel: Analyzing Competitive Defensibility
A structural moat is the only reliable barrier protecting long-term profits from relentless competitive pressure. Let’s unpack these companies’ moats:
Sandisk Corporation: Intangible Asset Moat Anchored in NAND Flash Technology
Sandisk relies on proprietary NAND flash technology, driving its hardware differentiation. Yet, declining ROIC and negative margins signal erosion. New product innovation in 2026 must reverse value destruction to sustain this advantage.
Fortive Corporation: Diversified Product Ecosystem with Operational Excellence
Fortive’s moat stems from its broad industrial tech portfolio and growing ROIC trend, despite slight value shedding. Its operational tools and software suite fortify margins. Expansion into new industrial software markets could deepen this moat in 2026.
Moat Strength Showdown: Proprietary Technology vs. Diversified Industrial Ecosystem
Fortive holds a wider, more resilient moat with improving capital returns and margin stability. Sandisk’s shrinking profitability and steep ROIC decline expose vulnerability. Fortive is better positioned to defend market share amid evolving industry dynamics.
Which stock offers better returns?
The past year shows Sandisk Corporation’s stock surging sharply, while Fortive Corporation’s shares declined overall despite a minor recent rebound.
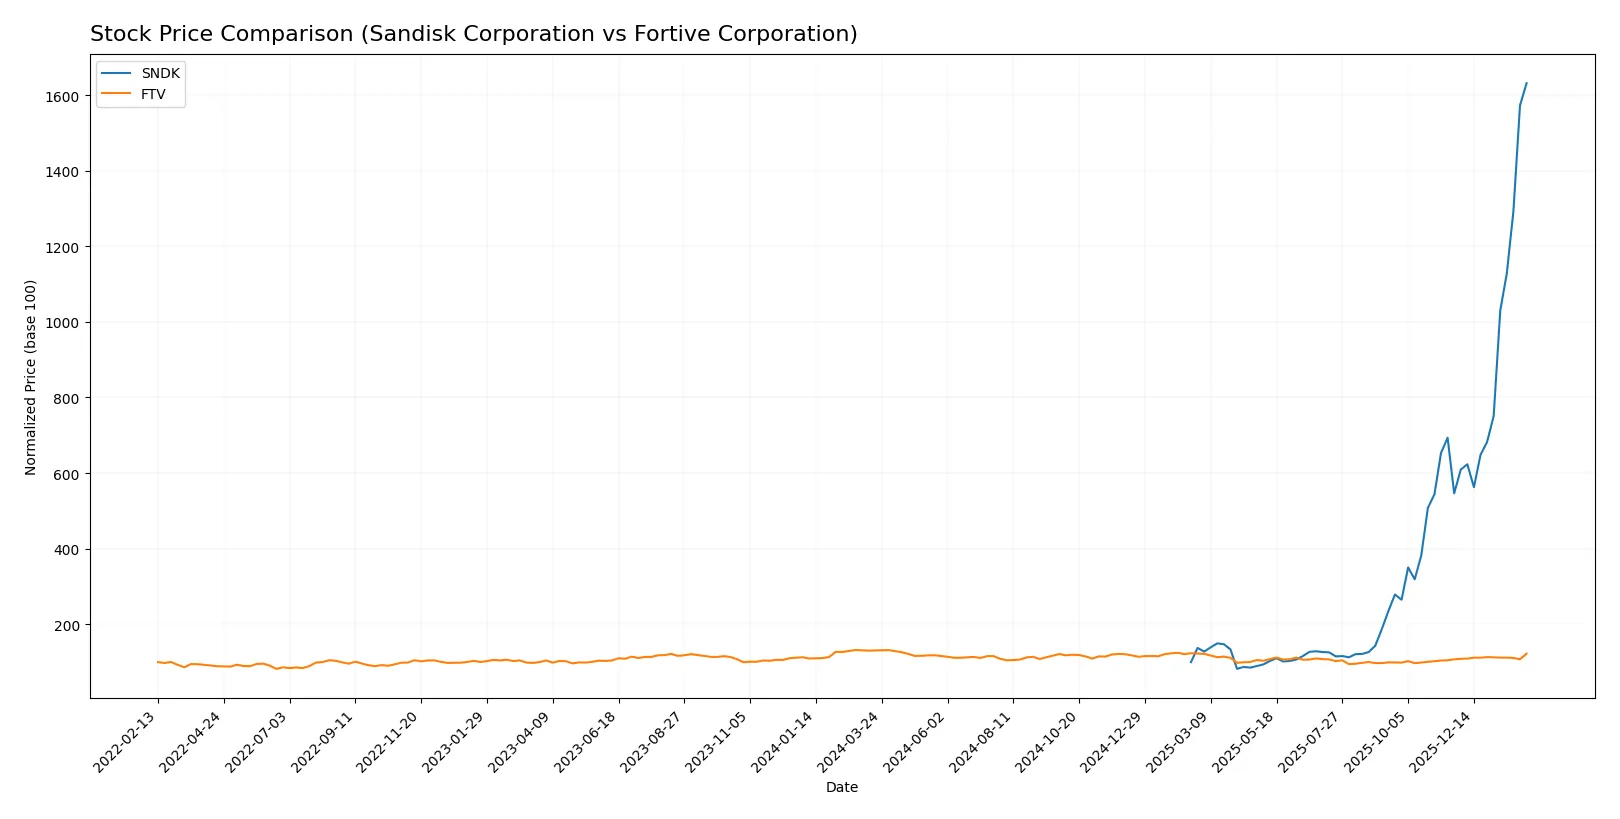
Trend Comparison
Sandisk’s stock gained 1531.51% over the past year, clearly bullish with accelerating momentum and a high volatility of 140.01. It reached a peak of 597.95 and a low of 30.11.
Fortive’s stock fell 6.53% over the same period, marking a bearish trend with accelerating decline. Its volatility remained low at 4.16, with prices ranging between 46.55 and 64.82.
Comparing trends, Sandisk delivered substantially higher returns and stronger momentum than Fortive, outperforming across all measured metrics.
Target Prices
Analysts present a clear target price consensus for Sandisk Corporation and Fortive Corporation.
| Company | Target Low | Target High | Consensus |
|---|---|---|---|
| Sandisk Corporation | 220 | 1000 | 675 |
| Fortive Corporation | 51 | 70 | 61 |
Sandisk’s target consensus at 675 suggests upside from its current price of 598, reflecting strong growth expectations. Fortive’s consensus of 61 closely aligns with its current price near 60, indicating a stable outlook.

Don’t Let Luck Decide Your Entry Point
Optimize your entry points with our advanced ProRealTime indicators. You’ll get efficient buy signals with precise price targets for maximum performance. Start outperforming now!
How do institutions grade them?
Sandisk Corporation Grades
Here are the latest institutional grades for Sandisk Corporation from major firms:
| Grading Company | Action | New Grade | Date |
|---|---|---|---|
| Barclays | Maintain | Equal Weight | 2026-02-02 |
| Citigroup | Maintain | Buy | 2026-02-02 |
| Morgan Stanley | Maintain | Overweight | 2026-01-30 |
| RBC Capital | Maintain | Sector Perform | 2026-01-30 |
| Jefferies | Maintain | Buy | 2026-01-30 |
| Goldman Sachs | Maintain | Buy | 2026-01-30 |
| Cantor Fitzgerald | Maintain | Overweight | 2026-01-30 |
| Wedbush | Maintain | Outperform | 2026-01-30 |
| Citigroup | Maintain | Buy | 2026-01-20 |
| Wells Fargo | Maintain | Equal Weight | 2026-01-15 |
Fortive Corporation Grades
Below are recent grades for Fortive Corporation from recognized institutional analysts:
| Grading Company | Action | New Grade | Date |
|---|---|---|---|
| Wells Fargo | Maintain | Equal Weight | 2026-02-05 |
| RBC Capital | Maintain | Sector Perform | 2026-02-05 |
| Citigroup | Maintain | Neutral | 2026-02-05 |
| JP Morgan | Downgrade | Underweight | 2026-01-16 |
| Mizuho | Downgrade | Underperform | 2026-01-05 |
| Wells Fargo | Maintain | Equal Weight | 2025-12-22 |
| Citigroup | Maintain | Neutral | 2025-12-08 |
| Morgan Stanley | Maintain | Equal Weight | 2025-11-05 |
| Baird | Maintain | Outperform | 2025-11-04 |
| JP Morgan | Maintain | Neutral | 2025-10-30 |
Which company has the best grades?
Sandisk consistently receives positive ratings such as Buy, Overweight, and Outperform. Fortive’s grades trend more cautiously, including Neutral, Equal Weight, and notable downgrades. Sandisk’s stronger grades suggest greater institutional confidence, potentially impacting investor sentiment positively.
Risks specific to each company
The following categories identify the critical pressure points and systemic threats facing both firms in the 2026 market environment:
1. Market & Competition
Sandisk Corporation
- Faces aggressive competition in NAND flash and storage tech, with high beta signaling market sensitivity.
Fortive Corporation
- Diversified industrial portfolio cushions competitive pressures; moderate beta reflects stable market exposure.
2. Capital Structure & Debt
Sandisk Corporation
- Low debt-to-equity (0.22), moderate leverage, but poor interest coverage raises liquidity concerns.
Fortive Corporation
- Higher debt-to-equity (0.5) but strong interest coverage (7x) demonstrates manageable debt risk.
3. Stock Volatility
Sandisk Corporation
- Extremely high beta (4.8) indicates severe stock price swings and investor risk.
Fortive Corporation
- Beta near 1.0 implies stock price closely follows the market, suggesting lower volatility risk.
4. Regulatory & Legal
Sandisk Corporation
- Operates in tech hardware with evolving data protection regulations, risk of compliance costs.
Fortive Corporation
- Diverse industrial operations expose it to multiple regulatory regimes, but with established compliance infrastructure.
5. Supply Chain & Operations
Sandisk Corporation
- High reliance on semiconductor supply chains vulnerable to global shortages and geopolitical disruptions.
Fortive Corporation
- Broad industrial segments mitigate supply chain risks through diversified sourcing and service models.
6. ESG & Climate Transition
Sandisk Corporation
- Faces pressure to reduce carbon footprint in manufacturing NAND flash memory components.
Fortive Corporation
- Stronger ESG integration across segments supports smoother climate transition and regulatory compliance.
7. Geopolitical Exposure
Sandisk Corporation
- Significant exposure to US-China trade tensions impacting semiconductor supply and sales.
Fortive Corporation
- Global footprint with balanced risk; less concentrated exposure to any single geopolitical hotspot.
Which company shows a better risk-adjusted profile?
Sandisk’s greatest risk lies in its extreme stock volatility and deteriorating profitability, as shown by a -22% net margin and very unfavorable financial ratings. Fortive’s key risk is its higher leverage, though it compensates with solid interest coverage and diversified operations. Fortive’s safer Altman Z-score (3.58 vs. Sandisk’s 19.18 but with weak profitability) and stronger Piotroski score indicate a superior risk-adjusted profile. The stark contrast in betas confirms Fortive’s market stability advantage over Sandisk’s highly volatile stock.
Final Verdict: Which stock to choose?
Sandisk Corporation’s superpower lies in its remarkable liquidity and asset management, reflected in a strong current ratio and efficient fixed asset turnover. However, its persistent value destruction and declining profitability remain points of vigilance. It could suit aggressive growth portfolios willing to tolerate operational headwinds for potential turnaround gains.
Fortive Corporation benefits from a strategic moat rooted in consistent operating profitability and improving ROIC trends, supported by a robust income quality and manageable debt levels. Compared to Sandisk, it offers better stability but commands a premium valuation. It fits well within GARP portfolios seeking steady growth with reasonable risk.
If you prioritize high liquidity and turnaround potential, Sandisk commands attention despite its financial challenges. However, if you seek better stability and a proven moat with moderate growth, Fortive outshines as the more prudent analytical scenario. Both carry risks that require close monitoring of profitability and capital efficiency trends.
Disclaimer: Investment carries a risk of loss of initial capital. The past performance is not a reliable indicator of future results. Be sure to understand risks before making an investment decision.
Go Further
I encourage you to read the complete analyses of Sandisk Corporation and Fortive Corporation to enhance your investment decisions: