Home > Comparison > Technology > FTV vs OUST
The strategic rivalry between Fortive Corporation and Ouster, Inc. shapes the future of the technology sector’s hardware and equipment industry. Fortive operates as a diversified industrial powerhouse with broad product lines and established brands. In contrast, Ouster focuses on cutting-edge digital lidar sensors, embracing rapid innovation in a niche market. This analysis aims to identify which business model delivers superior risk-adjusted returns for a balanced portfolio amid evolving technology demands.

Table of contents
Companies Overview
Fortive Corporation and Ouster, Inc. stand as key players shaping the hardware and equipment sector with distinct market approaches.
Fortive Corporation: Diversified Industrial Technology Leader
Fortive dominates as a provider of engineered products and software services across multiple industries. Its revenue stems from connected reliability tools, enterprise software, and precision test instruments. In 2026, Fortive focuses on expanding its Intelligent Operating Solutions and Advanced Healthcare Solutions segments to deepen market penetration and enhance operational efficiency.
Ouster, Inc.: Innovator in Digital Lidar Technology
Ouster specializes in high-resolution digital lidar sensors and software for 3D vision applications in robotics, vehicles, and infrastructure. Its business model hinges on selling cutting-edge scanning and solid-state flash sensors. The company’s 2026 strategy centers on scaling production and broadening adoption of its lidar systems across autonomous and industrial markets.
Strategic Collision: Similarities & Divergences
Fortive applies a broad, diversified industrial platform approach, contrasting with Ouster’s focused innovation in lidar technology. Their competition unfolds in the hardware and equipment ecosystem but targets different end markets—Fortive in industrial and healthcare sectors, Ouster in autonomous systems. This divergence creates distinct investment profiles: Fortive offers stable, multi-segment exposure while Ouster presents a higher-risk, high-growth proposition.
Income Statement Comparison
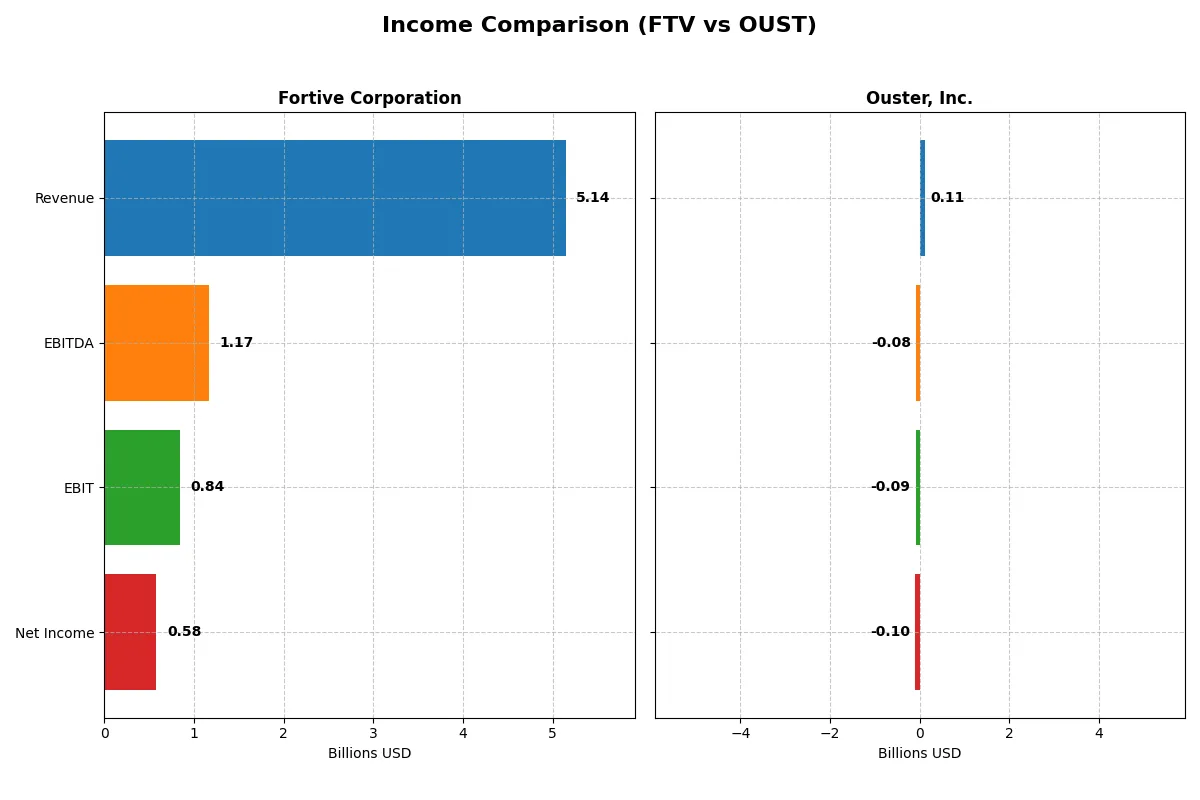
This data dissects the core profitability and scalability of both corporate engines to reveal who dominates the bottom line:
| Metric | Fortive Corporation (FTV) | Ouster, Inc. (OUST) |
|---|---|---|
| Revenue | 5.14B | 111.1M |
| Cost of Revenue | 2.01B | 70.6M |
| Operating Expenses | 2.23B | 144.6M |
| Gross Profit | 3.13B | 40.5M |
| EBITDA | 1.17B | -79.9M |
| EBIT | 843.4M | -94.7M |
| Interest Expense | 120.5M | 1.82M |
| Net Income | 579.2M | -97.0M |
| EPS | 1.75 | -2.08 |
| Fiscal Year | 2025 | 2024 |
Income Statement Analysis: The Bottom-Line Duel
The following income statement comparison reveals the true efficiency and momentum behind Fortive Corporation and Ouster, Inc.’s corporate engines.
Fortive Corporation Analysis
Fortive’s revenue declined from 6.23B in 2024 to 5.14B in 2025, dragging net income down from 833M to 579M. Despite this, it maintains a strong gross margin near 61% and a net margin above 11%, reflecting robust profitability. However, its one-year revenue and net income growth show unfavorable declines, signaling recent operational headwinds.
Ouster, Inc. Analysis
Ouster’s revenue surged 33% to 111M in 2024, with net losses narrowing from -374M to -97M. Its gross margin improved to 36%, though it remains deeply unprofitable with a negative net margin of -87%. The company exhibits high growth momentum and improving cost control, yet it still operates at a significant loss, typical for a growth-stage tech firm.
Margin Strength vs. Growth Trajectory
Fortive delivers superior profitability with stable margins, but its recent revenue and earnings contraction raise concerns about growth sustainability. Ouster impresses with rapid top-line expansion and improving losses, yet it remains far from profitability. Investors must weigh Fortive’s earnings reliability against Ouster’s growth potential and risk profile.
Financial Ratios Comparison
These vital ratios act as a diagnostic tool to expose the underlying fiscal health, valuation premiums, and capital efficiency of the companies compared below:
| Ratios | Fortive Corporation (FTV) | Ouster, Inc. (OUST) |
|---|---|---|
| ROE | 8.98% | -53.64% |
| ROIC | 7.44% | -50.84% |
| P/E | 30.16 | -5.87 |
| P/B | 2.71 | 3.15 |
| Current Ratio | 0.71 | 2.80 |
| Quick Ratio | 0.58 | 2.59 |
| D/E | 0.50 | 0.11 |
| Debt-to-Assets | 27.31% | 7.33% |
| Interest Coverage | 7.54 | -57.15 |
| Asset Turnover | 0.44 | 0.40 |
| Fixed Asset Turnover | 19.06 | 4.54 |
| Payout ratio | 15.92% | 0% |
| Dividend yield | 0.53% | 0% |
| Fiscal Year | 2025 | 2024 |
Efficiency & Valuation Duel: The Vital Signs
Financial ratios act as a company’s DNA, exposing hidden risks and uncovering operational excellence essential for sound investment decisions.
Fortive Corporation
Fortive posts a modest 8.98% ROE with a healthy 11.26% net margin, signaling moderate profitability. Its P/E ratio at 30.16 suggests the stock trades at a premium. Despite a weak current ratio of 0.71, Fortive maintains favorable debt metrics and a 0.53% dividend yield. The company balances shareholder returns with steady R&D investment, supporting sustainable growth.
Ouster, Inc.
Ouster suffers from deeply negative profitability metrics: net margin at -87.35% and ROE at -53.64%, indicating operational losses. Its P/E is negative but technically favorable due to losses, while the P/B of 3.15 suggests elevated valuation relative to book. Strong liquidity ratios (current ratio 2.8) contrast with unfavorable interest coverage and zero dividend, reflecting reinvestment into heavy R&D.
Premium Valuation vs. Operational Safety
Fortive offers a balanced risk profile with solid profitability and moderate premium valuation, while Ouster presents substantial risk due to persistent losses despite strong liquidity. Investors seeking operational stability may prefer Fortive, whereas those pursuing high-growth potential with tolerance for volatility might consider Ouster’s profile.
Which one offers the Superior Shareholder Reward?
Fortive (FTV) and Ouster (OUST) adopt starkly different shareholder reward strategies in 2026. Fortive pays a modest dividend yield of 0.53% with a low payout ratio around 16%, reflecting prudent capital allocation supported by strong free cash flow (FCF) coverage near 90%. It also engages in steady buybacks, enhancing total shareholder return sustainably. Ouster, by contrast, pays no dividends and burns FCF due to ongoing losses and negative margins. Ouster prioritizes reinvestment in growth and R&D, but its negative cash flow and lack of distribution programs impose higher risk. I conclude Fortive offers a more attractive and sustainable total return profile for investors seeking reliable shareholder rewards in 2026.
Comparative Score Analysis: The Strategic Profile
The radar chart reveals the fundamental DNA and trade-offs of Fortive Corporation and Ouster, Inc.:
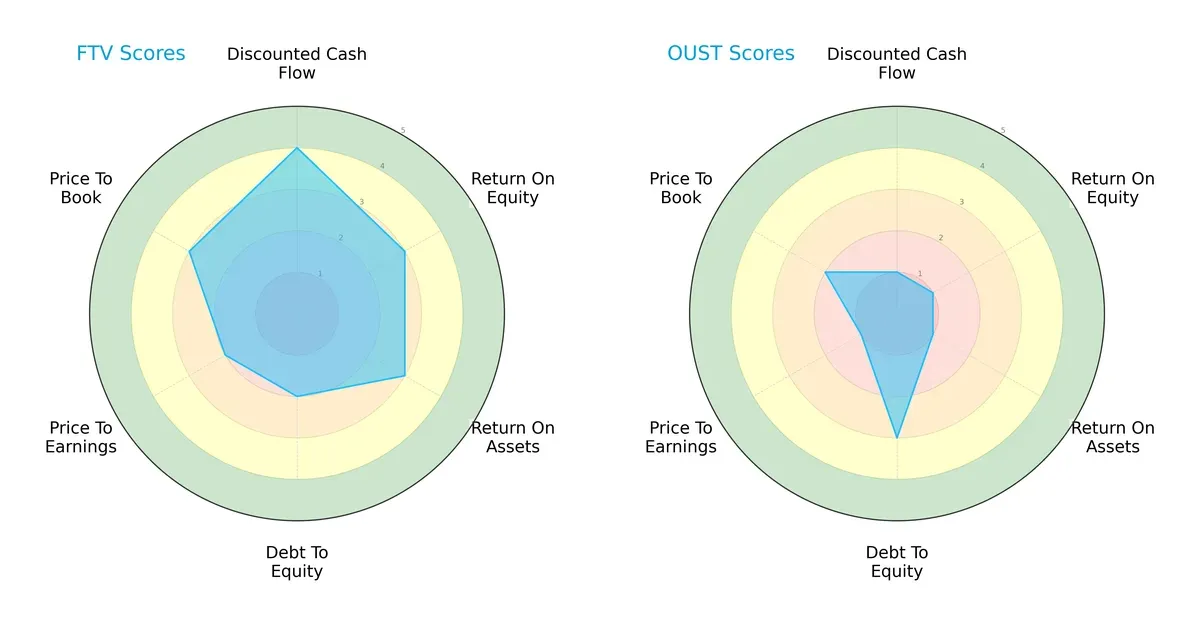
Fortive shows a balanced profile with moderate scores in ROE (3), ROA (3), and a favorable DCF (4), though its debt-to-equity (2) and valuation metrics (PE 2, PB 3) signal caution. Ouster leans heavily on stronger debt management (3) but suffers from very unfavorable operational and valuation scores (all 1s except PB at 2). Fortive’s diversity in strengths contrasts with Ouster’s reliance on financial structure rather than profitability or cash flow.
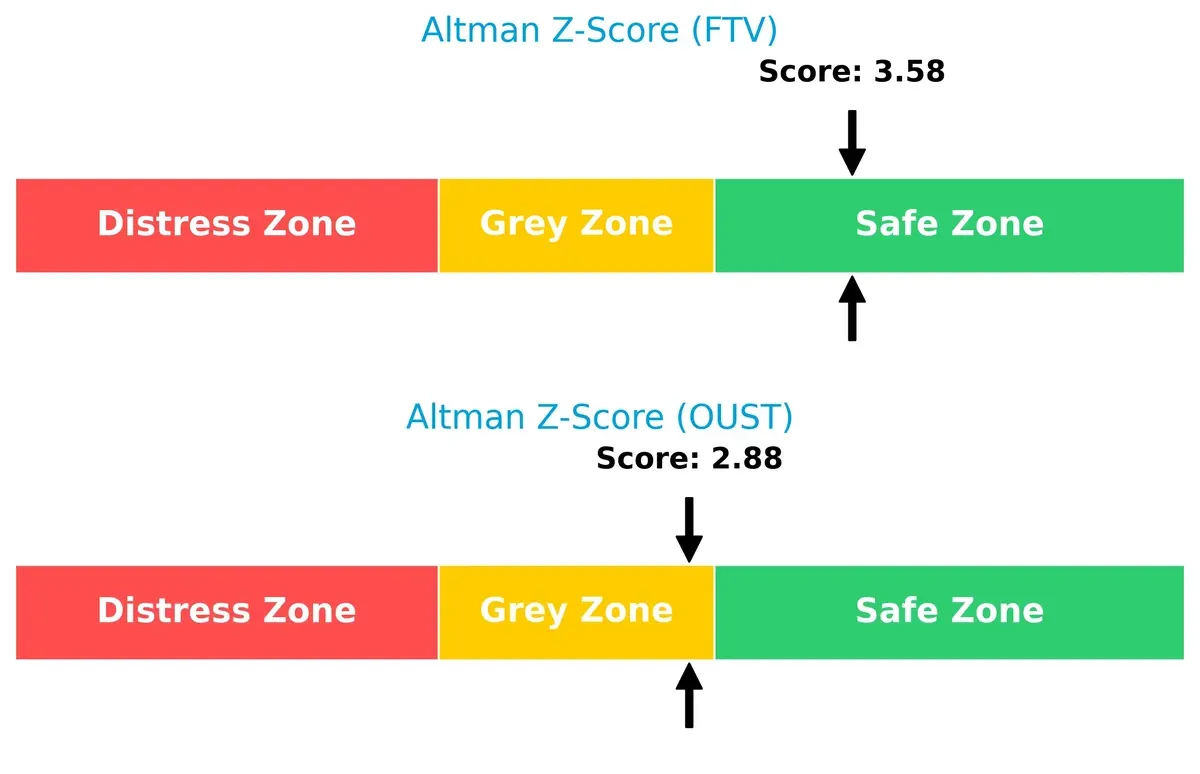
Bankruptcy Risk: Solvency Showdown
Fortive’s Altman Z-Score of 3.58 places it safely above bankruptcy risk, while Ouster’s 2.88 sits in the grey zone, implying moderate survival risk in this cycle:
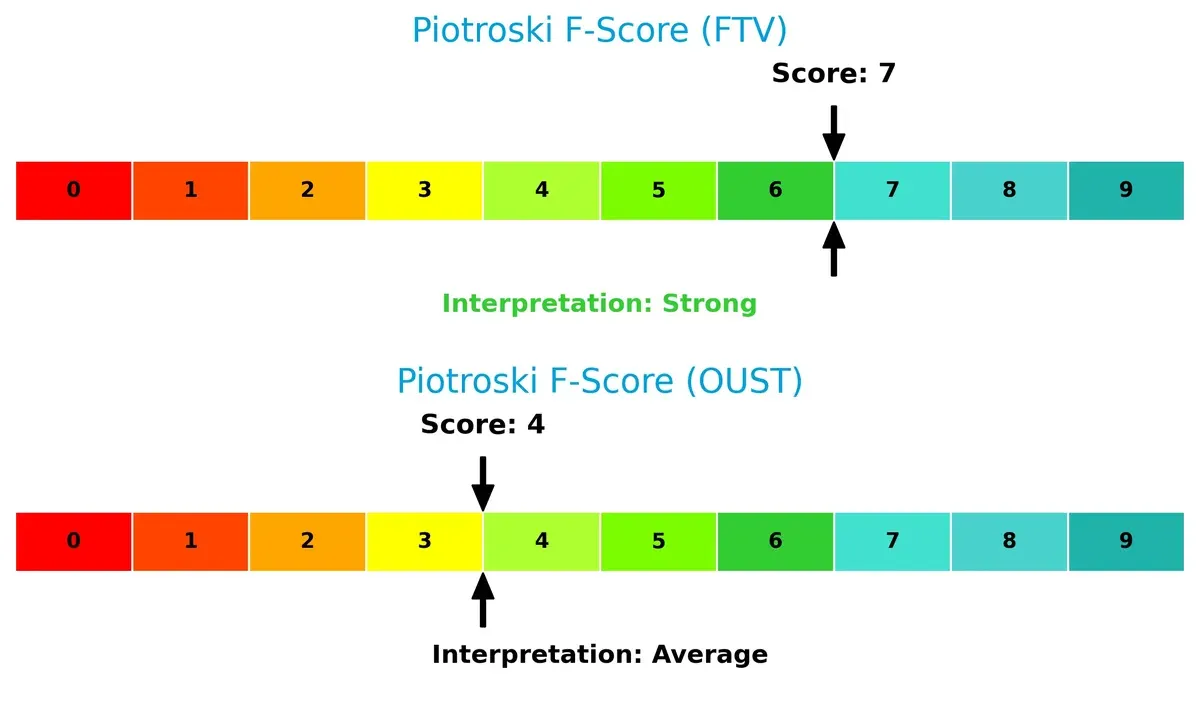
Financial Health: Quality of Operations
Fortive’s Piotroski F-Score of 7 indicates strong financial health, whereas Ouster scores only 4, suggesting weaker operational quality and potential red flags in internal metrics:
How are the two companies positioned?
This section dissects Fortive and Ouster’s operational DNA by comparing revenue distribution and internal dynamics. The goal is to confront their economic moats and identify which model delivers the most resilient competitive advantage today.
Revenue Segmentation: The Strategic Mix
The following visual comparison dissects how Fortive Corporation and Ouster, Inc. diversify their income streams and where their primary sector bets lie:
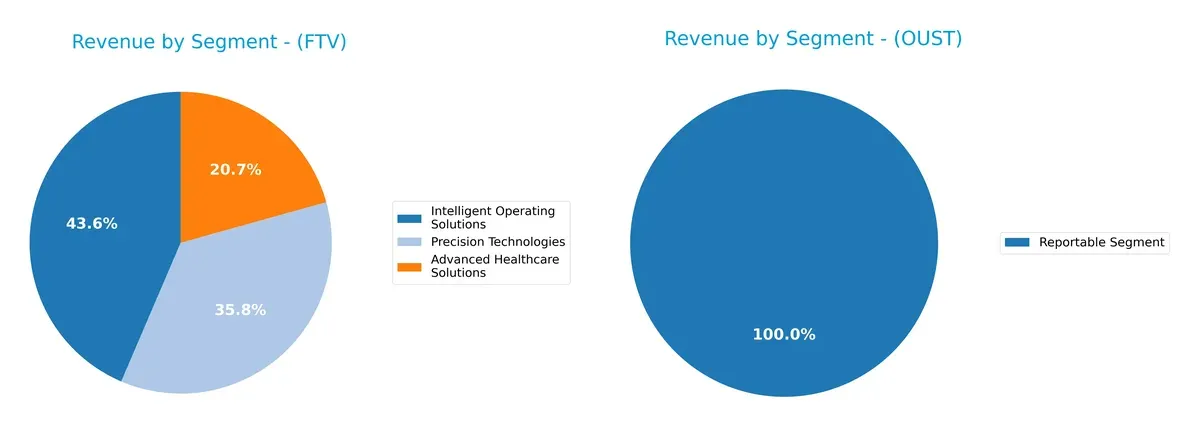
Fortive dominates with a well-balanced portfolio: Intelligent Operating Solutions at $2.7B, Precision Technologies at $2.2B, and Advanced Healthcare Solutions at $1.3B. This multi-segment approach mitigates concentration risk and leverages ecosystem lock-in. Ouster, however, relies almost exclusively on one segment, reporting $111M from a single “Reportable Segment,” exposing it to higher revenue volatility and less strategic diversification.
Strengths and Weaknesses Comparison
This table contrasts the key Strengths and Weaknesses of Fortive Corporation and Ouster, Inc.:
Fortive Corporation Strengths
- Diverse revenue streams across Advanced Healthcare, Intelligent Operating, and Precision Technologies
- Solid net margin at 11.26%
- Favorable debt metrics with 0.5 debt-to-equity and 27.31% debt-to-assets
- Strong fixed asset turnover at 19.06
- Broad geographic presence including US, China, and other countries
Ouster, Inc. Strengths
- Favorable liquidity with current ratio of 2.8 and quick ratio of 2.59
- Low leverage evidenced by 0.11 debt-to-equity and 7.33% debt-to-assets
- Favorable price-to-earnings ratio despite negative earnings
- Growing revenue in Americas, Asia Pacific, and EMEA regions
Fortive Corporation Weaknesses
- Low liquidity ratios: current ratio 0.71, quick ratio 0.58 indicate short-term risk
- Unfavorable return on equity at 8.98% below cost of capital
- High price-to-earnings ratio of 30.16 may suggest overvaluation
- Weak asset turnover at 0.44 limits asset efficiency
- Dividend yield low at 0.53%
Ouster, Inc. Weaknesses
- Negative profitability ratios: net margin -87.35%, ROE -53.64%, and ROIC -50.84%
- High weighted average cost of capital at 17.28%
- Unfavorable interest coverage at -51.94 raises solvency concerns
- Unfavorable asset turnover at 0.4 limits operational efficiency
- No dividend yield
Fortive’s strengths lie in diversified revenue and solid financial leverage but face liquidity and profitability challenges. Ouster shows robust liquidity and low leverage but suffers from severe profitability and solvency issues. These contrasts highlight differing strategic priorities and financial health profiles.
The Moat Duel: Analyzing Competitive Defensibility
A structural moat remains the only reliable shield protecting long-term profits from relentless competitive erosion. Let’s dissect how Fortive and Ouster defend their turf:
Fortive Corporation: Diversified Brand Portfolio & Intangible Asset Moat
Fortive leverages strong intangible assets and a broad brand portfolio across industrial and healthcare sectors. This manifests in stable 60.96% gross margins and disciplined margin control. However, a 17% revenue decline in 2025 signals market pressures ahead. New software and service expansions could deepen its moat if execution stays sharp.
Ouster, Inc.: Innovation-Driven Technology Moat
Ouster’s moat centers on proprietary lidar technology and rapid innovation, fueling 33% annual revenue growth and a 318% gross profit surge. Unlike Fortive’s diversified base, Ouster focuses narrowly but aggressively on 3D sensing markets. Its rising ROIC trend hints at growing efficiency, yet ongoing losses require cautious optimism.
Industrial Diversification vs. Technological Innovation
Fortive’s diverse, brand-driven moat offers more stability but faces margin compression and revenue softness. Ouster’s tech moat drives faster growth and improving profitability yet operates in a riskier, evolving niche. I see Fortive holding a wider moat today; its scale and brand breadth better defend market share against disruption.
Which stock offers better returns?
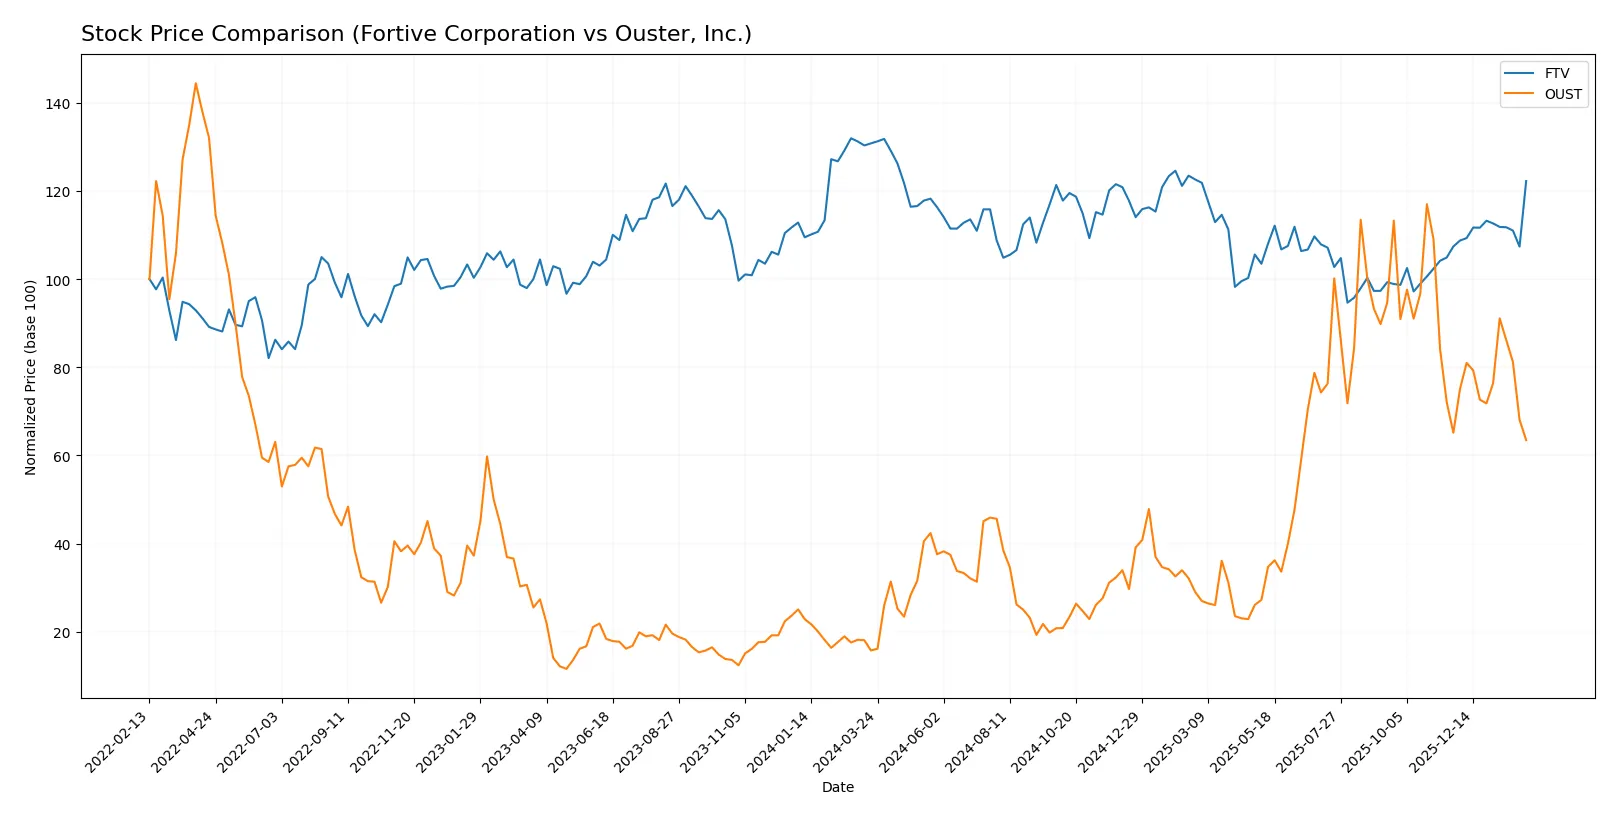
The past year reveals contrasting price dynamics: Fortive Corporation shows a prolonged decline with recent recovery, while Ouster, Inc. posts a substantial overall gain despite a recent pullback.
Trend Comparison
Fortive Corporation’s stock declined 6.53% over 12 months, signaling a bearish trend with accelerating losses. A recent 13.82% gain suggests a short-term rebound amid moderate volatility (4.16 std. dev.).
Ouster, Inc. surged 302.9% over the same period, marking a strong bullish trend with decelerating momentum. The stock hit a high of 35.8 but recently dropped 2.56%, indicating a slight short-term pullback amid higher volatility (8.53 std. dev.).
Comparing both, Ouster clearly delivered the highest market performance over the year despite recent softness, while Fortive’s trend remains predominantly negative with signs of recovery.
Target Prices
Analysts present a mixed but constructive consensus on Fortive Corporation and Ouster, Inc.
| Company | Target Low | Target High | Consensus |
|---|---|---|---|
| Fortive Corporation | 51 | 70 | 59.83 |
| Ouster, Inc. | 33 | 39 | 36.67 |
Fortive’s target consensus sits slightly below its current price of 60.12, implying modest downside risk or limited upside. Ouster’s consensus at 36.67 far exceeds its current price of 19.42, signaling strong growth expectations despite elevated volatility.

Don’t Let Luck Decide Your Entry Point
Optimize your entry points with our advanced ProRealTime indicators. You’ll get efficient buy signals with precise price targets for maximum performance. Start outperforming now!
How do institutions grade them?
Fortive Corporation Grades
The following table summarizes recent grades assigned by major institutions to Fortive Corporation:
| Grading Company | Action | New Grade | Date |
|---|---|---|---|
| Wells Fargo | Maintain | Equal Weight | 2026-02-05 |
| RBC Capital | Maintain | Sector Perform | 2026-02-05 |
| Citigroup | Maintain | Neutral | 2026-02-05 |
| JP Morgan | Downgrade | Underweight | 2026-01-16 |
| Mizuho | Downgrade | Underperform | 2026-01-05 |
Ouster, Inc. Grades
The following table summarizes recent grades assigned by major institutions to Ouster, Inc.:
| Grading Company | Action | New Grade | Date |
|---|---|---|---|
| Cantor Fitzgerald | Upgrade | Overweight | 2025-11-07 |
| Cantor Fitzgerald | Upgrade | Overweight | 2025-11-06 |
| WestPark Capital | Maintain | Buy | 2025-11-05 |
| Rosenblatt | Maintain | Buy | 2025-11-05 |
| WestPark Capital | Upgrade | Buy | 2025-08-13 |
Which company has the best grades?
Ouster, Inc. has received consistently more positive grades, including multiple upgrades to Overweight and Buy. Fortive Corporation shows more cautious sentiment with several downgrades. This contrast may influence investor confidence and portfolio positioning.
Risks specific to each company
The following categories identify critical pressure points and systemic threats facing Fortive Corporation and Ouster, Inc. in the 2026 market environment:
1. Market & Competition
Fortive Corporation
- Established in diverse industrial hardware markets with strong brand portfolio; faces intense competition in mature sectors.
Ouster, Inc.
- Operates in emerging lidar market; high innovation pace but faces competition from better-funded, larger tech firms.
2. Capital Structure & Debt
Fortive Corporation
- Moderate leverage (D/E 0.5) with favorable interest coverage (7.0); balance sheet risk is controlled.
Ouster, Inc.
- Low leverage (D/E 0.11) but negative interest coverage signals distress in covering debt costs.
3. Stock Volatility
Fortive Corporation
- Beta near 1.03 indicates market-level volatility; stable for sector standards.
Ouster, Inc.
- High beta at 2.90 reflects significant stock price swings; higher risk for investors.
4. Regulatory & Legal
Fortive Corporation
- Operates across multiple regulated industrial sectors; compliance risk moderate but manageable.
Ouster, Inc.
- Faces evolving regulations in automotive and autonomous vehicle markets; regulatory uncertainty is high.
5. Supply Chain & Operations
Fortive Corporation
- Global operations with complex supply chains; supply disruptions could impact broad product lines.
Ouster, Inc.
- Smaller scale and reliance on specialized components increase vulnerability to supply chain shocks.
6. ESG & Climate Transition
Fortive Corporation
- Mature ESG programs in place; transition risks present but mitigated by diversified industrial exposure.
Ouster, Inc.
- Emerging ESG policies; risk from climate regulation impact on product adoption and manufacturing.
7. Geopolitical Exposure
Fortive Corporation
- Global footprint exposes it to trade tensions but diversified markets reduce concentrated risk.
Ouster, Inc.
- Concentrated US market focus reduces geopolitical diversification but also limits exposure.
Which company shows a better risk-adjusted profile?
Fortive’s key risk lies in liquidity constraints, highlighted by weak current and quick ratios despite solid profitability and credit metrics. Ouster’s most severe risk is its negative profitability and interest coverage, reflecting operational losses and financial strain. Overall, Fortive shows a stronger risk-adjusted profile, supported by a safe-zone Altman Z-Score (3.58) and a strong Piotroski Score (7). Ouster remains in the grey zone (Z-Score 2.88) with average financial strength and higher stock volatility, reflecting elevated risk. Fortive’s more balanced capital structure and stable market position justify greater investor confidence amid 2026’s turbulent tech and industrial cycles.
Final Verdict: Which stock to choose?
Fortive Corporation’s superpower lies in its operational resilience and improving profitability amid a tough revenue environment. Its point of vigilance is a weak liquidity position, signaling potential short-term stress. It fits best within portfolios seeking stable industrial growth with measured risk tolerance.
Ouster, Inc. boasts a strategic moat rooted in rapid revenue expansion and deep R&D investment, driving innovation in the lidar space. Relative to Fortive, it offers higher liquidity and lower financial risk but remains loss-making. Ouster suits growth-oriented investors embracing volatility for long-term payoff.
If you prioritize consistent cash generation and operational efficiency, Fortive is the compelling choice due to its improving profitability and industrial foothold. However, if you seek high-growth exposure with innovation upside and can tolerate losses, Ouster offers better growth momentum and strategic positioning. Both present distinct risk-reward profiles requiring alignment with investor risk appetite.
Disclaimer: Investment carries a risk of loss of initial capital. The past performance is not a reliable indicator of future results. Be sure to understand risks before making an investment decision.
Go Further
I encourage you to read the complete analyses of Fortive Corporation and Ouster, Inc. to enhance your investment decisions: