Home > Comparison > Technology > FTV vs NOVT
The strategic rivalry between Fortive Corporation and Novanta Inc. shapes the evolving landscape of the technology sector. Fortive operates as a diversified industrial technology firm, delivering engineered products and software across multiple verticals. Novanta focuses on photonics and precision motion solutions, targeting niche medical and industrial markets. This analysis evaluates their distinct operational models to identify which company offers a superior risk-adjusted return for a diversified portfolio in 2026.

Table of contents
Companies Overview
Fortive Corporation and Novanta Inc. hold critical roles in the technology-driven hardware and equipment sector with distinct market approaches.
Fortive Corporation: Diverse Industrial Technology Leader
Fortive operates primarily in the hardware and equipment space, generating revenue from professional and engineered products across multiple industries. Its core revenue streams include intelligent operating solutions, precision technologies, and advanced healthcare products. In 2026, Fortive emphasizes expanding connected tools and enterprise software to deepen integration in manufacturing and healthcare verticals.
Novanta Inc.: Precision Photonics and Motion Innovator
Novanta specializes in photonics, vision, and precision motion components for medical and industrial OEMs. Its business revolves around laser systems, medical-grade visualization, and motion control technologies. The company’s 2026 strategy focuses on advancing photonics applications and enhancing medical device integration to capitalize on growing demand in life sciences and industrial processing.
Strategic Collision: Similarities & Divergences
Both companies operate in hardware and equipment but differ in focus—Fortive champions broad industrial software and services, while Novanta pursues niche photonics and precision motion technologies. Their competition centers on specialized technology adoption in medical and industrial markets. Fortive’s diversified portfolio contrasts with Novanta’s concentrated innovation, defining distinct risk and growth profiles for investors.
Income Statement Comparison
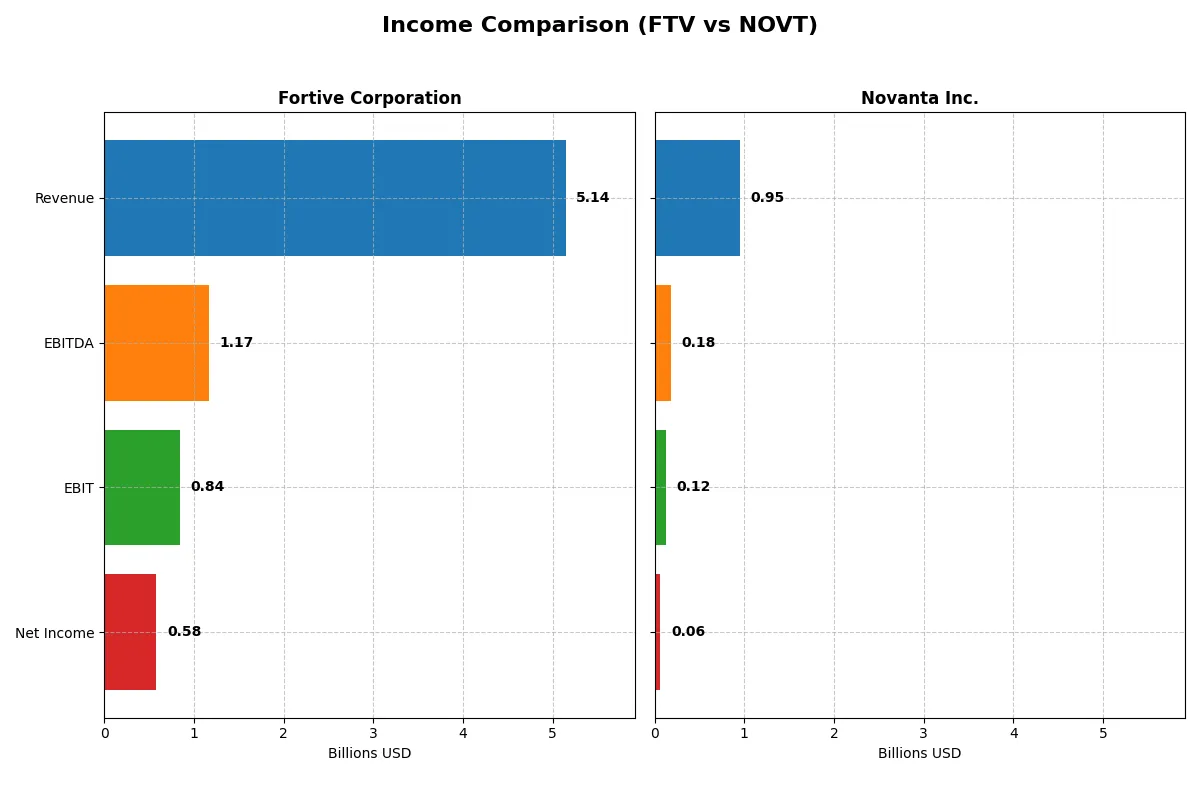
This data dissects the core profitability and scalability of both corporate engines to reveal who dominates the bottom line:
| Metric | Fortive Corporation (FTV) | Novanta Inc. (NOVT) |
|---|---|---|
| Revenue | 5.14B | 949M |
| Cost of Revenue | 2.01B | 528M |
| Operating Expenses | 2.23B | 311M |
| Gross Profit | 3.13B | 422M |
| EBITDA | 1.17B | 180M |
| EBIT | 843M | 124M |
| Interest Expense | 121M | 31M |
| Net Income | 579M | 64M |
| EPS | 1.75 | 1.78 |
| Fiscal Year | 2025 | 2024 |
Income Statement Analysis: The Bottom-Line Duel
This income statement comparison reveals how efficiently Fortive Corporation and Novanta Inc. convert revenue into profit and sustain margins over recent years.
Fortive Corporation Analysis
Fortive’s revenue peaked at 6.23B in 2024 but declined 17.5% to 5.14B in 2025, dragging net income down from 833M to 579M. Its gross margin remains strong at nearly 61%, and net margin at 11.3% is favorable versus sector norms. However, recent declines in revenue and earnings signal weakening momentum and operational challenges.
Novanta Inc. Analysis
Novanta’s revenue grew steadily by 7.7% to 949M in 2024, supporting net income of 64M despite a one-year net margin contraction to 6.75%. The company maintains a solid gross margin of 44.4% and a stable EBIT margin above 13%. Novanta’s consistent revenue and net income growth over five years reflect improving operational efficiency and expanding scale.
Verdict: Margin Strength vs. Growth Trajectory
Fortive offers superior margins but faces recent declines in revenue and profit, undermining momentum. Novanta delivers solid growth in revenue and net income with respectable margins but lower absolute scale. For investors, Fortive’s high margin profile contrasts with Novanta’s attractive growth trajectory, defining distinct risk-return profiles.
Financial Ratios Comparison
These vital ratios act as a diagnostic tool to expose the underlying fiscal health, valuation premiums, and capital efficiency of these companies:
| Ratios | Fortive Corporation (FTV) | Novanta Inc. (NOVT) |
|---|---|---|
| ROE | 8.98% | 8.59% |
| ROIC | 7.44% | 7.25% |
| P/E | 30.16 | 85.70 |
| P/B | 2.71 | 7.37 |
| Current Ratio | 0.71 | 2.58 |
| Quick Ratio | 0.58 | 1.72 |
| D/E (Debt to Equity) | 0.50 | 0.63 |
| Debt-to-Assets | 27.3% | 33.9% |
| Interest Coverage | 7.54 | 3.51 |
| Asset Turnover | 0.44 | 0.68 |
| Fixed Asset Turnover | 19.06 | 6.08 |
| Payout Ratio | 15.9% | 0% |
| Dividend Yield | 0.53% | 0% |
| Fiscal Year | 2025 | 2024 |
Efficiency & Valuation Duel: The Vital Signs
Financial ratios serve as a company’s DNA, unveiling hidden risks and operational strengths that raw numbers often conceal.
Fortive Corporation
Fortive posts a modest 9% ROE and a robust 11.3% net margin, signaling solid profitability but moderate shareholder returns. The stock trades at a stretched P/E of 30.16, reflecting high investor expectations. Despite a low 0.53% dividend yield, Fortive reinvests heavily in R&D to fuel growth, balancing innovation with prudent capital allocation.
Novanta Inc.
Novanta delivers a similar 8.6% ROE but a leaner 6.75% net margin, indicating tighter profit control. The valuation appears expensive with an 85.7 P/E and a 7.37 P/B multiple, illustrating stretched investor optimism. Novanta offers no dividend, prioritizing aggressive R&D investments to sustain future expansion, though at a higher risk profile.
Premium Valuation vs. Operational Safety
Fortive offers a balanced profile with moderate valuation and solid profitability, while Novanta’s premium multiples heighten risk amid slimmer margins. Investors seeking operational safety may lean toward Fortive, whereas those chasing growth might consider Novanta’s aggressive reinvestment approach.
Which one offers the Superior Shareholder Reward?
Fortive Corporation (FTV) offers a more attractive total shareholder reward than Novanta Inc. (NOVT) in 2026. FTV pays a modest but consistent dividend yielding around 0.53% with a sustainable payout ratio near 15%. Its free cash flow comfortably covers dividends, supporting steady income. FTV also runs disciplined buyback programs, enhancing shareholder value by reducing share count and improving earnings per share. In contrast, NOVT pays no dividend, relying solely on reinvestment in growth and acquisitions. However, NOVT’s sky-high valuation multiples (P/E above 80) and modest free cash flow conversion highlight risk of overvaluation. While NOVT’s reinvestment strategy may fuel future growth, FTV’s balanced distribution—dividends plus buybacks—provides reliable, sustainable returns with less valuation risk. I conclude that Fortive’s shareholder reward model outperforms Novanta for prudent investors today.
Comparative Score Analysis: The Strategic Profile
The radar chart reveals the fundamental DNA and trade-offs of Fortive Corporation and Novanta Inc., highlighting their distinct financial strengths and valuation approaches:
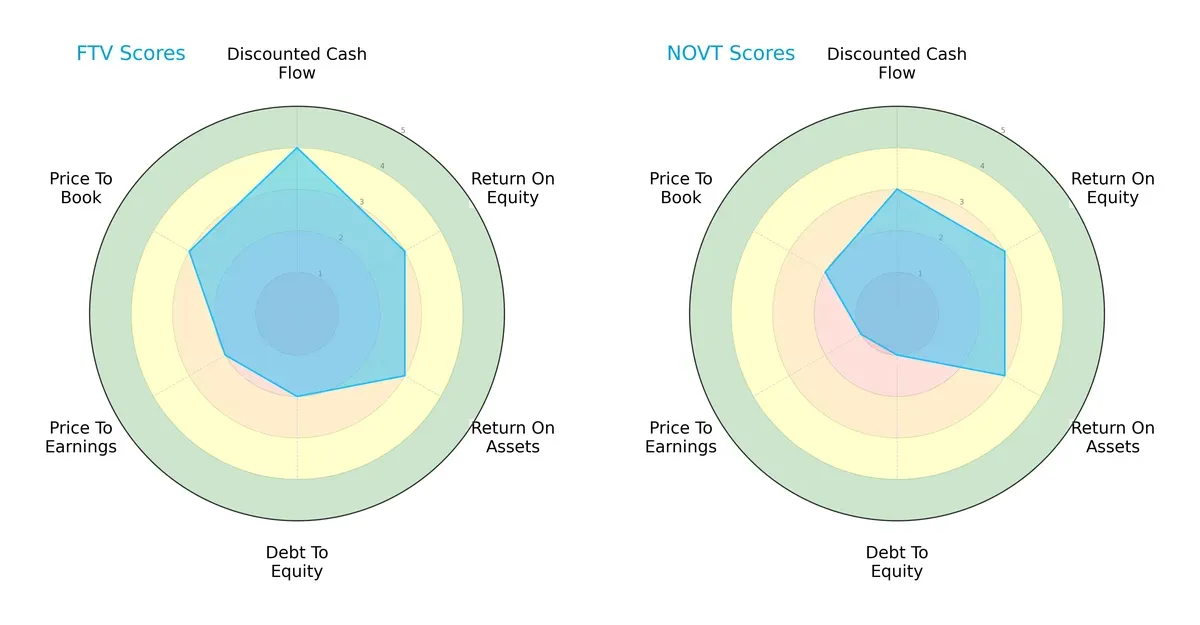
Fortive shows a more balanced profile with a stronger DCF score (4 vs. 3) and moderate returns (ROE and ROA at 3 each). Novanta matches Fortive on returns but lags significantly on debt management (1 vs. 2) and valuation metrics, scoring very unfavorably on P/E and P/B ratios. Fortive leans on better cash flow valuation and moderate leverage, while Novanta relies on operational returns despite weaker financial stability.
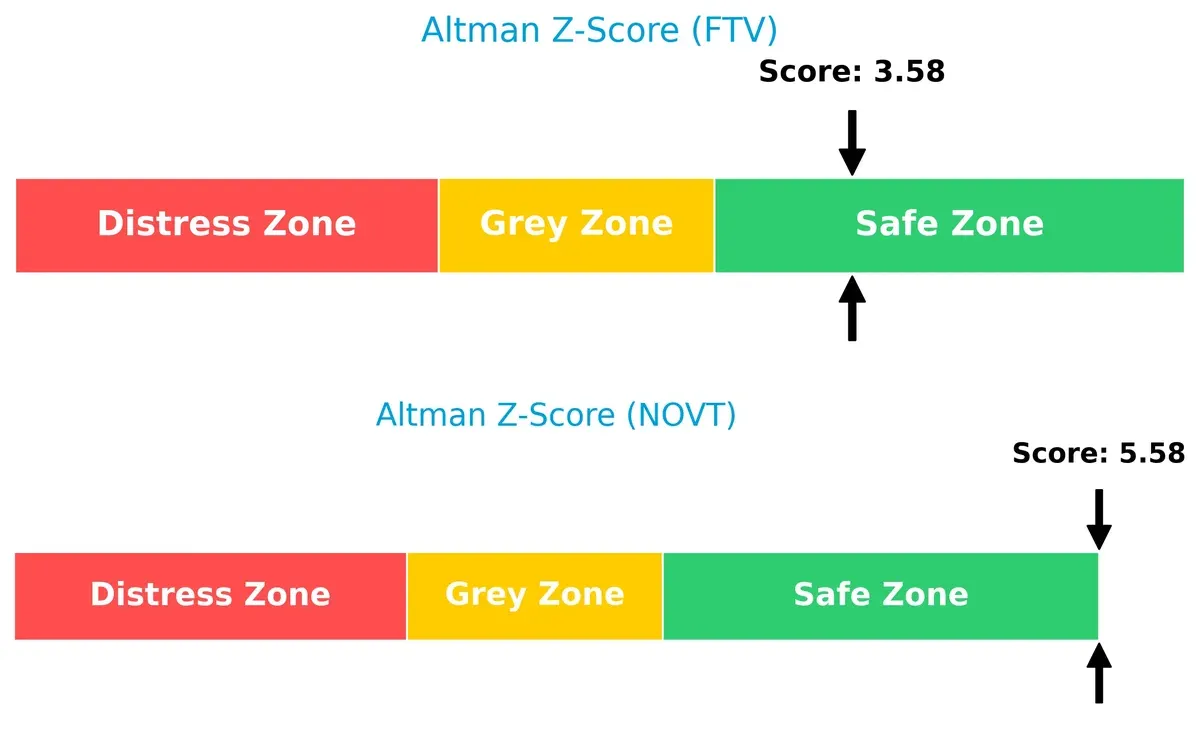
Bankruptcy Risk: Solvency Showdown
Fortive’s Altman Z-Score of 3.58 and Novanta’s 5.58 both place them well within the safe zone, with Novanta showing a stronger buffer against bankruptcy risk in this cycle:
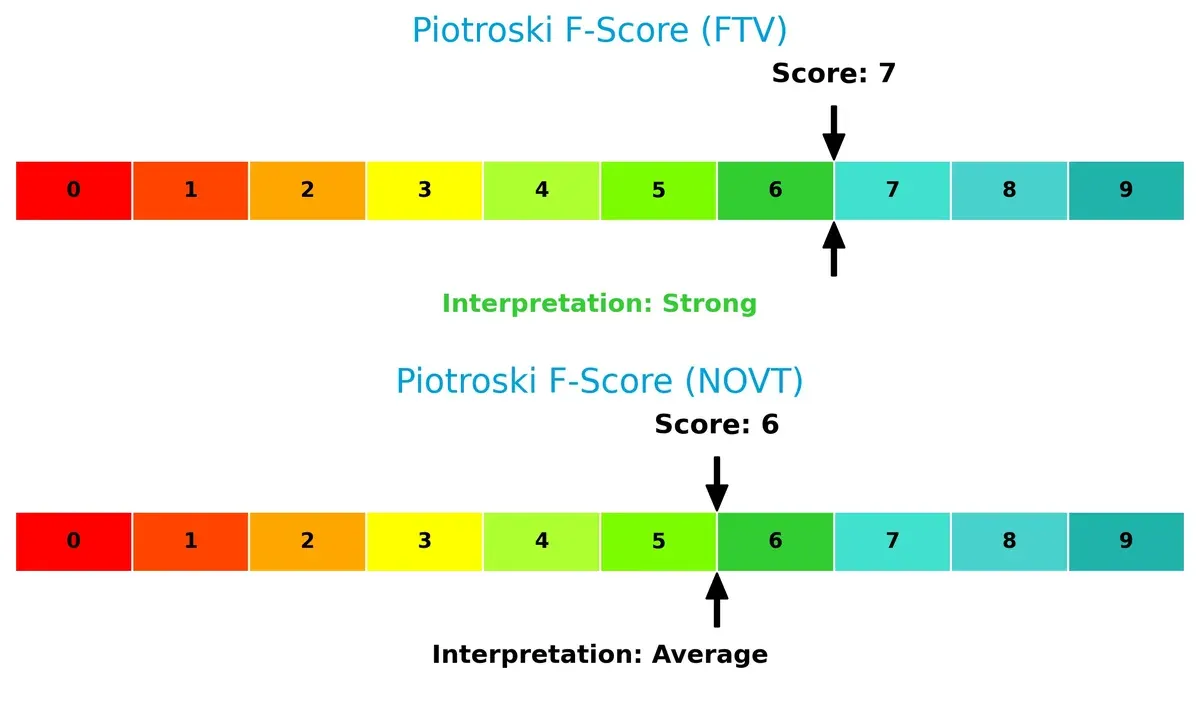
Financial Health: Quality of Operations
Fortive’s Piotroski F-Score of 7 indicates strong financial health, outperforming Novanta’s average score of 6, which suggests some internal red flags worth monitoring:
How are the two companies positioned?
This section dissects Fortive and Novanta’s operational DNA by comparing their revenue distribution and internal strengths and weaknesses. The goal: confront their economic moats to identify which model offers the most resilient competitive advantage today.
Revenue Segmentation: The Strategic Mix
This visual comparison dissects how Fortive Corporation and Novanta Inc. diversify their income streams and reveals where their primary sector bets lie:
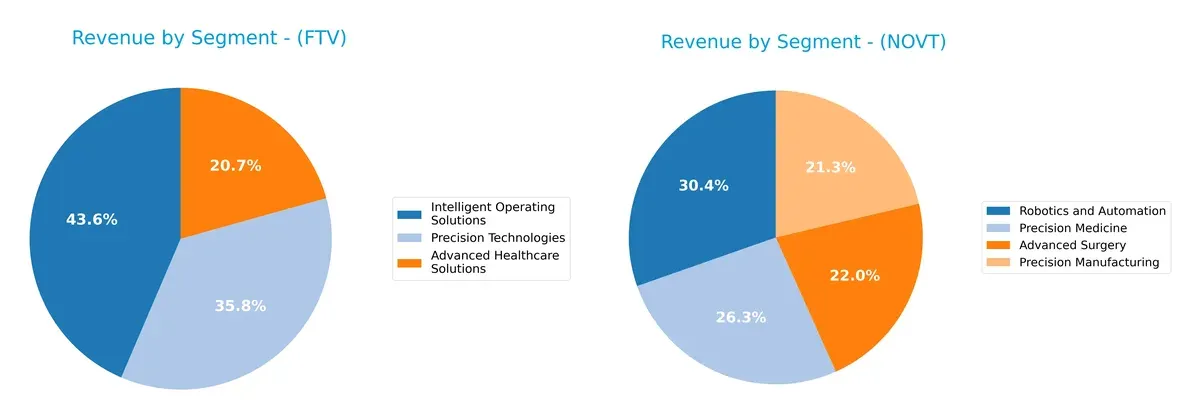
Fortive anchors its $6.2B revenue heavily in Intelligent Operating Solutions ($2.7B) and Precision Technologies ($2.2B), showing a balanced yet concentrated portfolio. Novanta’s $950M revenue splits more evenly across Robotics and Automation ($288M), Precision Medicine ($250M), and Advanced Surgery ($209M), reflecting a more diversified, innovation-driven mix. Fortive’s focus suggests infrastructure dominance, while Novanta’s spread reduces concentration risk but may face scaling challenges.
Strengths and Weaknesses Comparison
This table compares the Strengths and Weaknesses of Fortive Corporation and Novanta Inc.:
Fortive Corporation Strengths
- Diverse revenue streams across healthcare, operating, and precision tech segments
- Favorable net margin at 11.26%
- Strong fixed asset turnover at 19.06
- Solid debt-to-assets ratio at 27.31%
- Good interest coverage ratio at 7.0
- Broad global sales including US, China, and other countries
Novanta Inc. Strengths
- Diverse product segments including precision manufacturing and advanced surgery
- Strong current and quick ratios at 2.58 and 1.72 respectively
- Favorable fixed asset turnover at 6.08
- Balanced global presence with notable US and European sales
- Neutral ROIC near 7.25% supports operational efficiency
Fortive Corporation Weaknesses
- Low current and quick ratios (0.71 and 0.58) signal liquidity risk
- Unfavorable ROE at 8.98% below cost of capital
- High P/E at 30.16 may imply valuation concerns
- Low asset turnover at 0.44 limits capital efficiency
- Unfavorable dividend yield at 0.53%
- Neutral to unfavorable overall ratio profile
Novanta Inc. Weaknesses
- Unfavorable WACC at 10.93% raises capital cost
- High P/E of 85.7 and PB of 7.37 suggest overvaluation
- Unfavorable dividend yield at 0%
- Neutral interest coverage at 3.95 limits debt servicing
- Moderate debt-to-assets ratio at 33.92%
- Lower net margin at 6.75% compared to peers
Fortive’s strengths lie in profitability and asset efficiency but liquidity and valuation pose caution. Novanta shows solid liquidity and product diversity but faces valuation and capital cost challenges. Both companies display mixed financial health influencing strategic priorities.
The Moat Duel: Analyzing Competitive Defensibility
A structural moat is the only true shield protecting long-term profits from relentless competitive pressures in evolving markets:
Fortive Corporation: Diverse Product Portfolio and Intangible Assets
Fortive’s moat stems from its broad portfolio of engineered products and software, supported by strong brand recognition and recurring service revenues. Its stable margins and growing ROIC trend indicate operational efficiency. However, declining revenue signals caution as new market dynamics in 2026 could test its adaptability.
Novanta Inc.: Precision Technology and Innovation Edge
Novanta leverages cutting-edge photonics and precision motion technologies, carving a niche distinct from Fortive’s diversified hardware focus. Its improving ROIC and solid revenue growth highlight effective capital deployment. Yet, margin pressure and modest net income growth temper optimism amid potential expansion in medical imaging and industrial lasers.
Diversification vs. Innovation: The Moat Battle
Both companies show slightly unfavorable moats by ROIC vs. WACC, yet their ROIC trends are improving. Fortive’s broader product base offers deeper market defense, but Novanta’s innovation-driven niche may deliver sharper competitive barriers. Overall, Fortive appears better positioned to protect market share against broad competitive threats.
Which stock offers better returns?
The past year reveals contrasting price movements for Fortive Corporation and Novanta Inc., with both stocks showing recent acceleration despite overall declines.
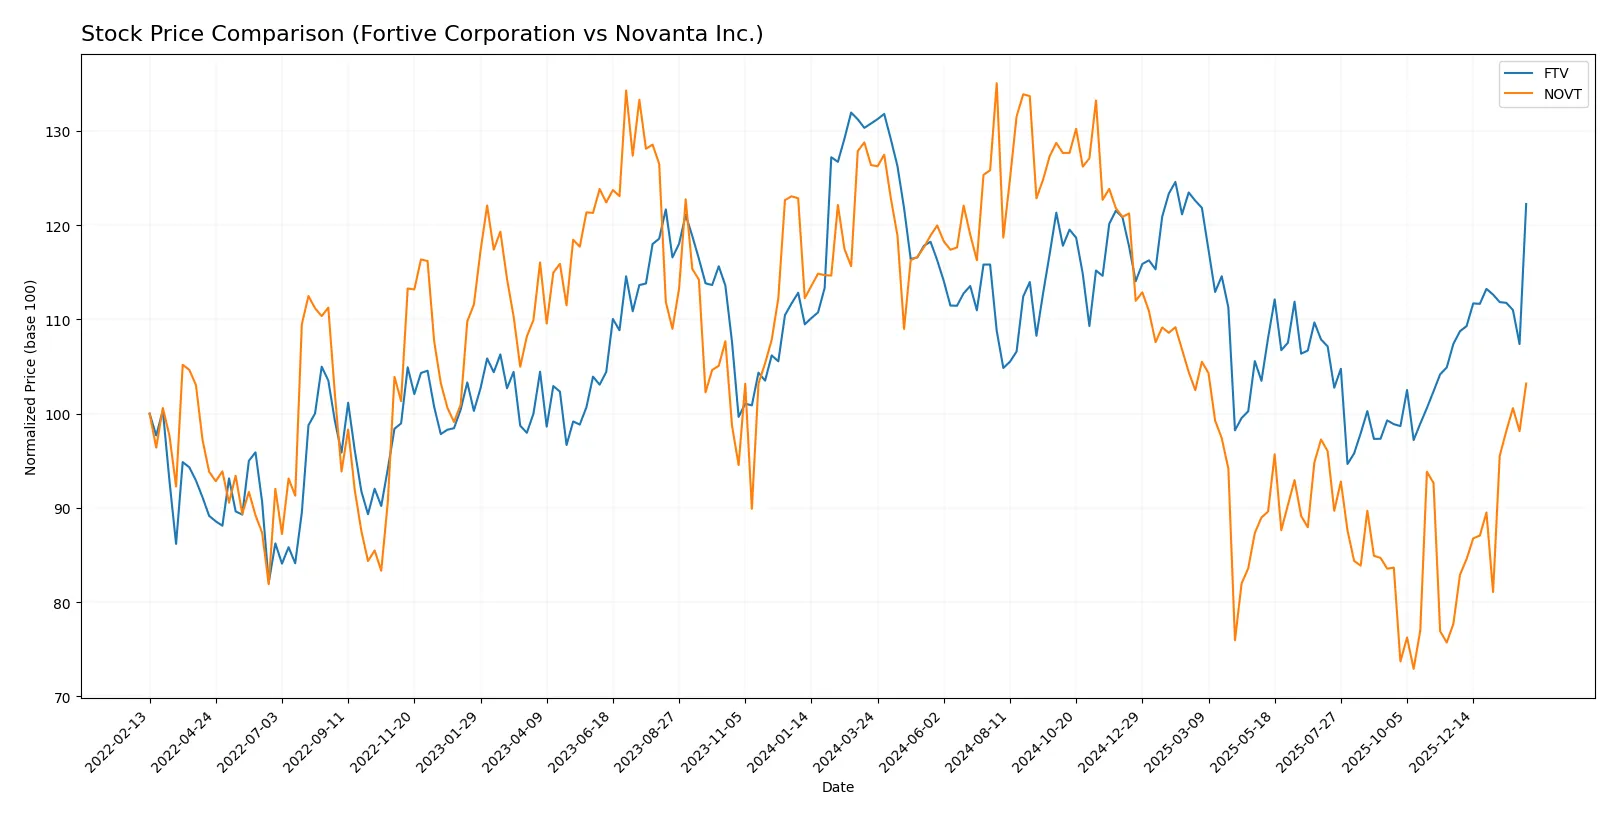
Trend Comparison
Fortive Corporation’s stock declined 6.53% over the past year, marking a bearish trend with accelerating losses. The price ranged from $46.55 to $64.82, with a recent rebound of 13.82%.
Novanta Inc. faced a steeper 18.34% drop over the year, confirming a bearish trend amid high volatility. Prices fluctuated between $99.96 and $185.16, followed by a strong 32.82% rally in recent months.
Comparing trends, Novanta’s stock delivered the highest market performance recently, despite a larger annual decline and greater price volatility than Fortive.
Target Prices
Analysts show a bullish consensus for Fortive Corporation and Novanta Inc., signaling growth potential from current prices.
| Company | Target Low | Target High | Consensus |
|---|---|---|---|
| Fortive Corporation | 51 | 70 | 59.83 |
| Novanta Inc. | 160 | 160 | 160 |
Fortive’s consensus target of 59.83 slightly undercuts its current price of 60.12, suggesting limited near-term upside. Novanta’s 160 target stands well above its 141.47 price, indicating robust analyst confidence.

Don’t Let Luck Decide Your Entry Point
Optimize your entry points with our advanced ProRealTime indicators. You’ll get efficient buy signals with precise price targets for maximum performance. Start outperforming now!
How do institutions grade them?
Fortive Corporation Grades
Here are the latest institutional grades for Fortive Corporation from major firms:
| Grading Company | Action | New Grade | Date |
|---|---|---|---|
| Wells Fargo | Maintain | Equal Weight | 2026-02-05 |
| RBC Capital | Maintain | Sector Perform | 2026-02-05 |
| Citigroup | Maintain | Neutral | 2026-02-05 |
| JP Morgan | Downgrade | Underweight | 2026-01-16 |
| Mizuho | Downgrade | Underperform | 2026-01-05 |
Novanta Inc. Grades
The following table summarizes recent grades given to Novanta Inc. by recognized institutions:
| Grading Company | Action | New Grade | Date |
|---|---|---|---|
| Baird | Maintain | Neutral | 2025-08-11 |
| William Blair | Upgrade | Outperform | 2022-05-11 |
| Berenberg | Maintain | Hold | 2020-11-13 |
Which company has the best grades?
Fortive’s grades show a mix of neutral and downgrades, indicating caution among analysts. Novanta holds a consistent neutral stance with an older outperform upgrade, suggesting moderate confidence. Investors may interpret Fortive’s recent downgrades as signals of near-term challenges, while Novanta’s steadier grades imply stability but less immediate enthusiasm.
Risks specific to each company
The following categories identify the critical pressure points and systemic threats facing both firms in the 2026 market environment:
1. Market & Competition
Fortive Corporation (FTV)
- Diversified industrial tech with broad end markets, but faces intense competition in hardware and software segments.
Novanta Inc. (NOVT)
- Focused on photonics and precision components; niche markets but exposed to rapid tech shifts and competitive innovation.
2. Capital Structure & Debt
Fortive Corporation (FTV)
- Moderate leverage (D/E 0.5), strong interest coverage (7x), but liquidity ratios below 1 signal tight short-term liquidity.
Novanta Inc. (NOVT)
- Higher leverage (D/E 0.63), weaker interest coverage (~4x), but strong liquidity ratios >2 offer cushion against short-term shocks.
3. Stock Volatility
Fortive Corporation (FTV)
- Beta near 1.03 indicates market-level volatility, suggesting moderate systematic risk exposure.
Novanta Inc. (NOVT)
- Elevated beta at 1.62 signals higher volatility and greater sensitivity to market swings, raising investor risk.
4. Regulatory & Legal
Fortive Corporation (FTV)
- Operates globally in regulated health and industrial sectors; compliance complexity could increase costs.
Novanta Inc. (NOVT)
- Medical and industrial segments face stringent regulations; innovation pace may trigger heightened scrutiny and IP risks.
5. Supply Chain & Operations
Fortive Corporation (FTV)
- Broad supply base but vulnerable to global disruptions given diverse product lines and manufacturing footprint.
Novanta Inc. (NOVT)
- Reliant on specialized components for photonics; supply chain bottlenecks could impact production and delivery timelines.
6. ESG & Climate Transition
Fortive Corporation (FTV)
- Moderate ESG exposure with opportunities in sustainability software; may face transition risks in heavy industrial segments.
Novanta Inc. (NOVT)
- ESG initiatives less transparent; potential risks from energy-intensive manufacturing and evolving regulatory demands.
7. Geopolitical Exposure
Fortive Corporation (FTV)
- Global operations expose it to trade tensions and currency fluctuations, especially in Asia and Europe.
Novanta Inc. (NOVT)
- Smaller global footprint but sensitive to US-China tech tensions affecting supply and customer base.
Which company shows a better risk-adjusted profile?
Fortive’s most impactful risk is its weak liquidity ratios, posing short-term financial strain despite solid interest coverage. Novanta’s biggest risk lies in its high valuation multiples and elevated stock volatility, increasing downside risk. Overall, Fortive displays a better risk-adjusted profile, supported by a safer Altman Z-score and stronger Piotroski score. Novanta’s stretched P/E of 85.7 and high beta at 1.62 justify caution amid market uncertainty.
Final Verdict: Which stock to choose?
Fortive Corporation’s superpower lies in its operational resilience and improving profitability amidst a challenging revenue environment. Its main point of vigilance is its stretched liquidity ratios, signaling potential short-term funding pressure. This stock fits an aggressive growth portfolio willing to tolerate cyclical headwinds for long-term value creation.
Novanta Inc. benefits from a strategic moat rooted in consistent investment in R&D and a robust balance sheet with strong liquidity. Compared to Fortive, it offers a safer profile but trades at a steep premium, reflecting high growth expectations. It suits a GARP (Growth at a Reasonable Price) strategy for investors prioritizing stability with growth potential.
If you prioritize operational strength and improving returns despite short-term liquidity constraints, Fortive outshines as the compelling choice. However, if safety and consistent innovation matter more, Novanta offers better stability albeit at a higher valuation. Both companies show growing profitability but also carry risks tied to their capital efficiency and market pricing.
Disclaimer: Investment carries a risk of loss of initial capital. The past performance is not a reliable indicator of future results. Be sure to understand risks before making an investment decision.
Go Further
I encourage you to read the complete analyses of Fortive Corporation and Novanta Inc. to enhance your investment decisions: