Home > Comparison > Technology > FTV vs MKSI
The strategic rivalry between Fortive Corporation and MKS Inc. shapes the competitive landscape of the technology sector’s hardware and equipment industry. Fortive operates as a diversified industrial technology firm, blending software and hardware solutions across multiple verticals. In contrast, MKS Inc. focuses on specialized instruments and control systems for precision manufacturing processes. This analysis evaluates which company delivers a superior risk-adjusted return, anchoring portfolio decisions on their distinct operational strategies and sector positioning.

Table of contents
Companies Overview
Fortive and MKS Inc. lead distinct niches in the hardware and equipment sector with substantial market influence.
Fortive Corporation: Intelligent Industrial Solutions Leader
Fortive dominates professional and engineered products, generating revenue through connected reliability tools and enterprise software. Its strategic focus in 2026 emphasizes digital transformation across manufacturing, healthcare, and industrial verticals. The company leverages a diverse brand portfolio including FLUKE and ACCRUENT to maintain competitive advantage.
MKS Inc.: Precision Control Systems Innovator
MKS Inc. specializes in instruments and systems that control critical manufacturing processes globally. It drives revenue via vacuum control, laser technologies, and photonics solutions. In 2026, MKS prioritizes advanced process control and laser-based equipment for semiconductor and industrial markets, highlighting its cutting-edge technology leadership.
Strategic Collision: Similarities & Divergences
Both companies target industrial hardware but diverge in approach: Fortive integrates software-heavy solutions, while MKS excels in precision instruments and laser systems. Their battleground is process optimization within manufacturing and semiconductor sectors. Fortive offers a broad platform-driven model, whereas MKS appeals through specialized, high-tech components, shaping distinct investment profiles.
Income Statement Comparison
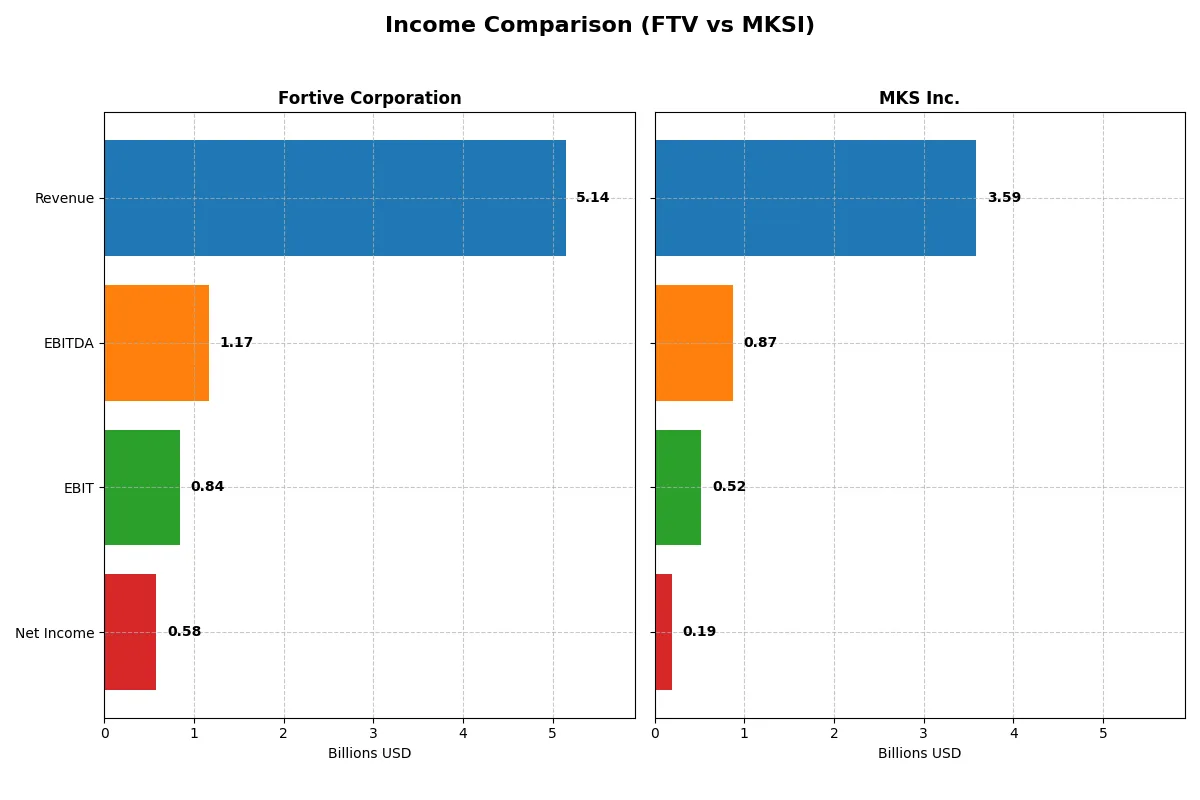
This data dissects the core profitability and scalability of both corporate engines to reveal who dominates the bottom line:
| Metric | Fortive Corporation (FTV) | MKS Inc. (MKSI) |
|---|---|---|
| Revenue | 5.14B | 3.59B |
| Cost of Revenue | 2.01B | 1.88B |
| Operating Expenses | 2.23B | 1.21B |
| Gross Profit | 3.13B | 1.71B |
| EBITDA | 1.17B | 870M |
| EBIT | 843M | 522M |
| Interest Expense | 121M | 345M |
| Net Income | 579M | 190M |
| EPS | 1.75 | 2.82 |
| Fiscal Year | 2025 | 2024 |
Income Statement Analysis: The Bottom-Line Duel
This income statement comparison reveals the true efficiency and profitability of Fortive Corporation and MKS Inc. over recent fiscal years.
Fortive Corporation Analysis
Fortive’s revenue peaked at 6.2B in 2024 but declined 17.5% to 5.1B in 2025. Net income followed suit, dropping from 833M to 579M. Despite this contraction, Fortive maintains strong gross margin at 61% and net margin at 11.3%, reflecting solid cost control. The 2025 decline signals caution, yet margins suggest operational resilience.
MKS Inc. Analysis
MKS delivered steady revenue near 3.6B in 2024, slightly down by 1%, while net income rebounded sharply to 190M from a steep loss in 2023. Gross margin holds at 47.6%, with net margin improving to 5.3%. MKS’s recent turnaround in EBIT and net margins highlights operational recovery and improved earnings efficiency after prior volatility.
Margin Strength vs. Earnings Stability
Fortive dominates in scale and margin robustness but faces recent revenue and earnings declines. MKS shows less scale but rebounds strongly from losses with improved profitability metrics. Fortive’s profile suits investors favoring stable margins; MKS appeals to those prioritizing earnings momentum and recovery potential.
Financial Ratios Comparison
These vital ratios act as a diagnostic tool to expose the underlying fiscal health, valuation premiums, and capital efficiency of each company:
| Ratios | Fortive Corporation (FTV) | MKS Inc. (MKSI) |
|---|---|---|
| ROE | 8.98% | 8.18% |
| ROIC | 7.44% | 6.31% |
| P/E | 30.16 | 36.98 |
| P/B | 2.71 | 3.03 |
| Current Ratio | 0.71 | 3.19 |
| Quick Ratio | 0.58 | 2.04 |
| D/E (Debt-to-Equity) | 0.50 | 2.06 |
| Debt-to-Assets | 27.3% | 55.6% |
| Interest Coverage | 7.54 | 1.44 |
| Asset Turnover | 0.44 | 0.42 |
| Fixed Asset Turnover | 19.06 | 3.55 |
| Payout Ratio | 15.9% | 31.1% |
| Dividend Yield | 0.53% | 0.84% |
| Fiscal Year | 2025 | 2024 |
Efficiency & Valuation Duel: The Vital Signs
Financial ratios serve as a company’s DNA, uncovering hidden risks and operational strengths that shape investor outcomes.
Fortive Corporation
Fortive posts a solid net margin of 11.26%, but its ROE at 8.98% lags industry leaders, signaling modest shareholder profitability. The stock trades at a stretched P/E of 30.16 and a moderate P/B of 2.71, indicating expensive valuation. Dividend yield is low at 0.53%, suggesting limited cash returns but ongoing reinvestment in R&D supports future growth.
MKS Inc.
MKS shows a weaker net margin of 5.3% and a slightly lower ROE of 8.18%, reflecting constrained profitability. Its valuation remains expensive with a P/E of 36.98 and P/B of 3.03, while a high debt-to-equity ratio of 2.06 flags financial risk. The dividend yield of 0.84% is modest, and capital allocation appears strained amid elevated leverage.
Valuation Stretch vs. Operational Balance
Fortive offers a more balanced risk profile with favorable leverage and operational efficiency despite a high valuation. MKS’s higher debt and lower profitability increase financial risk, despite similar valuation multiples. Investors seeking operational stability may prefer Fortive; those tolerating risk might weigh MKS’s growth potential more carefully.
Which one offers the Superior Shareholder Reward?
I compare Fortive Corporation (FTV) and MKS Inc. (MKSI) on dividends, payout ratios, and buybacks. FTV yields ~0.53% with a modest 16% payout, well-covered by free cash flow (90%). Its buyback program is consistent, supporting total returns sustainably. MKSI offers a higher yield (~0.84%) and a payout over 31%, but carries heavier debt (debt/equity 2.06) and weaker free cash flow coverage (~78%). MKSI’s buybacks are less reliable given leverage risks. I conclude FTV’s balanced dividends and buybacks deliver a more sustainable, attractive total return profile for 2026 investors.
Comparative Score Analysis: The Strategic Profile
The radar chart reveals the fundamental DNA and trade-offs of Fortive Corporation and MKS Inc., highlighting their financial strengths and vulnerabilities side by side:
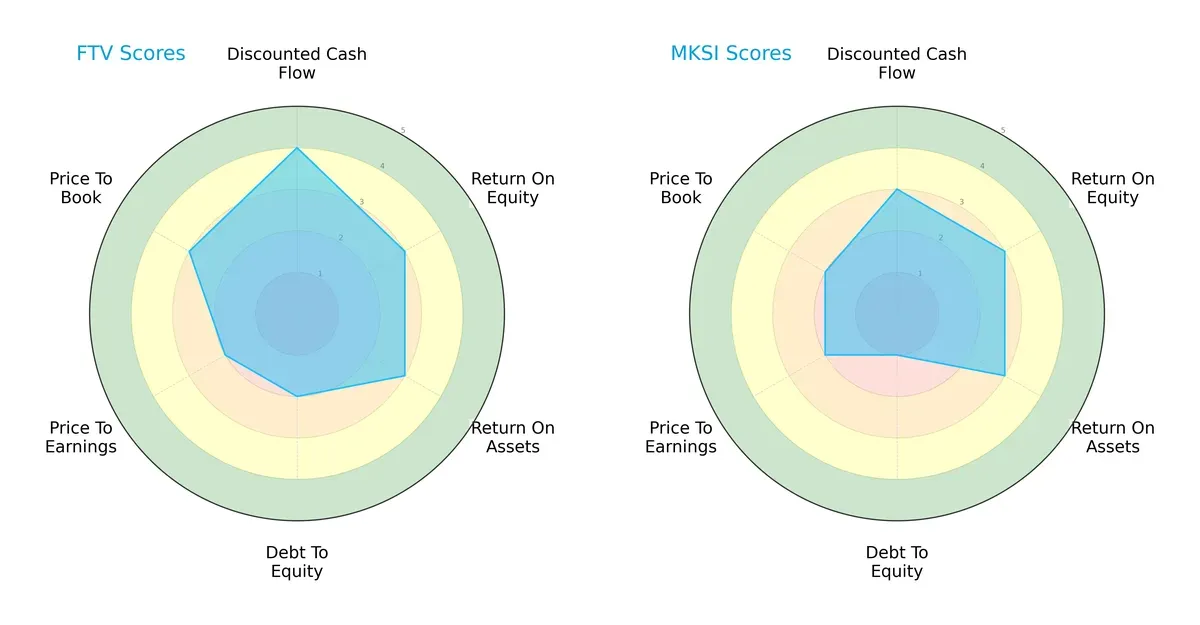
Fortive shows a more balanced profile with a strong DCF score (4) and moderate ROE (3) and ROA (3), but it carries higher leverage risk (Debt/Equity score 2) and weaker valuation metrics (P/E score 2). MKS leans on moderate operational returns (ROE and ROA at 3) but struggles with high financial risk (Debt/Equity score 1) and less favorable valuation (P/E and P/B scores at 2). Fortive’s diversified strengths offer steadier resilience, while MKS depends more heavily on operational execution despite financial fragility.
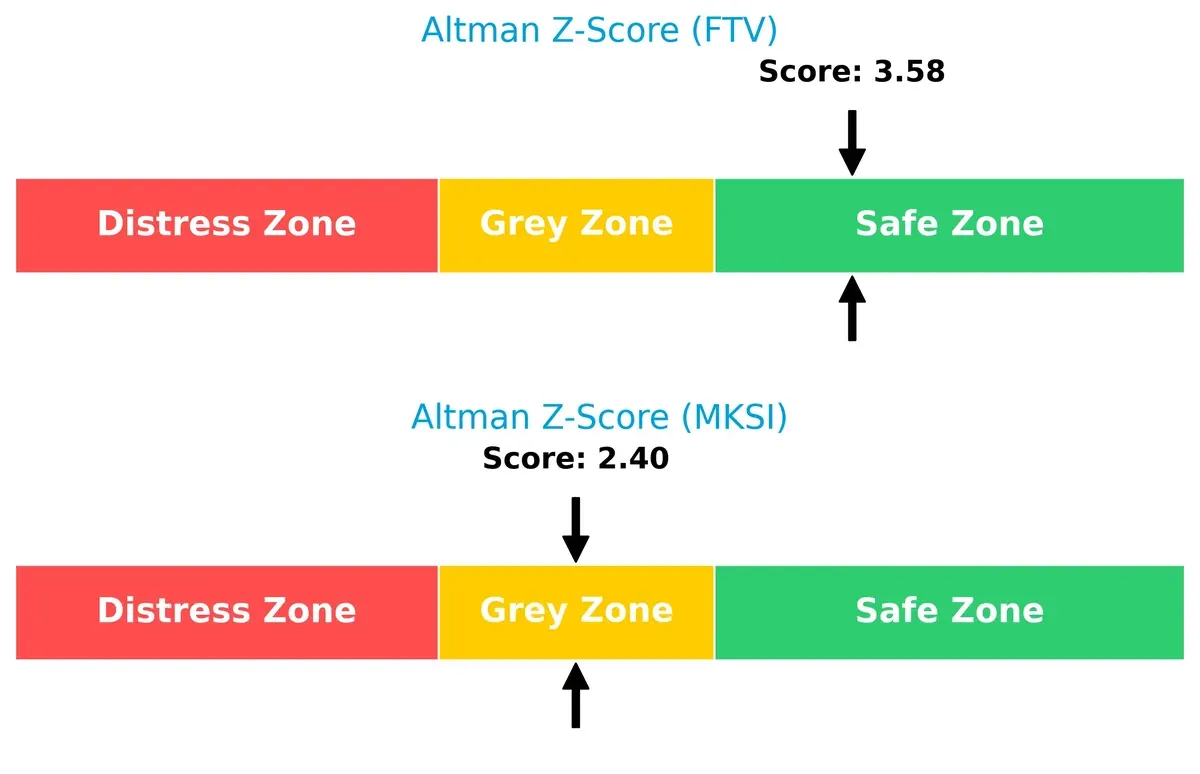
Bankruptcy Risk: Solvency Showdown
Fortive’s Altman Z-Score at 3.58 places it firmly in the safe zone, signaling strong solvency and lower bankruptcy risk. MKS’s 2.40 score lands in the grey zone, indicating moderate financial distress potential in this cycle:
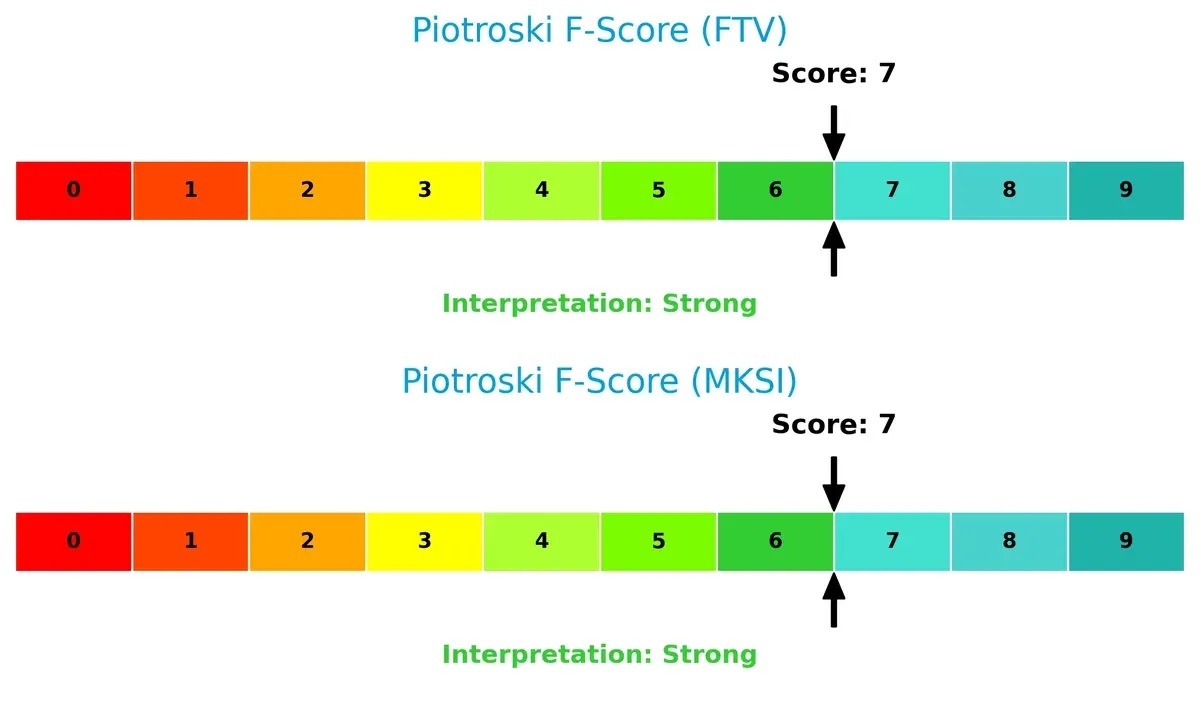
Financial Health: Quality of Operations
Both companies share a Piotroski F-Score of 7, reflecting strong financial health and operational quality. Neither exhibits red flags in internal metrics, suggesting efficient profitability and sound balance sheet management:
How are the two companies positioned?
This section dissects Fortive and MKS’s operational DNA by comparing revenue distribution and internal dynamics, including strengths and weaknesses. The goal is to confront their economic moats and identify which model offers the most resilient and sustainable competitive advantage today.
Revenue Segmentation: The Strategic Mix
This visual comparison dissects how Fortive Corporation and MKS Inc. diversify their income streams and where their primary sector bets lie:
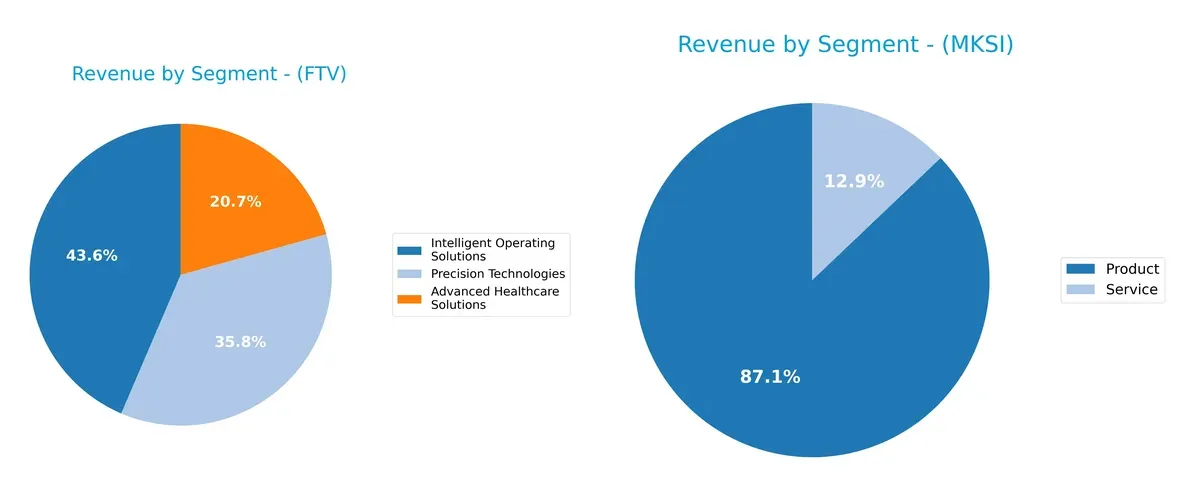
Fortive’s revenue in 2024 splits among Advanced Healthcare Solutions (1.29B), Intelligent Operating Solutions (2.71B), and Precision Technologies (2.23B), showing a balanced, diversified mix. By contrast, MKS leans heavily on its Product segment with 3.12B and a smaller Service segment at 462M. Fortive’s diversity mitigates concentration risk, while MKS’s reliance on Products anchors its strategy but increases exposure to market shifts in that core segment.
Strengths and Weaknesses Comparison
This table compares the Strengths and Weaknesses of Fortive Corporation and MKS Inc.:
Fortive Corporation Strengths
- Diversified revenue across Advanced Healthcare, Intelligent Operating, and Precision Technologies
- Favorable net margin at 11.26%
- Low debt-to-assets at 27.31% indicating financial stability
- Strong fixed asset turnover at 19.06
- Significant presence in the US with 3.37B revenue
- Balanced global footprint beyond US and China
MKS Inc. Strengths
- Diverse product and service revenue streams with over 3B in products
- Favorable quick ratio at 2.04 showing liquidity
- Favorable fixed asset turnover at 3.55
- Steady presence in Asia including China (775M) and Korea (358M)
- Global geographic reach with exposure in Japan, Singapore, Taiwan, and Europe
Fortive Corporation Weaknesses
- Low current and quick ratios (0.71 and 0.58) raise short-term liquidity concerns
- Unfavorable ROE at 8.98% below WACC of 7.86% suggests weak capital efficiency
- Unfavorable P/E at 30.16 may imply overvaluation
- Lower asset turnover at 0.44 limits operational efficiency
- Unfavorable dividend yield at 0.53%
- Heavy US dependence with limited China revenue (648M)
MKS Inc. Weaknesses
- High debt-to-assets at 55.65% signals leverage risk
- Unfavorable interest coverage at 1.51 warns of potential strain on earnings
- Unfavorable P/E and P/B ratios at 36.98 and 3.03 suggest premium valuation
- Low net margin at 5.3% restricts profitability
- Unfavorable current ratio at 3.19 despite strong quick ratio
- Smaller US revenue base at 804M compared to Fortive
Both companies demonstrate diversification and global reach, but Fortive’s profitability and financial stability metrics appear stronger. MKS faces notable leverage and profitability challenges despite solid liquidity in some areas. These factors will shape each company’s strategic focus on operational efficiency and capital structure management.
The Moat Duel: Analyzing Competitive Defensibility
A structural moat is the only shield protecting long-term profits from relentless competition erosion. Let’s dissect the moats of Fortive and MKS Inc.:
Fortive Corporation: Diversified Intangible Assets Moat
Fortive leverages strong intangible assets across software and engineered products, sustaining margin stability with a 60.96% gross margin. Rising ROIC signals improving capital efficiency in 2026, despite recent revenue headwinds.
MKS Inc.: Specialized Technological Expertise Moat
MKS depends on specialized tech in vacuum and photonics solutions, but suffers a weaker margin (47.63%) and declining ROIC trend. Its innovation pipeline must accelerate to reverse value destruction and capitalize on semiconductor growth.
Verdict: Intangible Assets vs. Specialized Tech – Who Holds the Stronger Moat?
Fortive’s widening moat, powered by intangible asset breadth and improving ROIC, outpaces MKS’s shrinking competitive edge. Fortive stands better positioned to defend market share amid intensifying industry rivalry.
Which stock offers better returns?
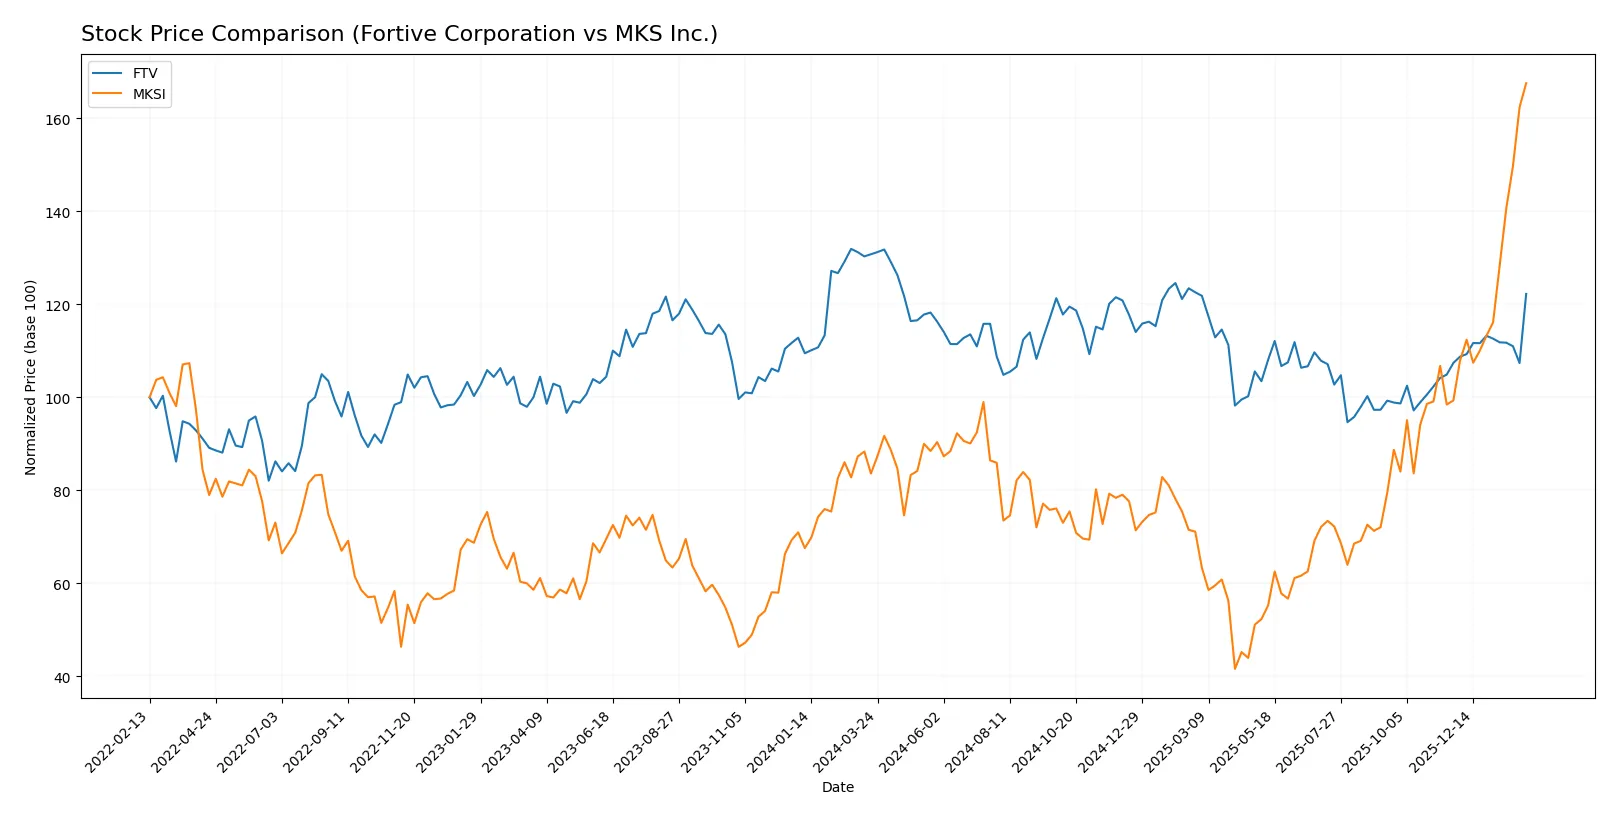
The past year shows stark contrasts in price performance and trading dynamics between Fortive Corporation and MKS Inc., with notable shifts in momentum and buyer activity.
Trend Comparison
Fortive’s stock declined 6.53% over the past year, marking a bearish trend with accelerating downward momentum and a moderate volatility level (4.16 std dev). The price ranged between 46.55 and 64.82.
MKS Inc. surged 100.45% over the same period, reflecting a strong bullish trend with acceleration and high volatility (31.75 std dev). The stock’s price fluctuated widely from 60.29 to 242.96.
MKS’s performance outpaced Fortive decisively, delivering the highest market returns and showing stronger buyer dominance in recent months.
Target Prices
Analysts present a bullish consensus on Fortive Corporation and MKS Inc., reflecting confidence in their growth prospects.
| Company | Target Low | Target High | Consensus |
|---|---|---|---|
| Fortive Corporation | 51 | 70 | 59.83 |
| MKS Inc. | 151 | 265 | 223 |
Fortive’s consensus target of 59.83 slightly trails its current price of 60.12, signaling moderate upside potential. MKS’s consensus target of 223 suggests room for correction from its current 242.96, indicating elevated valuation risk.

Don’t Let Luck Decide Your Entry Point
Optimize your entry points with our advanced ProRealTime indicators. You’ll get efficient buy signals with precise price targets for maximum performance. Start outperforming now!
How do institutions grade them?
This section compares institutional grades assigned to Fortive Corporation and MKS Inc.:
Fortive Corporation Grades
Below is a summary of recent grades from major institutions for Fortive Corporation.
| Grading Company | Action | New Grade | Date |
|---|---|---|---|
| Wells Fargo | Maintain | Equal Weight | 2026-02-05 |
| RBC Capital | Maintain | Sector Perform | 2026-02-05 |
| Citigroup | Maintain | Neutral | 2026-02-05 |
| JP Morgan | Downgrade | Underweight | 2026-01-16 |
| Mizuho | Downgrade | Underperform | 2026-01-05 |
| Wells Fargo | Maintain | Equal Weight | 2025-12-22 |
| Citigroup | Maintain | Neutral | 2025-12-08 |
| Morgan Stanley | Maintain | Equal Weight | 2025-11-05 |
| Baird | Maintain | Outperform | 2025-11-04 |
| JP Morgan | Maintain | Neutral | 2025-10-30 |
MKS Inc. Grades
The following table details institutional grades recently issued for MKS Inc.
| Grading Company | Action | New Grade | Date |
|---|---|---|---|
| B of A Securities | Maintain | Buy | 2026-01-22 |
| Wells Fargo | Maintain | Equal Weight | 2026-01-22 |
| TD Cowen | Maintain | Buy | 2026-01-22 |
| Morgan Stanley | Maintain | Overweight | 2026-01-22 |
| Needham | Maintain | Buy | 2026-01-22 |
| Cantor Fitzgerald | Maintain | Overweight | 2026-01-20 |
| Keybanc | Maintain | Overweight | 2026-01-16 |
| Wells Fargo | Maintain | Equal Weight | 2026-01-15 |
| Needham | Maintain | Buy | 2026-01-13 |
| B of A Securities | Maintain | Buy | 2026-01-13 |
Which company has the best grades?
MKS Inc. consistently receives Buy and Overweight ratings, signaling stronger institutional confidence than Fortive’s mixed Neutral to Underperform grades. This contrast may influence investor sentiment and portfolio positioning.
Risks specific to each company
The following categories identify the critical pressure points and systemic threats facing both firms in the 2026 market environment:
1. Market & Competition
Fortive Corporation
- Faces moderate sector competition with stable market cap of $19B and diversified industrial software and hardware products.
MKS Inc.
- Operates in specialized semiconductor and photonics markets with $16.3B market cap but higher beta (1.94) signals greater sensitivity to market swings.
2. Capital Structure & Debt
Fortive Corporation
- Maintains moderate debt-to-assets at 27.3%, favorable interest coverage at 7.0x, indicating solid debt service capacity.
MKS Inc.
- High debt-to-assets at 55.7%, weak interest coverage of 1.51x, reflecting elevated financial risk and potential distress.
3. Stock Volatility
Fortive Corporation
- Beta near 1.03 suggests stock volatility close to the market average, implying moderate risk.
MKS Inc.
- Beta of 1.94 indicates nearly double market volatility, increasing risk exposure for investors.
4. Regulatory & Legal
Fortive Corporation
- Operates globally with exposure to industry standards in healthcare and industrial software, moderate regulatory complexity.
MKS Inc.
- Faces stringent regulations in semiconductor and defense sectors, increasing compliance costs and legal risk.
5. Supply Chain & Operations
Fortive Corporation
- Benefits from diversified supply chains across multiple industries, reducing single-source risk.
MKS Inc.
- More concentrated supply chain in advanced manufacturing and photonics, vulnerable to semiconductor cycle downturns.
6. ESG & Climate Transition
Fortive Corporation
- Increasingly integrating sustainability in industrial tools and software, aligning with growing ESG demands.
MKS Inc.
- Faces pressure to innovate energy-efficient solutions in photonics and semiconductor equipment amid rising environmental regulations.
7. Geopolitical Exposure
Fortive Corporation
- Limited direct geopolitical risk due to broad industry focus and US-based operations.
MKS Inc.
- Greater exposure to geopolitical tensions affecting semiconductor supply chains and export controls.
Which company shows a better risk-adjusted profile?
Fortive’s strongest risk is liquidity, with a current ratio of 0.71 signaling potential short-term strain despite solid debt management. MKS faces its largest risk from an elevated debt load and weak interest coverage, raising default concerns. Fortive’s Altman Z-Score in the safe zone (3.58) contrasts with MKS’s grey zone score (2.40), underscoring better financial stability. MKS’s high beta and debt amplify volatility and financial risk, while Fortive’s moderate beta and conservative leverage offer a more balanced risk-adjusted profile. Recent data shows Fortive’s strong interest coverage as a key buffer, justifying my preference for its safer risk stance.
Final Verdict: Which stock to choose?
Fortive Corporation’s superpower lies in its improving profitability and strong operational cash flow despite a challenging revenue environment. Its key point of vigilance is a weak liquidity position, signaling potential short-term balance sheet risks. Fortive suits portfolios targeting steady operational efficiency and moderate growth resilience.
MKS Inc. commands a strategic moat through its solid gross margins and significant recent earnings growth, reflecting strong niche market positioning. It offers a comparatively safer liquidity profile but struggles under heavy debt and declining ROIC trends. MKS fits growth-oriented portfolios willing to tolerate higher leverage for potential upside.
If you prioritize operational stability and improving profitability in a complex sector, Fortive outshines with better cash flow discipline and moderate risk. However, if you seek aggressive growth with a focus on margin expansion despite debt challenges, MKS offers superior recent earnings momentum and market acceleration. Both present distinct analytical scenarios requiring careful risk appetite calibration.
Disclaimer: Investment carries a risk of loss of initial capital. The past performance is not a reliable indicator of future results. Be sure to understand risks before making an investment decision.
Go Further
I encourage you to read the complete analyses of Fortive Corporation and MKS Inc. to enhance your investment decisions: