Home > Comparison > Technology > FTV vs MVIS
The strategic rivalry between Fortive Corporation and MicroVision, Inc. shapes the trajectory of the technology hardware sector. Fortive operates as a diversified industrial equipment and software leader serving multiple end markets. In contrast, MicroVision focuses on cutting-edge lidar and display technologies for automotive and AR applications. This analysis pits Fortive’s broad industrial resilience against MicroVision’s high-growth innovation to identify the superior risk-adjusted investment for a balanced portfolio.

Table of contents
Companies Overview
Fortive Corporation and MicroVision, Inc. are key players in the hardware and equipment sector with distinct market footprints.
Fortive Corporation: Diversified Industrial Technology Leader
Fortive dominates the professional and engineered products market through connected reliability tools and enterprise software. Its revenue streams come from multiple verticals like manufacturing, healthcare, and utilities. In 2026, the company strategically focuses on expanding its Intelligent Operating Solutions and Precision Technologies segments, leveraging its broad brand portfolio to serve diverse industrial needs.
MicroVision, Inc.: Innovative Lidar and Display Technology Pioneer
MicroVision specializes in advanced lidar sensors for automotive safety and autonomous vehicles. Its core income derives from selling micro-electrical mechanical systems and laser scanning tech to OEMs. The 2026 strategy centers on enhancing its laser beam scanning and AR display modules to capture emerging markets in augmented reality and smart home systems.
Strategic Collision: Similarities & Divergences
Fortive pursues a broad industrial technology approach, while MicroVision targets niche innovation in lidar and displays. Both compete indirectly in hardware innovation but differ in scale and market breadth. Fortive’s diversified portfolio contrasts with MicroVision’s focused product development, creating distinct investment profiles shaped by scale, risk, and growth potential.
Income Statement Comparison
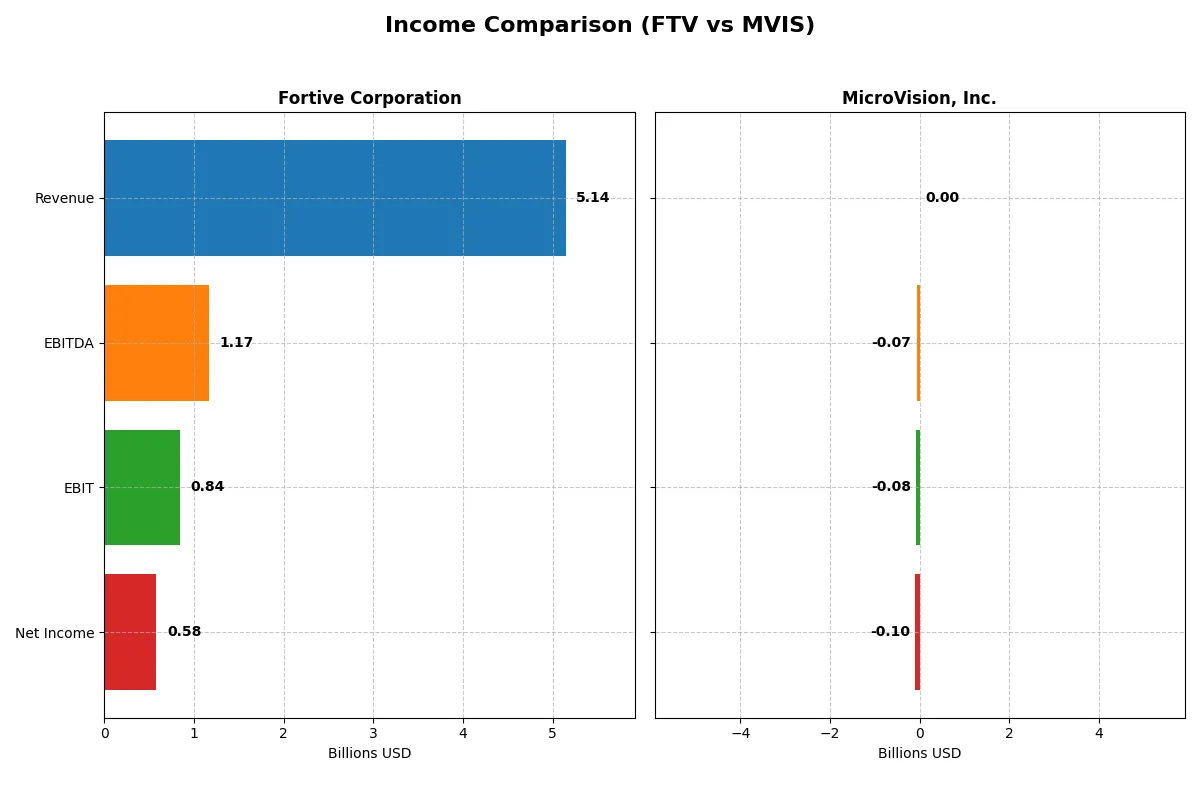
This data dissects the core profitability and scalability of both corporate engines, revealing who dominates the bottom line:
| Metric | Fortive Corporation (FTV) | MicroVision, Inc. (MVIS) |
|---|---|---|
| Revenue | 5.14B | 4.70M |
| Cost of Revenue | 2.01B | 7.53M |
| Operating Expenses | 2.23B | 82.7M |
| Gross Profit | 3.13B | -2.83M |
| EBITDA | 1.17B | -70.98M |
| EBIT | 843M | -75.2M |
| Interest Expense | 121M | 4.46M |
| Net Income | 579M | -96.9M |
| EPS | 1.75 | -0.46 |
| Fiscal Year | 2025 | 2024 |
Income Statement Analysis: The Bottom-Line Duel
This income statement comparison exposes the true operational efficiency and profitability of two contrasting corporate engines.
Fortive Corporation Analysis
Fortive’s revenue declined from 6.23B in 2024 to 5.14B in 2025, reflecting a 17.5% drop. Net income also contracted from 833M to 579M, squeezing net margin to 11.3%. Despite this, Fortive sustains a strong gross margin near 61% and an EBIT margin above 16%, showing solid cost control and operational discipline.
MicroVision, Inc. Analysis
MicroVision’s revenue fell sharply from 7.26M in 2023 to 4.70M in 2024, with a corresponding plunge in net income to -97M. The company posts a negative gross margin of -60% and a staggering EBIT margin loss of -1601%. High interest expenses near 95% of revenue deepen the losses, highlighting severe inefficiencies and persistent cash burn.
Margin Dominance vs. Bleeding Growth
Fortive exhibits fundamental profitability with healthy margins despite recent revenue headwinds. MicroVision’s revenue growth is overshadowed by massive losses and unsustainable margins. Fortive’s profile appeals more to investors seeking operational resilience, while MicroVision carries substantial risk with its ongoing negative earnings trajectory.
Financial Ratios Comparison
These vital ratios act as a diagnostic tool to expose the underlying fiscal health, valuation premiums, and capital efficiency of the companies compared below:
| Ratios | Fortive Corporation (FTV) | MicroVision, Inc. (MVIS) |
|---|---|---|
| ROE | 8.98% | -198.72% |
| ROIC | 7.44% | -83.73% |
| P/E | 30.16 | -2.83 |
| P/B | 2.71 | 5.63 |
| Current Ratio | 0.71 | 1.79 |
| Quick Ratio | 0.58 | 1.74 |
| D/E | 0.50 | 1.06 |
| Debt-to-Assets | 27.31% | 42.62% |
| Interest Coverage | 7.54 | -19.19 |
| Asset Turnover | 0.44 | 0.04 |
| Fixed Asset Turnover | 19.06 | 0.20 |
| Payout ratio | 16% | 0% |
| Dividend yield | 0.53% | 0% |
| Fiscal Year | 2025 | 2024 |
Efficiency & Valuation Duel: The Vital Signs
Financial ratios serve as a company’s DNA, exposing hidden risks and operational strengths vital for investment decisions.
Fortive Corporation
Fortive shows moderate profitability with an 8.98% ROE and an 11.26% net margin, indicating operational competence. Its valuation at a 30.16 P/E signals a stretched price relative to earnings. The company maintains modest shareholder returns with a 0.53% dividend yield, favoring reinvestment in R&D to fuel growth.
MicroVision, Inc.
MicroVision struggles with deeply negative profitability metrics, including a -198.72% ROE and a -2063.78% net margin, reflecting significant losses. Its valuation appears cheap by P/E, but a high 5.63 P/B ratio flags market skepticism. The firm returns no dividends, heavily investing in R&D to support innovation amid ongoing challenges.
Operational Strength vs. Financial Fragility
Fortive balances reasonable profitability and a premium valuation, while MicroVision faces severe losses despite aggressive R&D spending. Fortive offers a more stable risk-reward profile. Investors seeking operational safety may prefer Fortive; those chasing high-risk innovation might consider MicroVision.
Which one offers the Superior Shareholder Reward?
Fortive Corporation (FTV) offers a far superior shareholder reward compared to MicroVision, Inc. (MVIS). Fortive consistently pays a dividend with a 0.56% yield and a sustainable payout ratio around 13-16%, backed by strong free cash flow coverage near 90%. It also executes steady share buybacks, enhancing total returns. MicroVision, by contrast, pays no dividends and posts persistent heavy losses, negative margins exceeding 20%, and negative free cash flow. MVIS’s reinvestment in R&D and growth lacks near-term shareholder reward visibility. Fortive’s balanced, sustainable cash return model and disciplined capital allocation create a more attractive total return profile in 2026.
Comparative Score Analysis: The Strategic Profile
The radar chart reveals the fundamental DNA and trade-offs of Fortive Corporation and MicroVision, Inc., highlighting their distinct financial strengths and weaknesses:
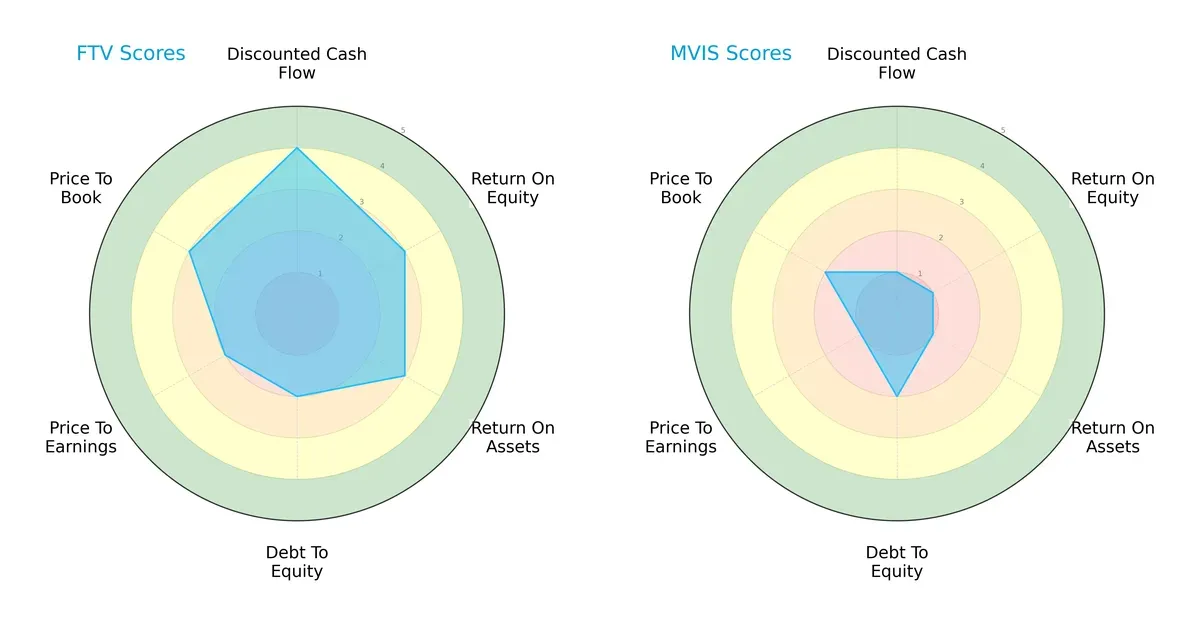
Fortive shows a balanced profile with solid DCF (4), moderate ROE (3) and ROA (3), but weaker debt management (2) and valuation scores (P/E 2, P/B 3). MicroVision suffers across the board with very low scores in DCF, ROE, ROA, and valuation metrics, though it slightly edges Fortive on debt-to-equity (2 vs. 2). Fortive’s broad strengths suggest a more stable investment, while MicroVision relies on limited financial resilience and faces valuation challenges.
Bankruptcy Risk: Solvency Showdown
Fortive’s Altman Z-Score of 3.58 signals strong solvency and low bankruptcy risk, whereas MicroVision’s -7.19 places it deep in financial distress with high default probability in this cycle:

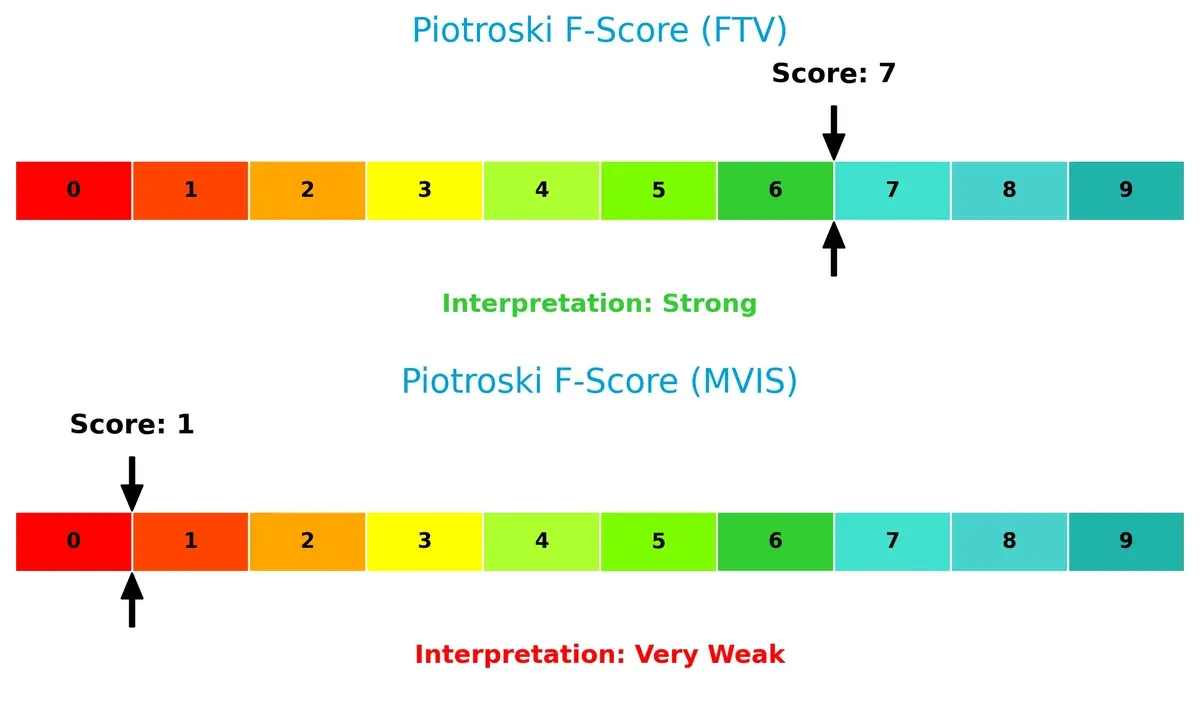
Financial Health: Quality of Operations
Fortive’s Piotroski F-Score of 7 indicates robust financial health with strong profitability and operational metrics. MicroVision’s score of 1 flags serious red flags in internal financial strength and operational quality:
How are the two companies positioned?
This section dissects Fortive and MicroVision’s operational DNA by comparing revenue distribution and internal strengths and weaknesses. The goal is to confront their economic moats and reveal which model offers the most resilient competitive advantage today.
Revenue Segmentation: The Strategic Mix
This visual comparison dissects how Fortive Corporation and MicroVision, Inc. diversify their income streams and where their primary sector bets lie:
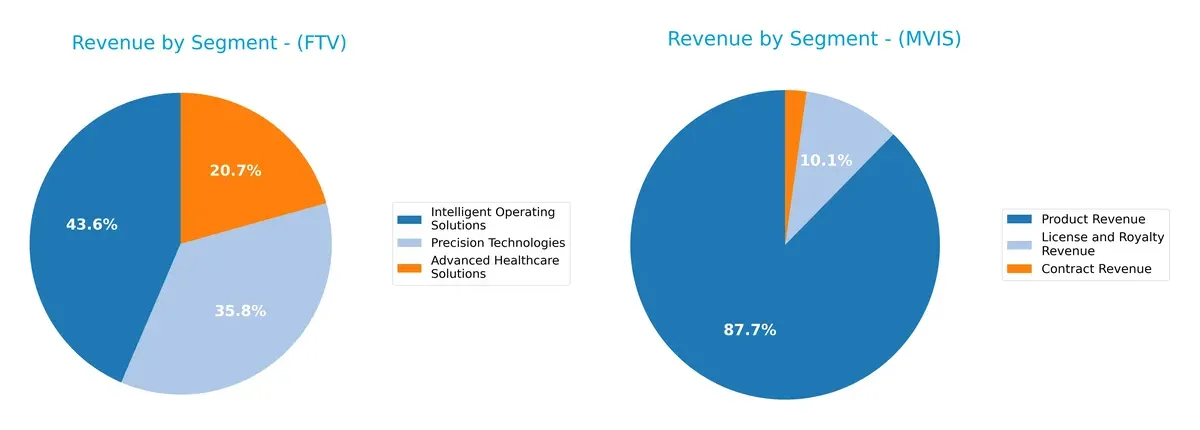
Fortive’s revenue splits evenly among Advanced Healthcare Solutions (1.3B), Intelligent Operating Solutions (2.7B), and Precision Technologies (2.2B), showcasing strong diversification. MicroVision pivots heavily on Product Revenue (4.1M), dwarfed by smaller License and Royalty (475K) and Contract segments (104K), exposing concentration risk. Fortive’s balanced mix supports ecosystem lock-in, while MicroVision’s reliance on product sales heightens vulnerability to market shifts.
Strengths and Weaknesses Comparison
This table compares the strengths and weaknesses of Fortive Corporation and MicroVision, Inc.:
Fortive Strengths
- Diversified revenues across Advanced Healthcare, Intelligent Operating, and Precision Technologies
- Favorable net margin of 11.26%
- Strong interest coverage ratio of 7.0
- Low debt-to-assets at 27.31% indicating prudent leverage
MicroVision Strengths
- Favorable current and quick ratios above 1.7 showing good short-term liquidity
- Positive PE ratio status indicating potential valuation appeal
- Presence in contract and license revenue streams
Fortive Weaknesses
- Low current and quick ratios below 1 signal liquidity risks
- Unfavorable ROE at 8.98% below cost of equity
- High P/E ratio of 30.16 questions valuation
- Unfavorable asset turnover of 0.44 suggests less efficient asset use
MicroVision Weaknesses
- Large negative net margin and ROE indicate sustained losses
- High debt-to-equity ratio at 1.06 suggests elevated financial risk
- Very low asset turnover of 0.04 and fixed asset turnover of 0.2 reflect operational inefficiency
- No geographic diversification reported
Fortive’s broad product and geographic diversification supports its financial stability, despite some liquidity and efficiency concerns. MicroVision faces significant profitability and operational challenges, compounded by high leverage and limited diversification. These factors critically shape each company’s strategic options moving forward.
The Moat Duel: Analyzing Competitive Defensibility
A structural moat is the only reliable shield protecting long-term profits from relentless competitive erosion. Let’s dissect the moats of Fortive and MicroVision:
Fortive Corporation: Diverse Brand Portfolio and Operational Scale
Fortive’s primary moat lies in its intangible assets and operational scale, reflected in stable margins and a growing ROIC trend despite value destruction. New software and healthcare tech could deepen its moat in 2026.
MicroVision, Inc.: Innovation-Driven Technology Moat
MicroVision’s moat centers on proprietary lidar and scanning technology, contrasting Fortive’s scale with innovation. Its weak financials mask improving profitability, with growth potential hinging on autonomous vehicle and AR market breakthroughs.
Scale and Innovation: The Moat Showdown
Fortive’s wider operational moat outmatches MicroVision’s nascent tech moat. Fortive’s diversified revenue base and improving profitability position it better to defend market share amid evolving industry dynamics.
Which stock offers better returns?
The past year shows contrasting stock price dynamics: Fortive Corporation’s bearish trend with recent acceleration contrasts sharply with MicroVision, Inc.’s sustained and decelerating downward trajectory.
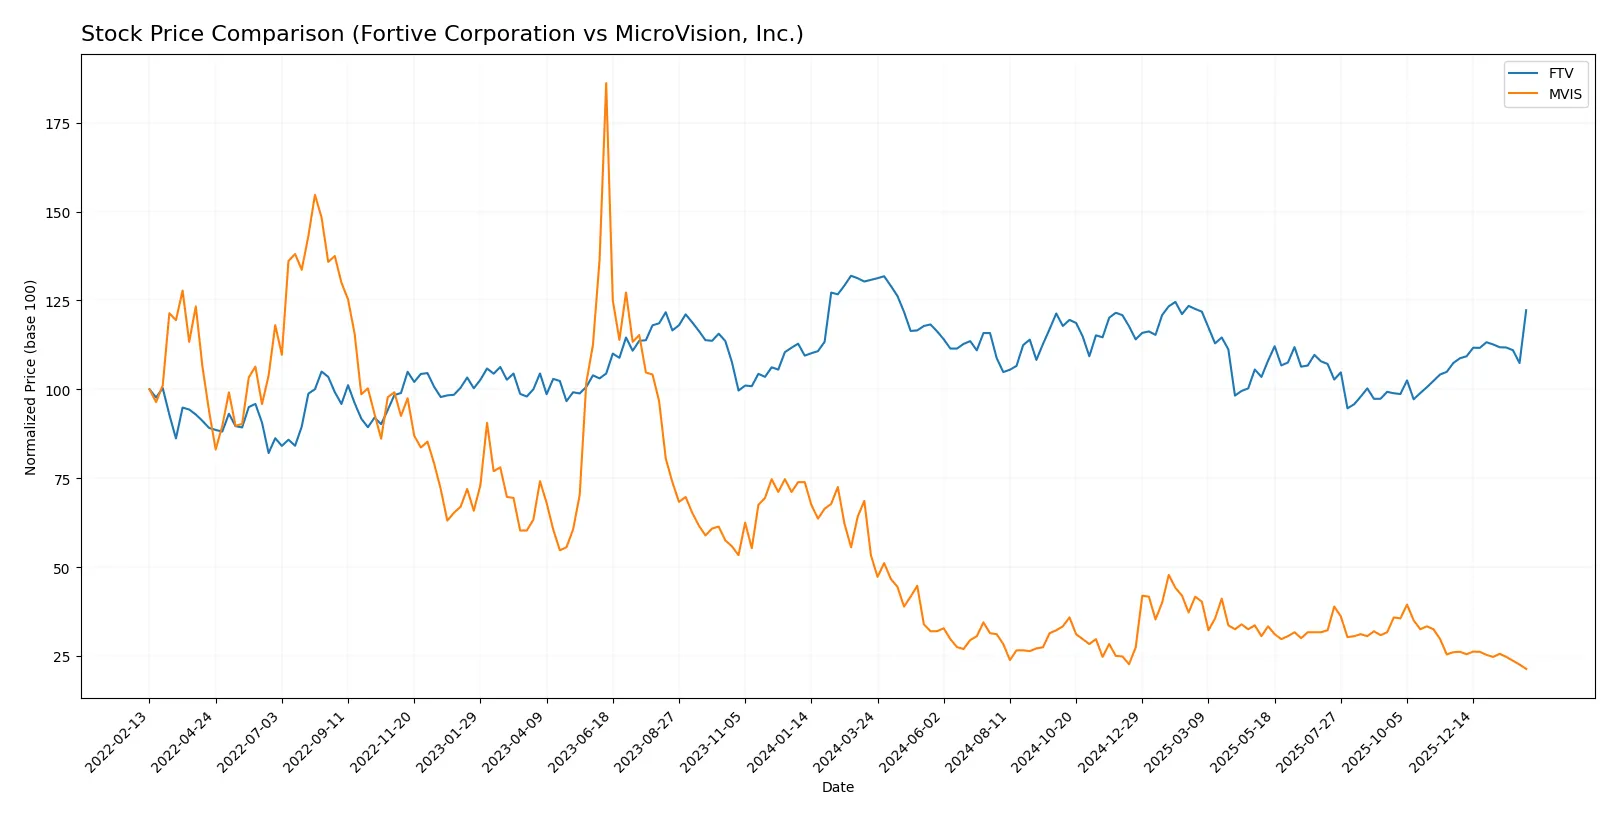
Trend Comparison
Fortive Corporation’s stock fell 6.53% over the past year, indicating a bearish trend with accelerating decline and a high volatility of 4.16. It ranged between 64.82 and 46.55.
MicroVision, Inc. declined 59.96% over the same period, marking a strong bearish trend with decelerating losses and very low volatility at 0.23. The price fluctuated from 1.92 down to 0.77.
Comparing both, Fortive delivered the highest market performance, with a less severe decline and recent positive momentum, unlike MicroVision’s steep and persistent fall.
Target Prices
Analysts present a modestly bullish target consensus for Fortive Corporation and a firm single-price target for MicroVision, Inc.
| Company | Target Low | Target High | Consensus |
|---|---|---|---|
| Fortive Corporation | 51 | 70 | 59.83 |
| MicroVision, Inc. | 5 | 5 | 5 |
Fortive’s consensus target of $59.83 closely aligns with its current price of $60.12, signaling limited upside. MicroVision’s firm $5 target suggests substantial upside from its current $0.77 price, indicating high growth expectations.

Don’t Let Luck Decide Your Entry Point
Optimize your entry points with our advanced ProRealTime indicators. You’ll get efficient buy signals with precise price targets for maximum performance. Start outperforming now!
How do institutions grade them?
Here is the summary of institutional grades for Fortive Corporation and MicroVision, Inc.:
Fortive Corporation Grades
This table shows recent grade updates from notable financial institutions for Fortive:
| Grading Company | Action | New Grade | Date |
|---|---|---|---|
| Wells Fargo | Maintain | Equal Weight | 2026-02-05 |
| RBC Capital | Maintain | Sector Perform | 2026-02-05 |
| Citigroup | Maintain | Neutral | 2026-02-05 |
| JP Morgan | Downgrade | Underweight | 2026-01-16 |
| Mizuho | Downgrade | Underperform | 2026-01-05 |
| Wells Fargo | Maintain | Equal Weight | 2025-12-22 |
| Citigroup | Maintain | Neutral | 2025-12-08 |
| Morgan Stanley | Maintain | Equal Weight | 2025-11-05 |
| Baird | Maintain | Outperform | 2025-11-04 |
| JP Morgan | Maintain | Neutral | 2025-10-30 |
MicroVision, Inc. Grades
The following table lists consistent Buy ratings from specialized capital firms for MicroVision:
| Grading Company | Action | New Grade | Date |
|---|---|---|---|
| D. Boral Capital | Maintain | Buy | 2026-01-27 |
| D. Boral Capital | Maintain | Buy | 2025-12-16 |
| D. Boral Capital | Maintain | Buy | 2025-11-12 |
| WestPark Capital | Maintain | Buy | 2025-10-21 |
| WestPark Capital | Maintain | Buy | 2025-09-05 |
| D. Boral Capital | Maintain | Buy | 2025-09-02 |
| WestPark Capital | Maintain | Buy | 2025-08-27 |
| D. Boral Capital | Maintain | Buy | 2025-08-11 |
| D. Boral Capital | Maintain | Buy | 2025-05-21 |
| D. Boral Capital | Maintain | Buy | 2025-05-13 |
Which company has the best grades?
MicroVision, Inc. consistently receives Buy ratings, while Fortive Corporation’s ratings cluster around Neutral to Underweight. Investors might view MicroVision’s grades as more bullish, indicating stronger institutional confidence.
Risks specific to each company
The following categories identify the critical pressure points and systemic threats facing both firms in the 2026 market environment:
1. Market & Competition
Fortive Corporation
- Operates in diversified industrial hardware with established brands and steady demand.
MicroVision, Inc.
- Faces intense competition in emerging lidar and AR tech markets with uncertain revenue streams.
2. Capital Structure & Debt
Fortive Corporation
- Moderate debt levels with favorable debt-to-assets (27.3%) and strong interest coverage (7.0x).
MicroVision, Inc.
- High leverage with debt-to-equity over 1.0 and negative interest coverage, signaling financial risk.
3. Stock Volatility
Fortive Corporation
- Beta near 1.0 indicates average stock volatility compared to the market.
MicroVision, Inc.
- Beta above 1.1 shows higher sensitivity to market swings and speculative trading.
4. Regulatory & Legal
Fortive Corporation
- Subject to industrial and healthcare compliance, manageable regulatory exposure.
MicroVision, Inc.
- Emerging tech subject to evolving lidar and AR regulations, increasing legal uncertainties.
5. Supply Chain & Operations
Fortive Corporation
- Established supply chain with diversified end markets reduces operational risks.
MicroVision, Inc.
- Smaller scale and reliance on specialized components heighten supply chain vulnerability.
6. ESG & Climate Transition
Fortive Corporation
- Larger firm with more resources to invest in ESG initiatives and transition efforts.
MicroVision, Inc.
- Limited scale and capital constrain ESG commitments and climate risk mitigation.
7. Geopolitical Exposure
Fortive Corporation
- Global footprint with some exposure but diversified across stable regions.
MicroVision, Inc.
- Concentrated US market focus reduces geopolitical risk but limits growth opportunities abroad.
Which company shows a better risk-adjusted profile?
Fortive Corporation’s key risk is its liquidity constraints, reflected in unfavorable current and quick ratios despite steady profitability. MicroVision faces existential risk from its extreme losses, negative cash flows, and distress zone Altman Z-score. Fortive offers a stronger risk-adjusted profile, supported by a safe-zone Z-score and stable debt metrics. MicroVision’s financial fragility and high volatility paint a very unfavorable risk picture, amplified by its nascent market position and operational scale. The recent strong negative net margin and extremely weak Piotroski score for MicroVision emphasize its heightened bankruptcy risk compared to Fortive’s steady fundamentals.
Final Verdict: Which stock to choose?
Fortive Corporation’s superpower lies in its resilient cash generation and improving profitability, despite recent revenue headwinds. Its point of vigilance is a low liquidity buffer, which could pose risks in tighter credit conditions. This stock suits a portfolio seeking steady industrial exposure with moderate growth ambitions.
MicroVision, Inc. offers a strategic moat through its cutting-edge R&D in sensing technology, aiming to capture future growth markets. It carries a higher risk profile than Fortive, with ongoing value destruction and weak income metrics. This stock fits a high-risk, speculative portfolio focused on breakthrough innovation potential.
If you prioritize stable cash flow and improving operational efficiency, Fortive outshines as the more prudent choice due to its growing returns and solid financial footing. However, if you seek speculative growth with exposure to emerging tech, MicroVision offers superior innovation upside despite its financial fragility. Both require careful risk management aligned with your investment tolerance.
Disclaimer: Investment carries a risk of loss of initial capital. The past performance is not a reliable indicator of future results. Be sure to understand risks before making an investment decision.
Go Further
I encourage you to read the complete analyses of Fortive Corporation and MicroVision, Inc. to enhance your investment decisions: