Home > Comparison > Technology > FTV vs MLAB
The strategic rivalry between Fortive Corporation and Mesa Laboratories, Inc. shapes the competitive landscape in Technology. Fortive operates as a diversified industrial powerhouse offering engineered hardware and software solutions globally. Mesa, by contrast, focuses on specialized life sciences tools and quality control products with a niche in clinical genomics and calibration. This analysis will assess which company’s operational model better balances growth and risk, guiding investors toward the superior risk-adjusted portfolio candidate.
Table of contents
Companies Overview
Fortive and Mesa Laboratories stand as key players in the hardware and equipment sector with distinct market focuses.
Fortive Corporation: Industrial Technology Powerhouse
Fortive leads as a diversified industrial technology company. It generates revenue by designing and servicing professional and engineered products across multiple verticals such as manufacturing and healthcare. In 2026, Fortive emphasizes connected reliability tools and enterprise software to deepen integration and digital transformation within its client base.
Mesa Laboratories, Inc.: Life Sciences Innovator
Mesa Laboratories specializes in life sciences tools and quality control products. Its revenue derives from manufacturing sterilization indicators, biopharmaceutical development systems, and clinical genomics tools. The company’s strategic focus in 2026 targets expanding automated protein analysis and genetic testing solutions to enhance clinical diagnostics and pharmaceutical development.
Strategic Collision: Similarities & Divergences
Both firms operate in hardware and equipment but diverge sharply in customer focus and technology application. Fortive pursues a broad industrial ecosystem with software-enabled services, while Mesa concentrates on niche life sciences automation and calibration. Their primary battleground is technological innovation within specialized equipment. Fortive offers scale and diversification, whereas Mesa provides specialized expertise and precision in life sciences.
Income Statement Comparison
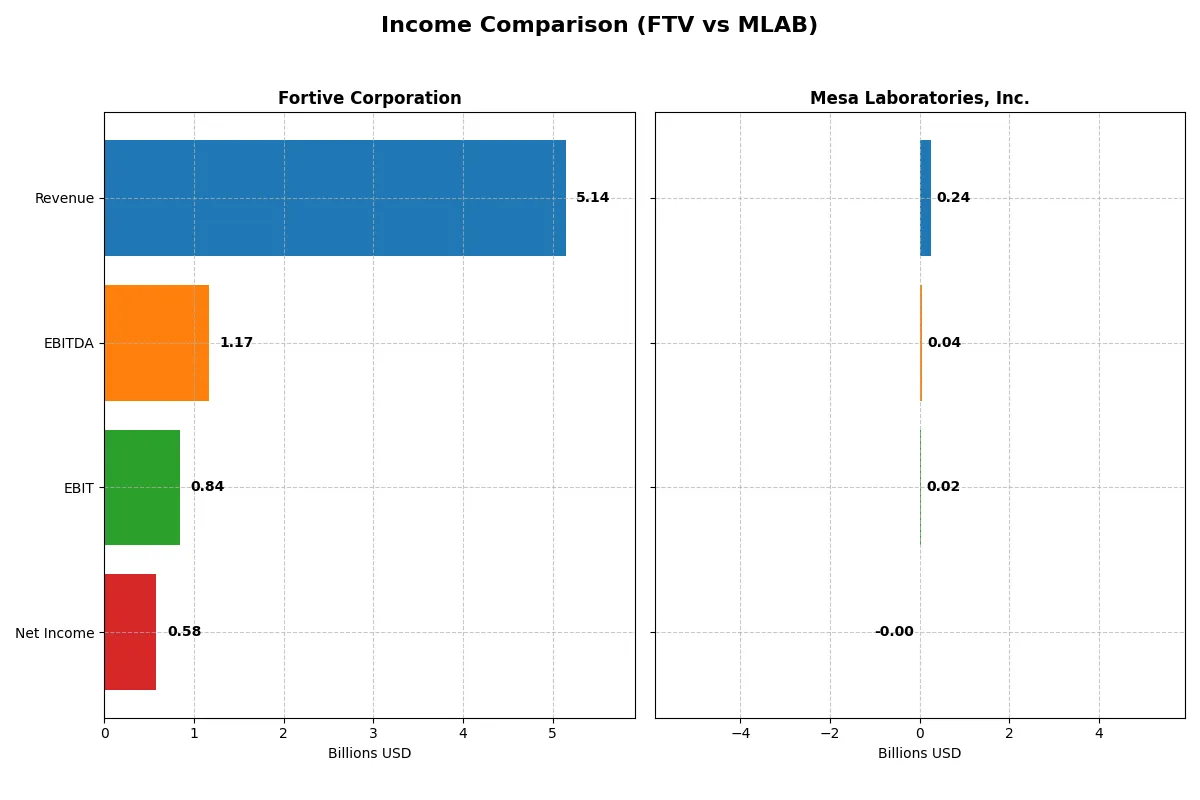
The following data dissects the core profitability and scalability of both corporate engines to reveal who dominates the bottom line:
| Metric | Fortive Corporation (FTV) | Mesa Laboratories, Inc. (MLAB) |
|---|---|---|
| Revenue | 5.14B | 241M |
| Cost of Revenue | 2.01B | 90.1M |
| Operating Expenses | 2.23B | 135M |
| Gross Profit | 3.13B | 151M |
| EBITDA | 1.17B | 42.3M |
| EBIT | 843M | 17.8M |
| Interest Expense | 121M | 11.9M |
| Net Income | 579M | -1.97M |
| EPS | 1.75 | -0.36 |
| Fiscal Year | 2025 | 2025 |
Income Statement Analysis: The Bottom-Line Duel
This income statement comparison exposes how efficiently Fortive and Mesa Laboratories convert revenue into profits and sustain margin strength.
Fortive Corporation Analysis
Fortive’s revenue peaked at 6.2B in 2024 then dropped 17.5% to 5.1B in 2025, dragging net income down 30% to 579M. Despite this slump, Fortive preserves strong margins: a favorable 61% gross margin and 11.3% net margin in 2025. However, the one-year decline signals operational headwinds and margin pressure.
Mesa Laboratories, Inc. Analysis
Mesa Laboratories shows robust revenue growth, rising 11.5% to 241M in 2025, supported by a 13.2% gross profit increase. Still, the company posts a net loss of 2M with a -0.8% net margin, reflecting ongoing profitability challenges. EBIT margin remains modest at 7.4%, but the recent turnaround indicates improving operational momentum.
Margin Strength vs. Growth Potential
Fortive dominates in scale and margin health, despite recent revenue and profit contractions. Mesa Laboratories impresses with accelerating revenue and gross profit growth but struggles to translate this into net gains. Fortive’s profile suits investors valuing stable profitability; Mesa may attract those betting on growth and margin recovery.
Financial Ratios Comparison
These vital ratios act as a diagnostic tool to expose the underlying fiscal health, valuation premiums, and capital efficiency of the companies compared below:
| Ratios | Fortive Corporation (FTV) | Mesa Laboratories, Inc. (MLAB) |
|---|---|---|
| ROE | 8.98% | -1.24% |
| ROIC | 7.44% | -1.45% |
| P/E | 30.16 | -326.35 |
| P/B | 2.71 | 4.03 |
| Current Ratio | 0.71 | 0.63 |
| Quick Ratio | 0.58 | 0.47 |
| D/E (Debt-to-Equity) | 0.50 | 1.14 |
| Debt-to-Assets | 27.3% | 41.9% |
| Interest Coverage | 7.54 | 1.38 |
| Asset Turnover | 0.44 | 0.56 |
| Fixed Asset Turnover | 19.06 | 7.45 |
| Payout ratio | 15.9% | -175.7% |
| Dividend yield | 0.53% | 0.54% |
| Fiscal Year | 2025 | 2025 |
Efficiency & Valuation Duel: The Vital Signs
Ratios serve as a company’s DNA, exposing operational strengths and hidden financial risks that shape investor decisions.
Fortive Corporation
Fortive posts a solid net margin of 11.26% but a modest ROE at 8.98%, signaling moderate profitability. Its P/E of 30.16 marks the stock as expensive relative to earnings. The company shows prudent capital allocation, balancing favorable debt metrics with a low dividend yield of 0.53%, favoring growth reinvestment over payouts.
Mesa Laboratories, Inc.
Mesa struggles with negative margins and returns (ROE -1.24%, net margin -0.82%), pointing to operational challenges. Despite a favorable P/E metric due to losses, its high debt-to-equity ratio (1.14) and weak interest coverage reflect financial strain. The absence of dividend growth emphasizes a focus on stabilizing operations rather than rewarding shareholders.
Premium Valuation vs. Operational Safety
Fortive offers a more balanced risk/reward profile with better profitability and manageable leverage despite a stretched valuation. Mesa’s metrics reveal operational weakness and financial risk, undermining its attractiveness. Investors seeking stability might prefer Fortive, while those tolerant of risk face a tougher choice with Mesa.
Which one offers the Superior Shareholder Reward?
I observe that Fortive (FTV) maintains a modest dividend yield near 0.56% with a conservative payout ratio around 13-16%. Its free cash flow coverage exceeds 90%, supporting sustainable dividends. Fortive couples dividends with steady buybacks, enhancing total shareholder returns. Mesa Laboratories (MLAB), despite a similar dividend yield (~0.54%), shows negative net margins and volatile earnings, raising concerns about dividend sustainability. MLAB’s payout ratio swings wildly, sometimes negative or above 100%, reflecting unstable profits. While MLAB invests heavily in cash flow and buybacks, its high leverage (debt/equity >1) and uneven profitability suggest riskier distributions. I conclude Fortive offers a superior, more reliable total return profile in 2026 due to disciplined capital allocation and sustainable shareholder rewards.
Comparative Score Analysis: The Strategic Profile
The radar chart reveals the fundamental DNA and trade-offs of Fortive Corporation and Mesa Laboratories, highlighting their financial strengths and valuation differences:
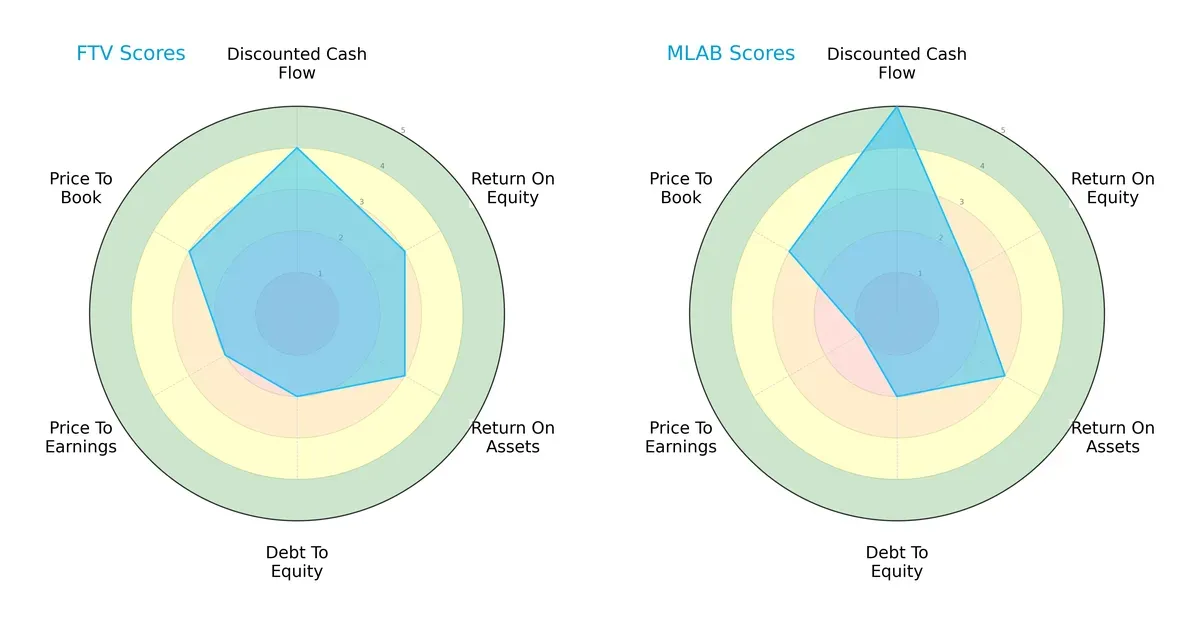
Fortive posts balanced scores with favorable DCF (4) and moderate ROE (3) and ROA (3), but shows weakness in debt (2) and valuation (P/E at 2). Mesa leads in DCF (5) but lags in ROE (2) and suffers a very unfavorable P/E (1), signaling valuation risk. Fortive’s profile is more balanced; Mesa relies heavily on cash flow strength but at a premium risk.
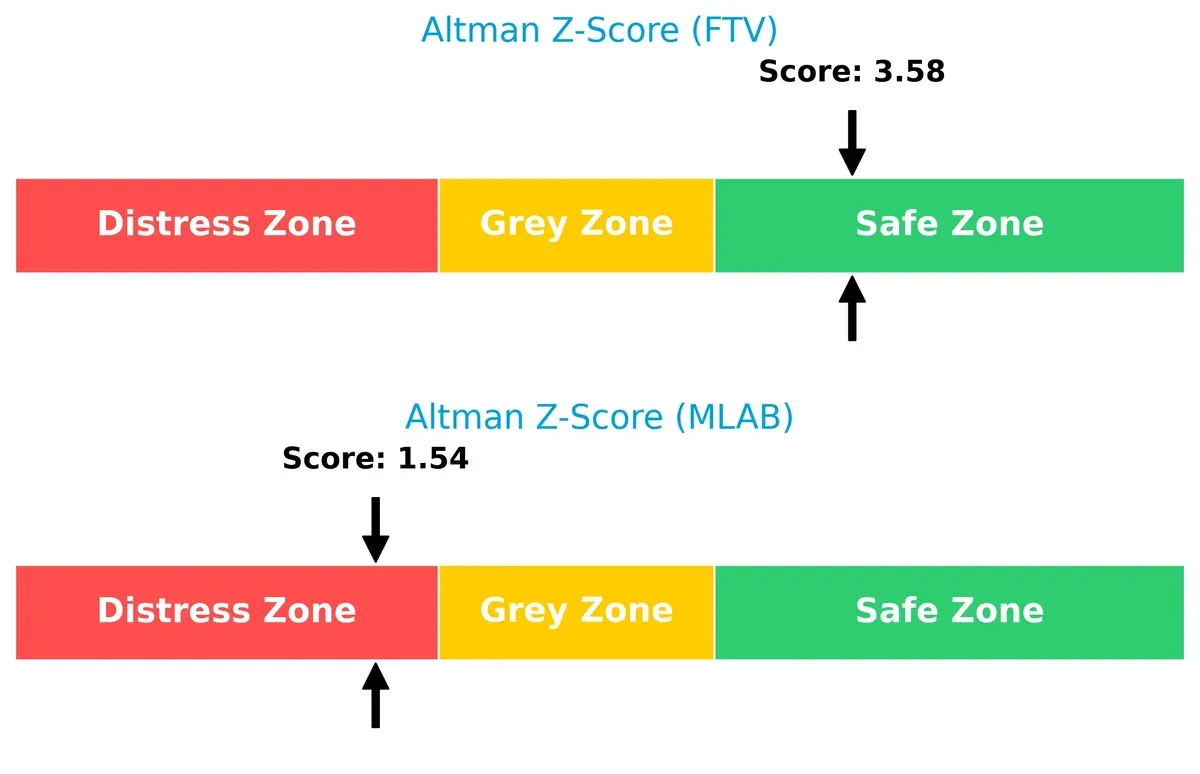
Bankruptcy Risk: Solvency Showdown
Fortive’s Altman Z-Score of 3.58 places it safely above distress thresholds. Mesa’s score of 1.54 signals a high bankruptcy risk in this cycle:
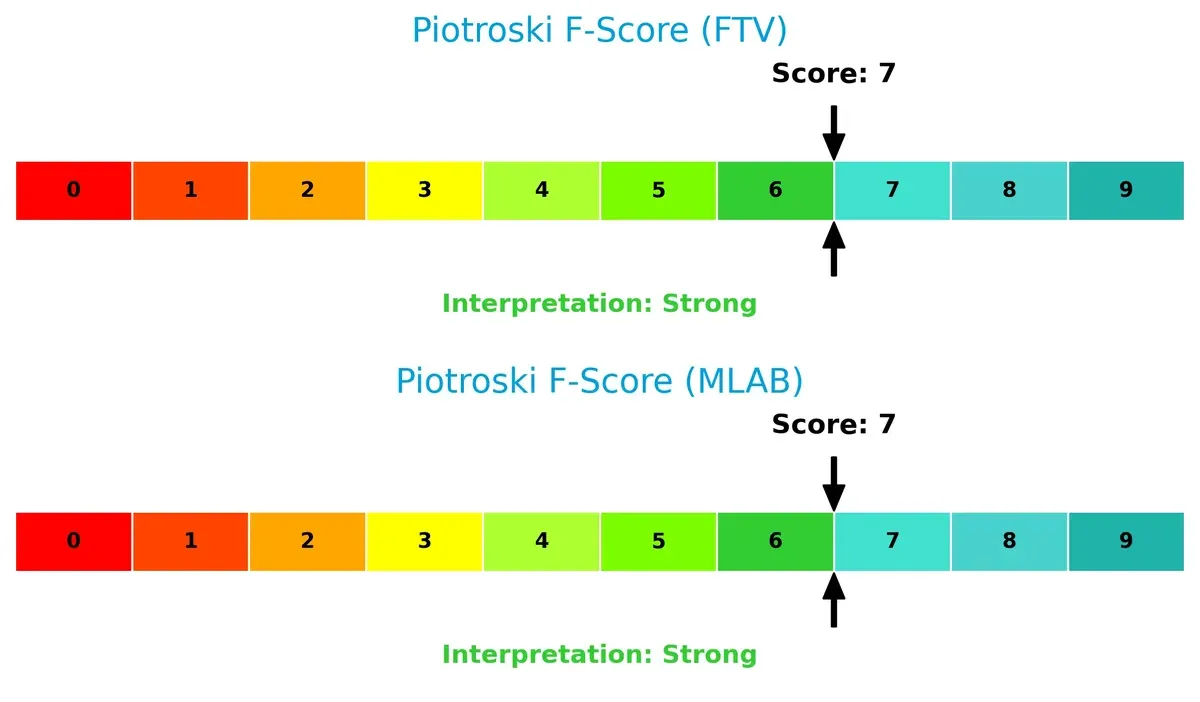
Financial Health: Quality of Operations
Both firms score 7 on the Piotroski scale, indicating strong financial health with no glaring red flags in operational quality or balance sheet strength:
How are the two companies positioned?
This section dissects the operational DNA of Fortive and Mesa by comparing their revenue distribution and internal dynamics. The goal is to confront their economic moats to reveal which model offers the most resilient competitive advantage today.
Revenue Segmentation: The Strategic Mix
This visual comparison dissects how Fortive Corporation and Mesa Laboratories diversify their income streams and where their primary sector bets lie:
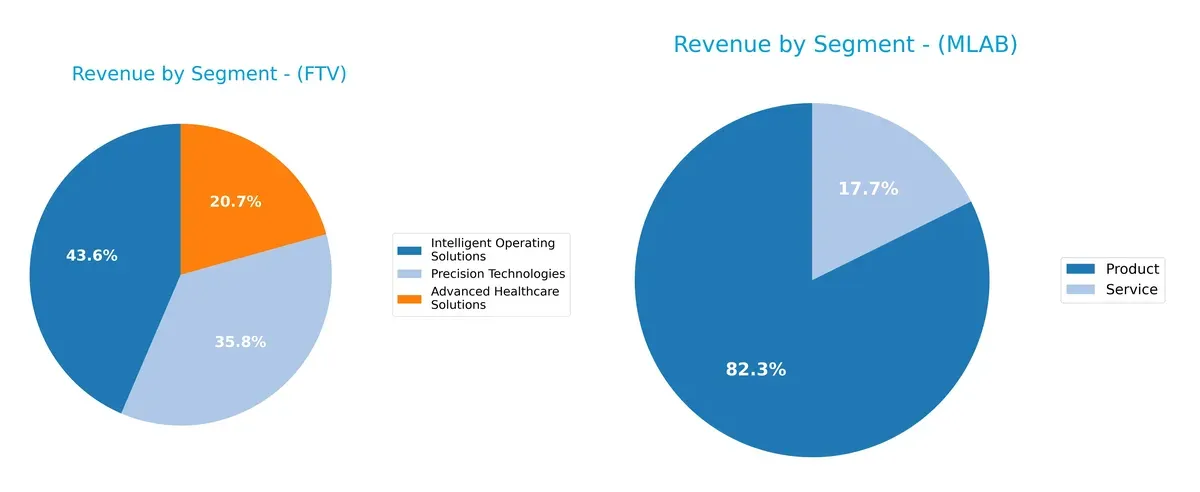
Fortive’s 2024 revenue splits broadly across three segments: Intelligent Operating Solutions at $2.7B, Precision Technologies at $2.2B, and Advanced Healthcare Solutions at $1.3B. This balanced mix reduces concentration risk and supports resilience through diversified industrial and healthcare exposure. Mesa Laboratories, by contrast, leans heavily on a single product segment near $198M, with smaller services revenue, signaling higher dependence on niche markets and potential vulnerability to sector-specific shifts.
Strengths and Weaknesses Comparison
This table compares the strengths and weaknesses of Fortive Corporation and Mesa Laboratories, Inc.:
Fortive Corporation Strengths
- Diversified revenue across Advanced Healthcare, Intelligent Operating, and Precision Technologies
- Favorable net margin at 11.26%
- Strong interest coverage at 7.0 times
- Favorable fixed asset turnover of 19.06
- Moderate debt-to-assets ratio at 27.31%
- Global presence with significant US and international sales
Mesa Laboratories, Inc. Strengths
- Favorable WACC at 6.71% supports cost of capital
- Favorable fixed asset turnover of 7.45
- Positive P/E status reflects market valuation potential
- Diversified product and service lines including biopharmaceutical and clinical genomics
- Presence in US and China markets
Fortive Corporation Weaknesses
- Low current and quick ratios indicating liquidity concerns
- ROE below benchmark at 8.98%
- Unfavorable P/E of 30.16 suggests overvaluation risk
- Low asset turnover at 0.44 limits efficiency
- Dividend yield at 0.53% is weak
- Some financial metrics show mixed neutrality
Mesa Laboratories, Inc. Weaknesses
- Negative net margin, ROE, and ROIC highlight profitability struggles
- High debt-to-equity at 1.14 raises financial risk
- Low current and quick ratios indicate liquidity issues
- Unfavorable interest coverage at 1.5 indicates risk in servicing debt
- Unfavorable P/B ratio at 4.03
- Lower global revenue scale compared to peer
Fortive’s strengths lie in its diversified revenue streams and solid financial structure, though liquidity and valuation pose risks. Mesa faces significant profitability and leverage challenges despite operational efficiency in fixed assets. Both companies’ strategies must address these financial constraints to improve resilience.
The Moat Duel: Analyzing Competitive Defensibility
A structural moat is the only true shield protecting long-term profits from relentless competition erosion. Let’s examine the distinct moats of these firms:
Fortive Corporation: Diversified Industrial Scale Moat
Fortive’s moat stems from a broad portfolio of engineered products and software, creating switching costs via integrated enterprise solutions. Its slightly unfavorable ROIC vs. WACC reflects value destruction, yet improving profitability hints at deepening efficiency in 2026.
Mesa Laboratories, Inc.: Specialized Niche Innovation Moat
Mesa’s competitive edge lies in specialized life sciences tools and quality control, relying on intangible assets and tight regulatory barriers. Unlike Fortive, it suffers a sharp ROIC decline, signaling a weaker moat and pressing challenges to sustain profitability despite recent revenue growth.
Industrial Conglomerate Scale vs. Focused Innovation Edge
Fortive’s wider moat benefits from scale and product diversity with improving returns, while Mesa shows a narrower, eroding moat amid profitability struggles. Fortive appears better equipped to defend and grow its market share in 2026.
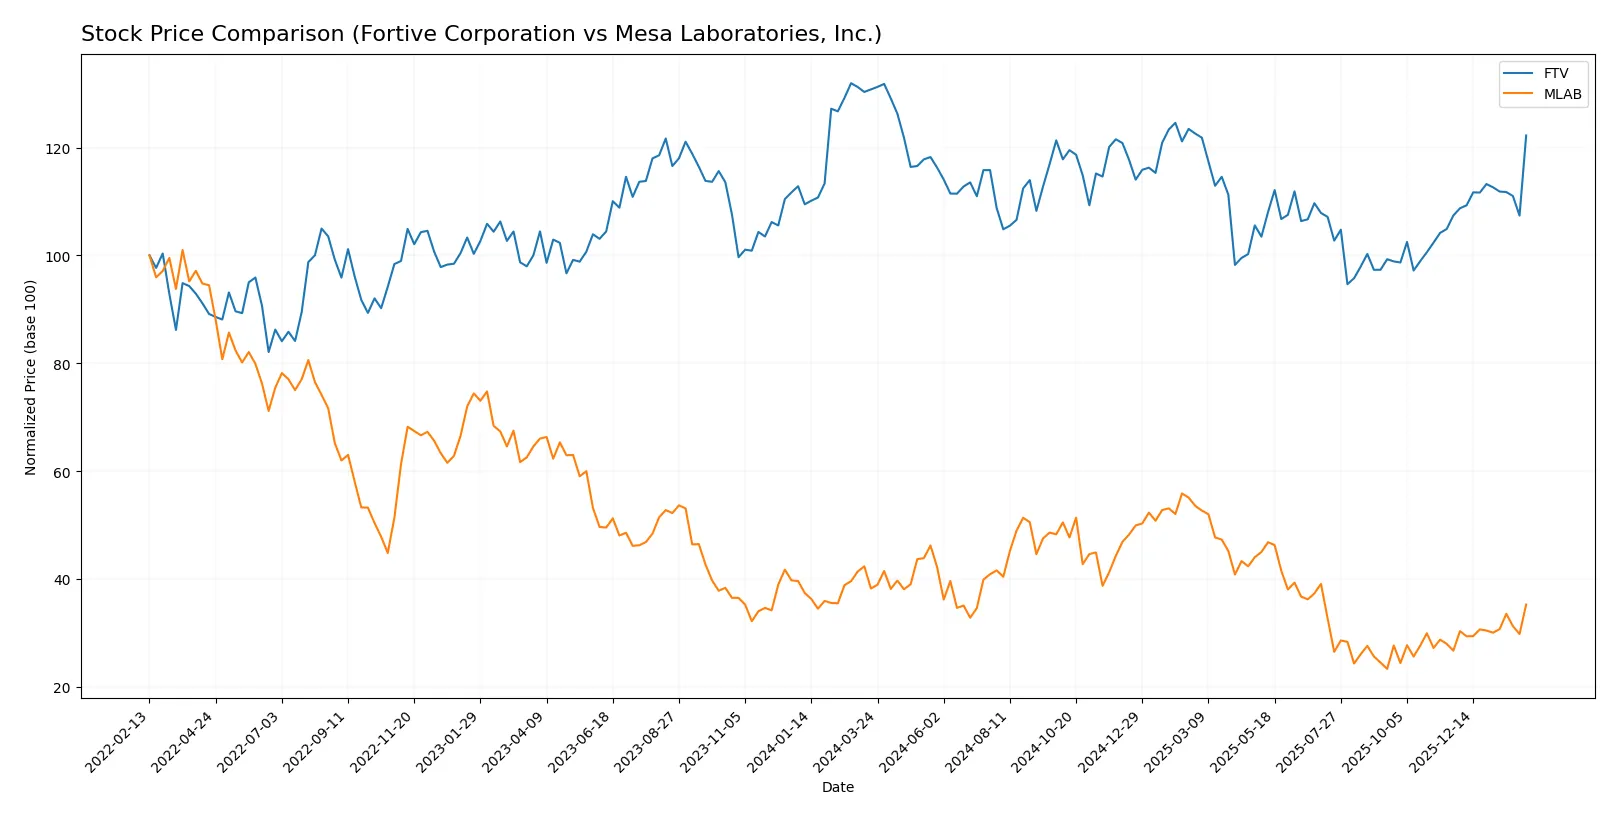
Which stock offers better returns?
Over the past year, both Fortive Corporation and Mesa Laboratories, Inc. experienced overall bearish trends with accelerating declines, yet recent months show marked rebounds in their stock prices.
Trend Comparison
Fortive Corporation’s stock declined 6.53% over the past 12 months, marking a bearish trend with accelerating losses. It ranged from a high of 64.82 to a low of 46.55, showing recent price recovery of 13.82%.
Mesa Laboratories’ stock declined 7.73% over the same period, also bearish with accelerating losses. It showed higher volatility, ranging from 147.79 to 61.66, and a stronger recent rebound of 32.11%.
Mesa Laboratories delivered the highest market performance recently, reversing a steeper decline than Fortive with a 32.11% gain versus Fortive’s 13.82% recovery.
Target Prices
The consensus target prices for Fortive Corporation and Mesa Laboratories reveal clear analyst expectations.
| Company | Target Low | Target High | Consensus |
|---|---|---|---|
| Fortive Corporation | 51 | 70 | 59.83 |
| Mesa Laboratories, Inc. | 94 | 94 | 94 |
Analysts expect Fortive’s stock to trade slightly below current levels, signaling moderate upside potential. Mesa Laboratories shows a firm target matching its current price, indicating stable market confidence.

Don’t Let Luck Decide Your Entry Point
Optimize your entry points with our advanced ProRealTime indicators. You’ll get efficient buy signals with precise price targets for maximum performance. Start outperforming now!
How do institutions grade them?
This section compares the latest institutional grades for Fortive Corporation and Mesa Laboratories, Inc.:
Fortive Corporation Grades
The table below summarizes recent grades issued by reputable financial institutions for Fortive Corporation.
| Grading Company | Action | New Grade | Date |
|---|---|---|---|
| Wells Fargo | Maintain | Equal Weight | 2026-02-05 |
| RBC Capital | Maintain | Sector Perform | 2026-02-05 |
| Citigroup | Maintain | Neutral | 2026-02-05 |
| JP Morgan | Downgrade | Underweight | 2026-01-16 |
| Mizuho | Downgrade | Underperform | 2026-01-05 |
Mesa Laboratories, Inc. Grades
Below are the recent grades from established grading companies for Mesa Laboratories, Inc.
| Grading Company | Action | New Grade | Date |
|---|---|---|---|
| Wells Fargo | Maintain | Equal Weight | 2026-02-04 |
| Wells Fargo | Maintain | Equal Weight | 2025-12-15 |
| Wells Fargo | Upgrade | Equal Weight | 2025-08-08 |
| Evercore ISI Group | Maintain | Outperform | 2024-10-01 |
| Evercore ISI Group | Maintain | Outperform | 2024-08-06 |
Which company has the best grades?
Mesa Laboratories holds relatively stronger ratings, including consistent “Outperform” grades and recent upgrades. Fortive’s grades trend more conservatively, with recent downgrades signaling caution. This contrast may influence investors seeking higher conviction.
Risks specific to each company
The following categories identify the critical pressure points and systemic threats facing both firms in the 2026 market environment:
1. Market & Competition
Fortive Corporation (FTV)
- Operates in diverse industrial and healthcare verticals, facing intense competition from established tech and hardware firms.
Mesa Laboratories, Inc. (MLAB)
- Specializes in niche life sciences and quality control markets, but suffers from limited scale and competitive innovation pressure.
2. Capital Structure & Debt
Fortive Corporation (FTV)
- Maintains moderate leverage with debt-to-assets at 27%, interest coverage strong at 7x, signaling manageable financial risk.
Mesa Laboratories, Inc. (MLAB)
- High debt-to-equity at 1.14 and weak interest coverage of 1.5 raise concerns about debt servicing capacity.
3. Stock Volatility
Fortive Corporation (FTV)
- Beta near 1.03 indicates market-correlated volatility, with stable trading volumes supporting liquidity.
Mesa Laboratories, Inc. (MLAB)
- Beta below 0.9 suggests lower volatility but thinner trading volumes may increase price swings.
4. Regulatory & Legal
Fortive Corporation (FTV)
- Exposure to varied regulations across industrial and healthcare sectors demands robust compliance systems.
Mesa Laboratories, Inc. (MLAB)
- Faces regulatory scrutiny in life sciences and clinical genomics, where compliance complexity is rising.
5. Supply Chain & Operations
Fortive Corporation (FTV)
- Global operations in manufacturing and software services subject to supply chain disruptions and raw material cost inflation.
Mesa Laboratories, Inc. (MLAB)
- Smaller scale and specialized equipment manufacturing increase vulnerability to supplier concentration risks.
6. ESG & Climate Transition
Fortive Corporation (FTV)
- Industry pressures to improve sustainability and reduce emissions require ongoing investments and strategic shifts.
Mesa Laboratories, Inc. (MLAB)
- ESG initiatives less mature, with potential reputational risks as investor focus on climate impact intensifies.
7. Geopolitical Exposure
Fortive Corporation (FTV)
- Broad international footprint exposes it to trade tensions, tariffs, and geopolitical volatility.
Mesa Laboratories, Inc. (MLAB)
- More domestically focused but still exposed to global supply chain disruptions and regional regulatory changes.
Which company shows a better risk-adjusted profile?
Fortive’s manageable debt levels, diversified market presence, and safe-zone Altman Z-score provide a stronger risk posture. Mesa Laboratories struggles with high leverage and a distress-zone bankruptcy risk, despite a niche market position. Fortive’s operational scale and financial stability mitigate volatility and regulatory pressures more effectively.
Final Verdict: Which stock to choose?
Fortive Corporation’s superpower lies in its operational efficiency and steady cash generation, supporting a resilient business model. However, its stretched liquidity metrics warrant close monitoring as a point of vigilance. It fits well within an Aggressive Growth portfolio focused on operational turnaround and value creation.
Mesa Laboratories boasts a strategic moat centered on niche market specialization and recurring revenue stability. While it shows weaker profitability and higher leverage than Fortive, it offers a relatively safer profile through consistent free cash flow yield. This stock suits a GARP (Growth at a Reasonable Price) portfolio seeking potential turnaround with moderate risk.
If you prioritize operational efficiency and improving profitability, Fortive is the compelling choice due to its growing ROIC trend despite current value destruction. However, if you seek growth potential tempered by niche market positioning, Mesa Laboratories offers better stability in free cash flow generation, albeit with more pronounced financial risks. Both require careful risk assessment aligned with your investment horizon.
Disclaimer: Investment carries a risk of loss of initial capital. The past performance is not a reliable indicator of future results. Be sure to understand risks before making an investment decision.
Go Further
I encourage you to read the complete analyses of Fortive Corporation and Mesa Laboratories, Inc. to enhance your investment decisions: