Home > Comparison > Technology > JBL vs FTV
The strategic rivalry between Jabil Inc. and Fortive Corporation shapes the future of the technology hardware sector. Jabil operates as a capital-intensive electronics manufacturing services provider, while Fortive focuses on engineered products and software solutions. This analysis contrasts Jabil’s scale-driven manufacturing model with Fortive’s precision technology and software integration. I aim to identify which company presents a superior risk-adjusted investment opportunity in this evolving competitive landscape.
Table of contents
Companies Overview
Jabil Inc. and Fortive Corporation both hold prominent roles in the hardware and equipment sector, shaping industrial innovation in 2026.
Jabil Inc.: Global Electronics Manufacturing Powerhouse
Jabil Inc. dominates as a leading electronics manufacturing services provider, generating revenue through electronics design, production, and product management. Its core strength lies in offering integrated solutions from design to manufacturing across multiple industries, including 5G and automotive. In 2026, Jabil emphasizes expanding its diversified manufacturing capabilities to capture growth in emerging technology sectors.
Fortive Corporation: Precision Engineering & Software Innovator
Fortive Corporation stands out as a professional and engineered products leader, focusing on software and hardware for industrial and healthcare markets. Revenue stems from connected reliability tools, enterprise software, and precision instruments marketed under multiple specialized brands. Fortive’s 2026 strategy centers on enhancing intelligent operating solutions and healthcare technology to bolster its recurring revenue streams.
Strategic Collision: Similarities & Divergences
Both companies operate in hardware and equipment, but diverge sharply in business philosophy. Jabil pursues a manufacturing-centric, full-service model, while Fortive leans on software-driven, branded solutions. Their primary competitive battleground lies in industrial innovation and smart technology adoption. Investors will note Jabil’s scale and diversification contrast with Fortive’s niche focus and software integration, defining distinct risk and growth profiles.
Income Statement Comparison
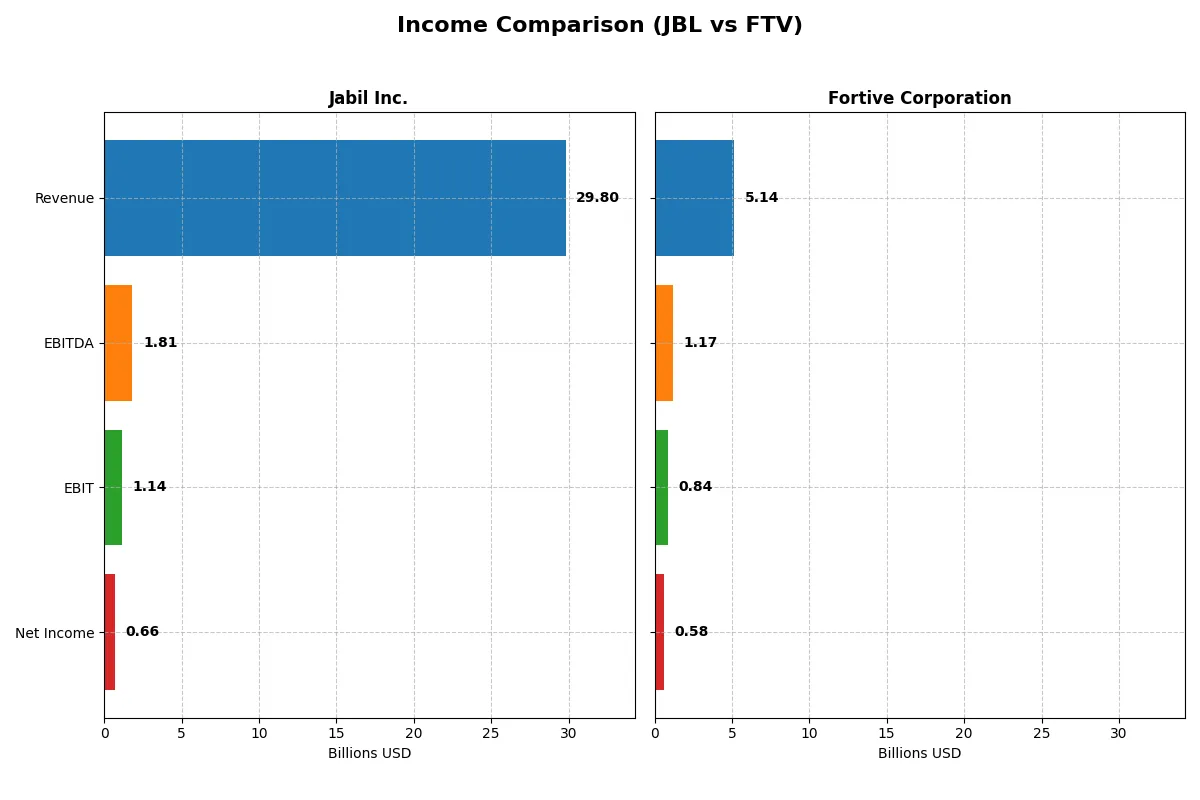
This data dissects the core profitability and scalability of both corporate engines to reveal who dominates the bottom line:
| Metric | Jabil Inc. (JBL) | Fortive Corporation (FTV) |
|---|---|---|
| Revenue | 29.8B | 5.14B |
| Cost of Revenue | 27.2B | 2.01B |
| Operating Expenses | 1.46B | 2.23B |
| Gross Profit | 2.65B | 3.13B |
| EBITDA | 1.81B | 1.17B |
| EBIT | 1.14B | 843M |
| Interest Expense | 244M | 121M |
| Net Income | 657M | 579M |
| EPS | 6.00 | 1.75 |
| Fiscal Year | 2025 | 2025 |
Income Statement Analysis: The Bottom-Line Duel
This income statement comparison reveals which company operates with greater efficiency and profit discipline over recent years.
Jabil Inc. Analysis
Jabil’s revenue shows moderate growth, rising to $29.8B in 2025 from $29B in 2021. Net income, however, declined sharply to $657M in 2025 from $696M in 2021, reflecting margin pressure. Gross margin holds steady near 8.9%, but net margin slipped to 2.2%, signaling worsening bottom-line efficiency. The 2025 drop in EBIT and net income marks a clear momentum loss.
Fortive Corporation Analysis
Fortive’s revenue declined from $5.25B in 2021 to $5.14B in 2025, with net income also falling to $579M from $573M over the same period. Despite shrinking top line, Fortive maintains strong margin health: gross margin exceeds 60%, and net margin stands at 11.3%. The 2025 results reflect a contraction in earnings but still outperform Jabil in margin stability and operating efficiency.
Verdict: Margin Strength vs. Revenue Size
Fortive leads with superior margins and better capital efficiency, despite modest revenue declines. Jabil’s larger scale is undermined by deteriorating profitability and margin compression. For investors prioritizing quality earnings and margin resilience, Fortive presents a more compelling profile than Jabil’s volume-driven but margin-challenged model.
Financial Ratios Comparison
These vital ratios act as a diagnostic tool to expose the underlying fiscal health, valuation premiums, and capital efficiency of the companies compared below:
| Ratios | Jabil Inc. (JBL) | Fortive Corporation (FTV) |
|---|---|---|
| ROE | 43.4% | 9.0% |
| ROIC | 16.1% | 7.4% |
| P/E | 34.1 | 30.2 |
| P/B | 14.8 | 2.7 |
| Current Ratio | 1.00 | 0.71 |
| Quick Ratio | 0.66 | 0.58 |
| D/E (Debt-to-Equity) | 2.22 | 0.50 |
| Debt-to-Assets | 18.2% | 27.3% |
| Interest Coverage | 4.8x | 7.5x |
| Asset Turnover | 1.61 | 0.44 |
| Fixed Asset Turnover | 9.01 | 19.1 |
| Payout ratio | 5.5% | 15.9% |
| Dividend yield | 0.16% | 0.53% |
| Fiscal Year | 2025 | 2025 |
Efficiency & Valuation Duel: The Vital Signs
Financial ratios act as the company’s DNA, uncovering hidden risks and revealing operational excellence that drives shareholder value.
Jabil Inc.
Jabil posts a strong 43.4% ROE and a robust 16.1% ROIC, signaling efficient capital use. Yet, a 34.1 P/E ratio marks the stock as expensive relative to earnings. Dividend yield lags at 0.16%, indicating limited shareholder payouts and potential reinvestment in growth or operations.
Fortive Corporation
Fortive delivers an impressive 11.3% net margin but a modest 9.0% ROE, reflecting moderate profitability. The 30.2 P/E ratio suggests a stretched valuation, while a 0.53% dividend yield provides some income. Its capital structure is conservative, supporting a balanced shareholder return approach.
Premium Valuation vs. Operational Efficiency
Jabil’s high ROE and ROIC demonstrate superior operational efficiency but come with stretched valuation and weak dividend support. Fortive offers better net margins and a safer capital structure but lower equity returns. Risk-tolerant investors may prefer Jabil’s growth profile; conservative investors might favor Fortive’s steadiness.
Which one offers the Superior Shareholder Reward?
I compare Jabil Inc. (JBL) and Fortive Corporation (FTV) on their shareholder returns through dividends and buybacks. JBL yields a scant 0.16% with a very low payout ratio (~5.5%), supported by free cash flow coverage above 70%, signaling prudence. Its buyback intensity remains modest, limiting total capital returns. FTV offers a stronger dividend yield near 0.53%, with a payout ratio around 13–16%, yet maintains high free cash flow conversion (~90%), enabling robust share repurchases. Historically, FTV’s superior operating margins (16%+ EBIT vs. JBL’s ~4%) and sustainable cash flows underpin a more aggressive capital return policy. I see FTV’s blend of dividends and buybacks as a more balanced, sustainable model for long-term total shareholder return in 2026. Therefore, I favor Fortive for superior shareholder reward given its higher yield, consistent buybacks, and stronger cash flow fundamentals.
Comparative Score Analysis: The Strategic Profile
The radar chart reveals the fundamental DNA and strategic trade-offs of Jabil Inc. and Fortive Corporation, highlighting their financial strengths and vulnerabilities:
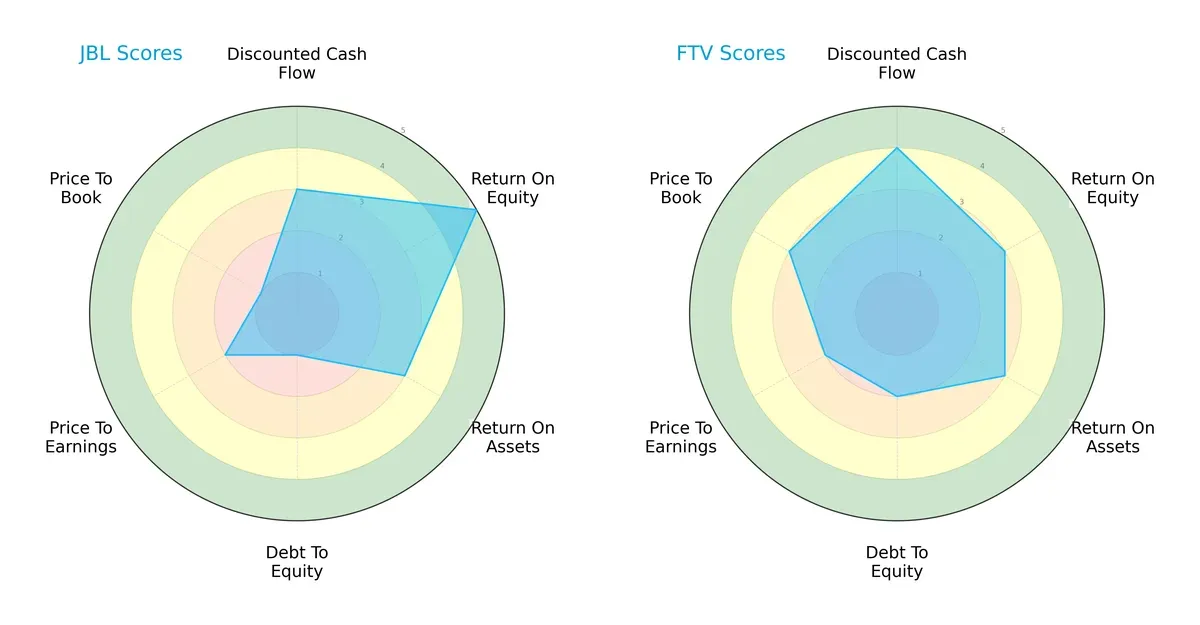
Jabil Inc. shows a pronounced edge in Return on Equity (5 vs. 3), signaling superior shareholder profitability. Fortive leads in Discounted Cash Flow (4 vs. 3) and Price-to-Book (3 vs. 1), indicating better valuation metrics and cash flow prospects. However, Jabil’s very low Debt/Equity score (1 vs. 2) flags significant leverage risk. Fortive’s profile is more balanced, relying on moderate strengths across metrics, while Jabil depends heavily on its ROE advantage but carries financial risk from high leverage.
Bankruptcy Risk: Solvency Showdown
The Altman Z-Score difference favors Fortive, suggesting a stronger solvency position and lower bankruptcy risk in this cycle:
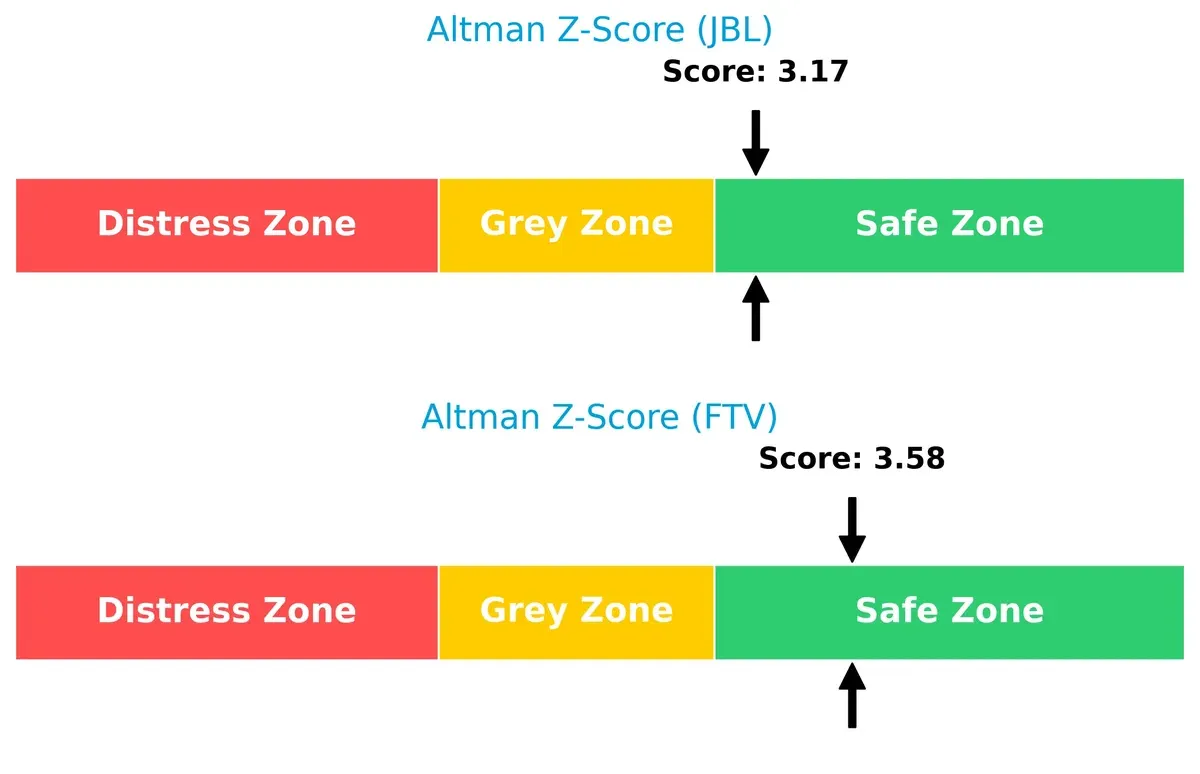
Fortive’s score of 3.58 places it comfortably in the safe zone, while Jabil’s 3.17, though also safe, is closer to the grey area threshold. This indicates Fortive’s balance sheet is more resilient to economic shocks.
Financial Health: Quality of Operations
Jabil slightly outperforms Fortive in Piotroski F-Score, reflecting stronger operational fundamentals and internal financial health:
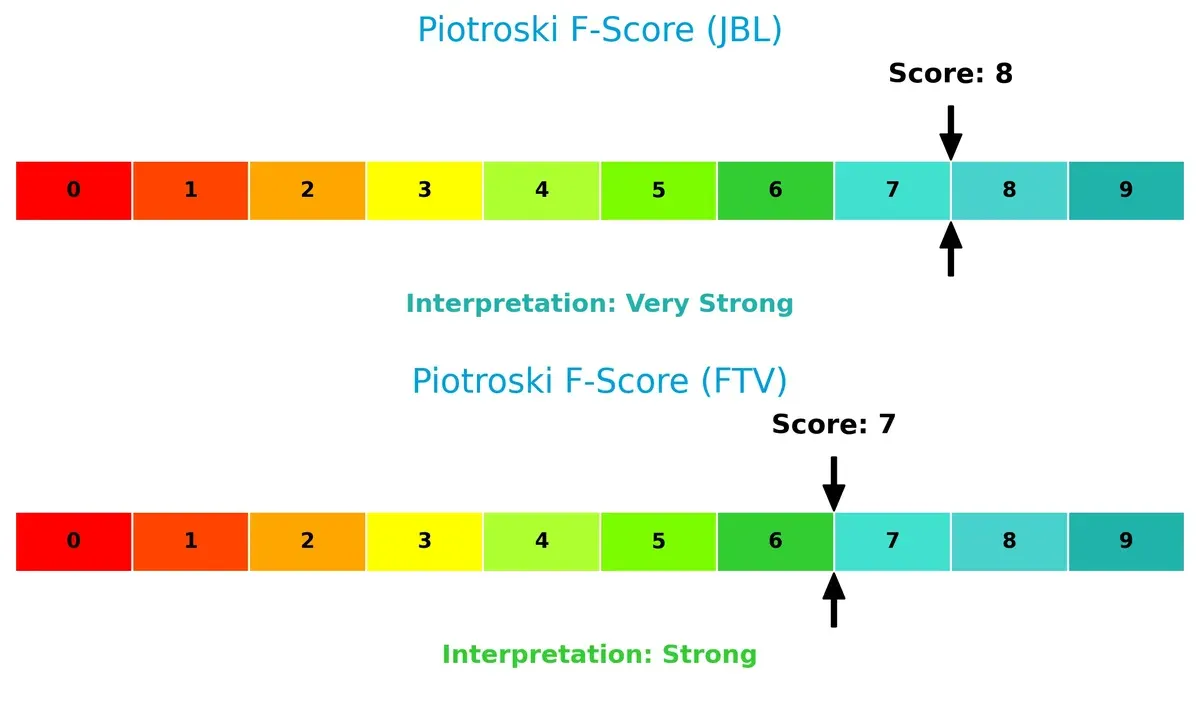
Jabil scores an 8 (very strong), signaling robust profitability, liquidity, and efficiency. Fortive’s 7 (strong) is solid but suggests slightly less internal strength. Neither shows red flags, but Jabil edges ahead on quality metrics, reinforcing its operational competence despite leverage concerns.
How are the two companies positioned?
This section dissects the operational DNA of JBL and FTV by comparing their revenue distribution by segment and internal dynamics. The goal is to confront their economic moats and reveal which model offers the most resilient competitive advantage today.
Revenue Segmentation: The Strategic Mix
The following visual comparison dissects how Jabil Inc. and Fortive Corporation diversify their income streams and where their primary sector bets lie:
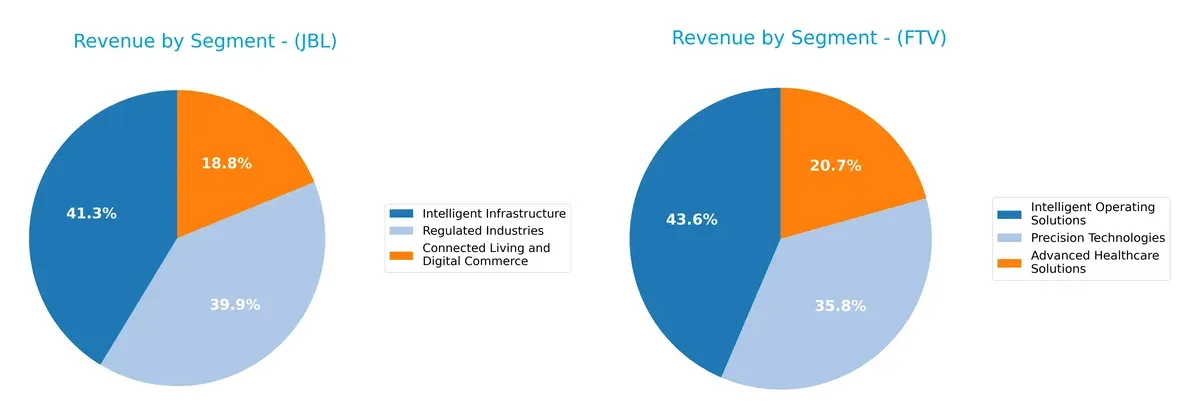
Jabil Inc. anchors its 2025 revenue primarily in Intelligent Infrastructure ($12.3B) and Regulated Industries ($11.9B), with Connected Living adding $5.6B. This mix shows moderate diversification across technology-driven sectors. Fortive leans on Intelligent Operating Solutions ($2.7B) and Precision Technologies ($2.2B), with Advanced Healthcare Solutions at $1.3B, reflecting a more balanced but smaller scale portfolio. Jabil’s scale dwarfs Fortive’s, but it faces concentration risk in infrastructure, while Fortive pivots among niche industrial segments.
Strengths and Weaknesses Comparison
This table compares the Strengths and Weaknesses of Jabil Inc. and Fortive Corporation:
Jabil Inc. Strengths
- High ROE at 43.42%
- ROIC above WACC at 16.06%
- Strong asset and fixed asset turnover
- Diversified revenue streams across Connected Living, Infrastructure, and Regulated Industries
- Global presence including US, Mexico, China, Singapore
Fortive Corporation Strengths
- Strong net margin at 11.26%
- Favorable debt to equity and interest coverage ratios
- High fixed asset turnover at 19.06
- Diverse segments in Healthcare, Operating Solutions, and Precision Technologies
- Significant US market revenue with growing presence in China and other countries
Jabil Inc. Weaknesses
- Low net margin at 2.2%
- Unfavorable PE and PB ratios indicating valuation concerns
- Quick ratio below 1 signals liquidity risk
- High debt to equity at 2.22
- Low dividend yield at 0.16%
- Slightly unfavorable overall ratio profile
Fortive Corporation Weaknesses
- Lower ROE at 8.98%
- Net margin leads but ROIC is only neutral at 7.44%
- Current and quick ratios below 1 indicate liquidity pressure
- Unfavorable PE ratio
- Dividend yield weak at 0.53%
Jabil’s strengths lie in capital efficiency and diversified global revenue, but weak profitability and liquidity ratios pose risks. Fortive exhibits better profitability and stronger debt management, though its lower ROE and liquidity ratios require attention in strategic planning.
The Moat Duel: Analyzing Competitive Defensibility
A structural moat is the sole fortress shielding long-term profits from relentless competitive erosion. Let’s examine how these two firms defend their turf:
Jabil Inc.: Operational Efficiency Moat
Jabil’s competitive edge stems from cost advantage through scale and manufacturing expertise. Its ROIC outpaces WACC by nearly 7%, signaling strong value creation. In 2026, diversification into 5G and automotive sectors could deepen this moat.
Fortive Corporation: Innovation and Brand Moat
Fortive leverages intangible assets via proprietary software and specialized tools, contrasting Jabil’s cost focus. Despite a negative ROIC-WACC spread, its rising ROIC hints at improving profitability. Expansion in healthcare and industrial IoT offers growth catalysts.
Cost Leadership vs. Innovation-Driven Moats
Jabil’s wider moat benefits from consistent value creation and margin stability. Fortive shows promise with innovation but currently sheds value. Jabil stands better positioned to defend market share amid competitive pressures in 2026.
Which stock offers better returns?
The past year reveals stark contrasts: Jabil Inc. surged over 100%, showing strong acceleration, while Fortive Corporation fell over 6%, despite a recent modest rebound.
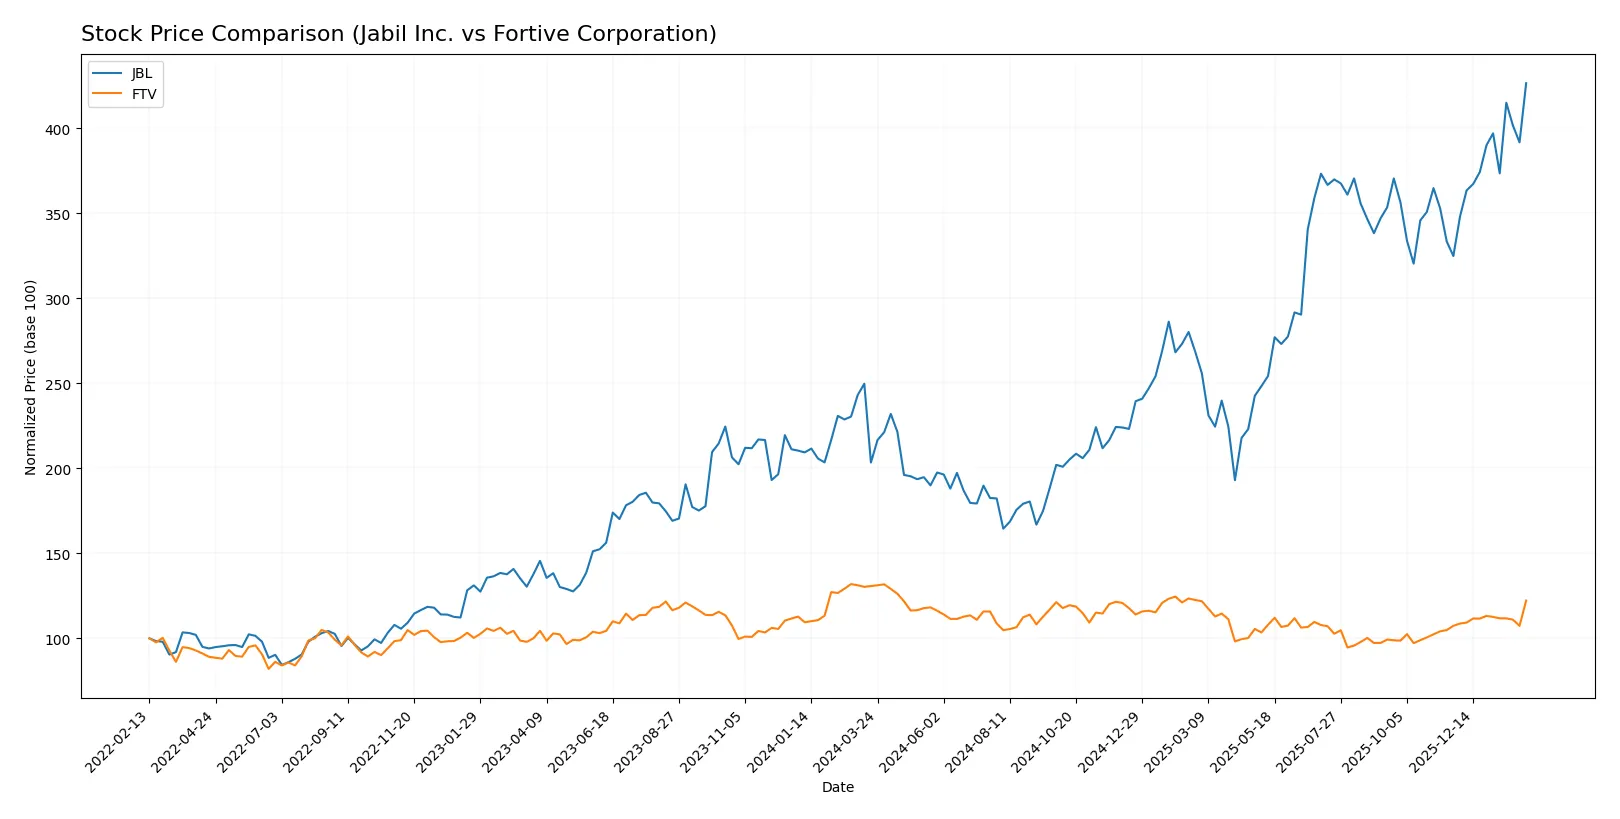
Trend Comparison
Jabil Inc. posted a 109.7% gain over 12 months, marking a bullish trend with accelerating momentum and a high volatility level of 45.33. The stock hit a peak at 258.25 and a low near 99.62.
Fortive Corporation declined 6.53% over the same period, signaling a bearish trend but with accelerating price movement. Volatility remained low at 4.16, with a recent gain of 13.82% showing mild recovery.
Jabil’s strong upward momentum and significant returns clearly outperform Fortive’s bearish trend and limited recent gains over the analyzed year.
Target Prices
Analysts present a clear consensus on target prices for Jabil Inc. and Fortive Corporation.
| Company | Target Low | Target High | Consensus |
|---|---|---|---|
| Jabil Inc. | 244 | 283 | 267.25 |
| Fortive Corporation | 51 | 70 | 59.83 |
Jabil’s consensus target at 267.25 slightly exceeds its current price of 258.25, signaling modest upside potential. Fortive’s target consensus at 59.83 aligns closely with its current price of 60.12, suggesting limited near-term price movement.

Don’t Let Luck Decide Your Entry Point
Optimize your entry points with our advanced ProRealTime indicators. You’ll get efficient buy signals with precise price targets for maximum performance. Start outperforming now!
How do institutions grade them?
The following tables summarize recent institutional grades for Jabil Inc. and Fortive Corporation:
Jabil Inc. Grades
Below are Jabil Inc.’s recent grades from leading financial institutions:
| Grading Company | Action | New Grade | Date |
|---|---|---|---|
| Barclays | Maintain | Overweight | 2025-12-18 |
| UBS | Maintain | Neutral | 2025-12-18 |
| JP Morgan | Maintain | Overweight | 2025-12-18 |
| B of A Securities | Maintain | Buy | 2025-12-10 |
| Barclays | Maintain | Overweight | 2025-09-26 |
| B of A Securities | Maintain | Buy | 2025-09-26 |
| JP Morgan | Maintain | Overweight | 2025-07-17 |
| B of A Securities | Maintain | Buy | 2025-06-20 |
| UBS | Maintain | Neutral | 2025-06-18 |
| Goldman Sachs | Maintain | Buy | 2025-06-18 |
Fortive Corporation Grades
Here are Fortive Corporation’s recent ratings from reputable grading firms:
| Grading Company | Action | New Grade | Date |
|---|---|---|---|
| Wells Fargo | Maintain | Equal Weight | 2026-02-05 |
| RBC Capital | Maintain | Sector Perform | 2026-02-05 |
| Citigroup | Maintain | Neutral | 2026-02-05 |
| JP Morgan | Downgrade | Underweight | 2026-01-16 |
| Mizuho | Downgrade | Underperform | 2026-01-05 |
| Wells Fargo | Maintain | Equal Weight | 2025-12-22 |
| Citigroup | Maintain | Neutral | 2025-12-08 |
| Morgan Stanley | Maintain | Equal Weight | 2025-11-05 |
| Baird | Maintain | Outperform | 2025-11-04 |
| JP Morgan | Maintain | Neutral | 2025-10-30 |
Which company has the best grades?
Jabil Inc. holds generally stronger grades, with multiple Buy and Overweight ratings. Fortive shows more cautious sentiment, including downgrades to Underweight and Underperform. This divergence likely influences investor confidence and portfolio positioning.
Risks specific to each company
The following categories identify critical pressure points and systemic threats facing Jabil Inc. and Fortive Corporation in the 2026 market environment:
1. Market & Competition
Jabil Inc.
- Faces intense competition in electronics manufacturing services with thin net margins (2.2%).
Fortive Corporation
- Competes in professional engineered products with stronger net margins (11.26%) and diversified brand portfolio.
2. Capital Structure & Debt
Jabil Inc.
- High debt-to-equity ratio (2.22) signals leverage risk despite moderate interest coverage (4.66x).
Fortive Corporation
- Lower debt-to-equity (0.5) and higher interest coverage (7x) indicate stronger balance sheet stability.
3. Stock Volatility
Jabil Inc.
- Beta at 1.24 shows above-market volatility, increasing risk in turbulent markets.
Fortive Corporation
- Beta near 1.03 suggests stock moves close to market, implying moderate volatility.
4. Regulatory & Legal
Jabil Inc.
- Exposure to global regulatory compliance in electronics manufacturing, including product safety and environmental laws.
Fortive Corporation
- Faces regulatory scrutiny in healthcare, safety, and industrial software sectors, with complex compliance demands.
5. Supply Chain & Operations
Jabil Inc.
- Relies on global supply chains vulnerable to disruptions; hardware production sensitive to component shortages.
Fortive Corporation
- Operations diversified across software and hardware, somewhat insulating from pure supply chain shocks.
6. ESG & Climate Transition
Jabil Inc.
- Manufacturing footprint exposes company to ESG risks; pressure to innovate sustainable processes.
Fortive Corporation
- Stronger focus on environment, health, and safety software positions it favorably amid climate transition demands.
7. Geopolitical Exposure
Jabil Inc.
- Global manufacturing footprint exposes it to trade tensions, tariffs, and geopolitical uncertainties.
Fortive Corporation
- More US-centric operations reduce exposure but still face risks in international markets.
Which company shows a better risk-adjusted profile?
Fortive’s key strength lies in its lower leverage and better net margins, which mitigate financial risk in volatile markets. Jabil’s elevated debt and stock volatility present greater risk despite operational scale. Fortive’s safer Altman Z-Score (3.58 vs. 3.17) and solid Piotroski score support a stronger financial foundation. However, Jabil’s superior ROE (43.4%) reflects operational efficiency but is undermined by its risk profile. Overall, Fortive offers a better risk-adjusted profile in 2026, backed by prudent capital structure and diversified business segments.
Final Verdict: Which stock to choose?
Jabil Inc. (JBL) excels as a value creator with a very favorable moat driven by growing ROIC well above its cost of capital. Its superpower lies in efficient capital allocation and robust return on equity. A point of vigilance remains its mixed liquidity and elevated leverage. JBL suits an aggressive growth portfolio seeking strong profitability expansion.
Fortive Corporation (FTV) offers a strategic moat anchored in intangible assets and steady free cash flow generation. It delivers safer financials with lower leverage and a solid Altman Z-Score, but its ROIC lags WACC, signaling value erosion despite improving profitability. FTV fits a GARP (Growth at a Reasonable Price) portfolio balancing growth with risk control.
If you prioritize high return on invested capital and dynamic growth, Jabil outshines with clear value creation and accelerating momentum. However, if you seek better balance sheet stability and consistent cash flow with moderate growth, Fortive offers a safer analytical scenario despite its premium valuation. Both require vigilance on growth headwinds and capital structure risks.
Disclaimer: Investment carries a risk of loss of initial capital. The past performance is not a reliable indicator of future results. Be sure to understand risks before making an investment decision.
Go Further
I encourage you to read the complete analyses of Jabil Inc. and Fortive Corporation to enhance your investment decisions: