Home > Comparison > Technology > FTNT vs ZS
The strategic rivalry between Fortinet, Inc. and Zscaler, Inc. shapes the cybersecurity software infrastructure landscape. Fortinet operates as a broad, integrated hardware and software security provider with a capital-intensive model. In contrast, Zscaler delivers cloud-native security solutions emphasizing scalable, software-as-a-service platforms. This analysis explores their contrasting operational models and competitive dynamics to identify which offers a superior risk-adjusted return potential for diversified portfolios amid evolving technology demands.
Table of contents
Companies Overview
Fortinet and Zscaler are pivotal players in the cybersecurity software infrastructure market, shaping digital defense strategies worldwide.
Fortinet, Inc.: Integrated Cybersecurity Powerhouse
Fortinet dominates with its broad, integrated cybersecurity solutions spanning hardware and software. Its revenue primarily derives from FortiGate licenses and security subscriptions. In 2026, the company emphasizes expanding automated threat detection and enterprise network security, leveraging a diverse product family for firewalls, endpoint protection, and multi-factor authentication.
Zscaler, Inc.: Cloud Security Innovator
Zscaler leads as a cloud-native security platform provider, generating revenue through subscription-based access to secure internet and private applications. Its 2026 strategy focuses on enhancing digital experience monitoring and workload segmentation. Zscaler targets secure, scalable cloud access, emphasizing SaaS and private cloud environments for diverse global industries.
Strategic Collision: Similarities & Divergences
Fortinet’s strategy anchors on a hardware-software integrated ecosystem, while Zscaler pursues a fully cloud-based, software-defined approach. They compete fiercely in network security, but Fortinet targets on-premise and hybrid environments, Zscaler bets on cloud-native security dominance. Their investment profiles diverge: Fortinet offers stability with broad solutions, Zscaler carries growth potential through cloud innovation.
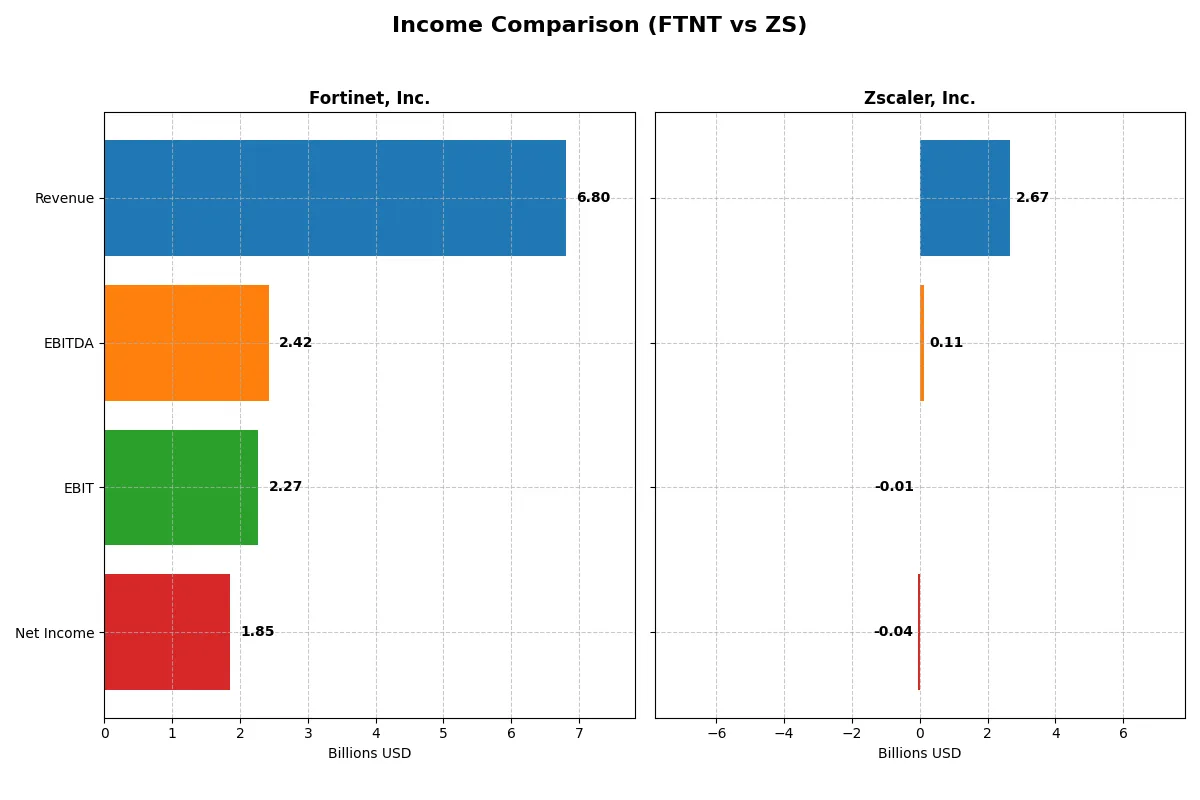
Income Statement Comparison
This data dissects the core profitability and scalability of both corporate engines to reveal who dominates the bottom line:
| Metric | Fortinet, Inc. (FTNT) | Zscaler, Inc. (ZS) |
|---|---|---|
| Revenue | 6.80B | 2.67B |
| Cost of Revenue | 1.30B | 618M |
| Operating Expenses | 3.42B | 2.18B |
| Gross Profit | 5.50B | 2.05B |
| EBITDA | 2.42B | 112M |
| EBIT | 2.27B | -8.8M |
| Interest Expense | 20M | 9.5M |
| Net Income | 1.85B | -41M |
| EPS | 2.44 | -0.27 |
| Fiscal Year | 2025 | 2025 |
Income Statement Analysis: The Bottom-Line Duel
This income statement comparison reveals which company converts revenue into profit more efficiently and sustains healthier margins over time.
Fortinet, Inc. Analysis
Fortinet’s revenue grew steadily from 3.3B in 2021 to nearly 6.8B in 2025, doubling in five years. Its net income surged 205%, reaching 1.85B in 2025. Fortinet maintains robust gross (81%) and net margins (27%), signaling strong cost control and operational efficiency. The 2025 figures show continued momentum with a 14% revenue increase and stable profitability.
Zscaler, Inc. Analysis
Zscaler expanded its revenue nearly fourfold, from 673M in 2021 to 2.67B in 2025. Despite this rapid growth, it posted net losses through 2025, though losses narrowed significantly. Gross margin remains solid at 77%, but negative EBIT and net margins indicate ongoing challenges in scaling profitably. The 2025 results reflect improving trends, with a 23% revenue rise and reduced net losses.
Growth Scale vs. Profitability Strength
Fortinet leads with superior profitability and consistent margin expansion, converting scale into sustainable earnings. Zscaler excels in top-line growth but struggles to achieve positive net income and operating efficiency. Investors seeking stable earnings will find Fortinet’s profile more attractive, while Zscaler suits those prioritizing aggressive growth despite current losses.
Financial Ratios Comparison
These vital ratios act as a diagnostic tool to expose the underlying fiscal health, valuation premiums, and capital efficiency of the companies analyzed:
| Ratios | Fortinet, Inc. (FTNT) | Zscaler, Inc. (ZS) |
|---|---|---|
| ROE | 1.50 | -0.02 |
| ROIC | 0.29 | -0.03 |
| P/E | 32.48 | -1063.01 |
| P/B | 48.64 | 24.51 |
| Current Ratio | 1.17 | 2.01 |
| Quick Ratio | 1.09 | 2.01 |
| D/E | 0.81 | 1.00 |
| Debt-to-Assets | 0.10 | 0.28 |
| Interest Coverage | 103.72 | -13.49 |
| Asset Turnover | 0.65 | 0.42 |
| Fixed Asset Turnover | 4.20 | 4.22 |
| Payout ratio | 0 | 0 |
| Dividend yield | 0 | 0 |
| Fiscal Year | 2025 | 2025 |
Efficiency & Valuation Duel: The Vital Signs
Financial ratios serve as a company’s DNA, revealing both hidden risks and operational excellence crucial for investment decisions.
Fortinet, Inc.
Fortinet exhibits robust profitability with a ROE of 149.77% and a strong net margin of 27.26%, signaling operational efficiency. The stock trades at a stretched P/E of 32.48 and a high P/B of 48.64, indicating an expensive valuation. Fortinet returns value mainly through reinvestment in R&D, as it pays no dividend.
Zscaler, Inc.
Zscaler suffers weak profitability, with a negative ROE of -2.31% and a net margin of -1.55%, reflecting operational challenges. Valuation appears distorted with a highly negative P/E but a moderate P/B of 24.51, suggesting investor skepticism. The company also does not pay dividends, focusing on growth investments amid ongoing losses.
Premium Valuation vs. Operational Safety
Fortinet offers superior profitability and operational strength but at a premium valuation, while Zscaler struggles with profitability despite lower valuation metrics. Fortinet suits investors prioritizing operational excellence, whereas Zscaler fits those seeking high-growth potential amid elevated risk.
Which one offers the Superior Shareholder Reward?
Fortinet and Zscaler both skip dividends, focusing on reinvestment and buybacks. Fortinet boasts a stronger free cash flow (2.9B per share), high operating margins (~30%), and a robust buyback capacity given its low debt-to-assets (~9.6%). Zscaler, while growing revenue per share faster, suffers consistent net losses and relies heavily on equity financing with a debt-to-assets ratio near 28%. Fortinet’s conservative capital allocation and buyback discipline offer more sustainable shareholder rewards in 2026. I conclude Fortinet provides a superior total return profile due to better profitability, cash flow conversion, and prudent leverage management.
Comparative Score Analysis: The Strategic Profile
The radar chart reveals the fundamental DNA and trade-offs of Fortinet, Inc. and Zscaler, Inc., showcasing their financial strengths and vulnerabilities:
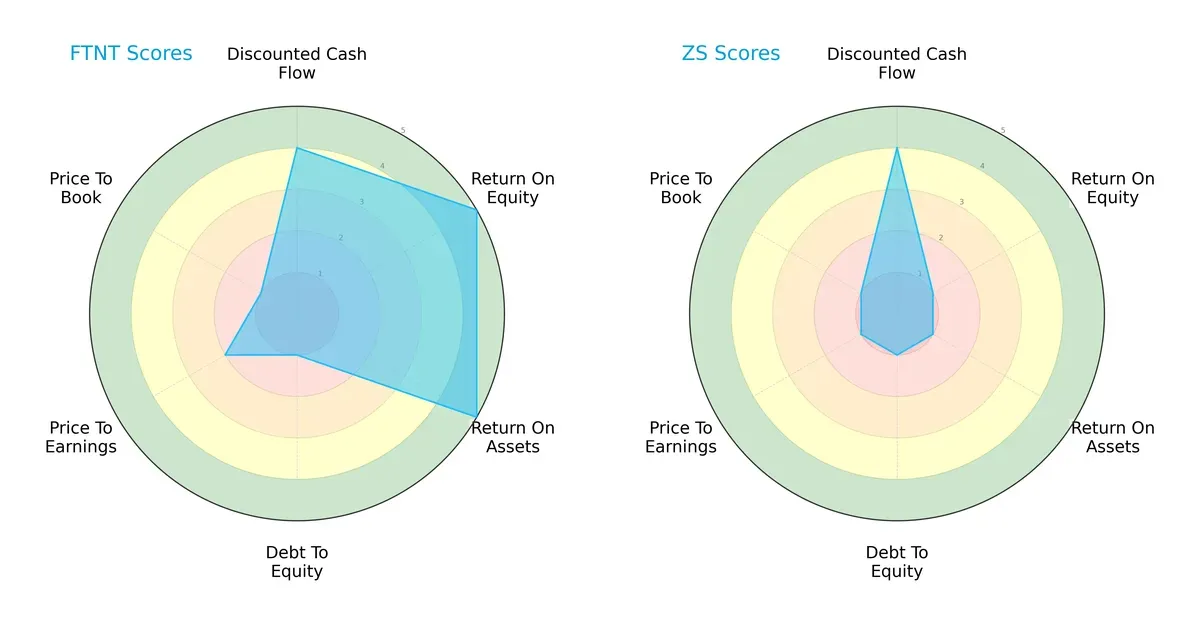
Fortinet exhibits a balanced profile with very favorable ROE and ROA scores, indicating efficient profit generation and asset utilization. However, its debt-to-equity and valuation metrics lag, signaling financial risk and possible overvaluation. Zscaler, by contrast, relies heavily on a favorable discounted cash flow score but scores very low on profitability and valuation, reflecting operational challenges and high risk. Fortinet’s diversified strengths position it better for stability, while Zscaler depends on a single valuation advantage.
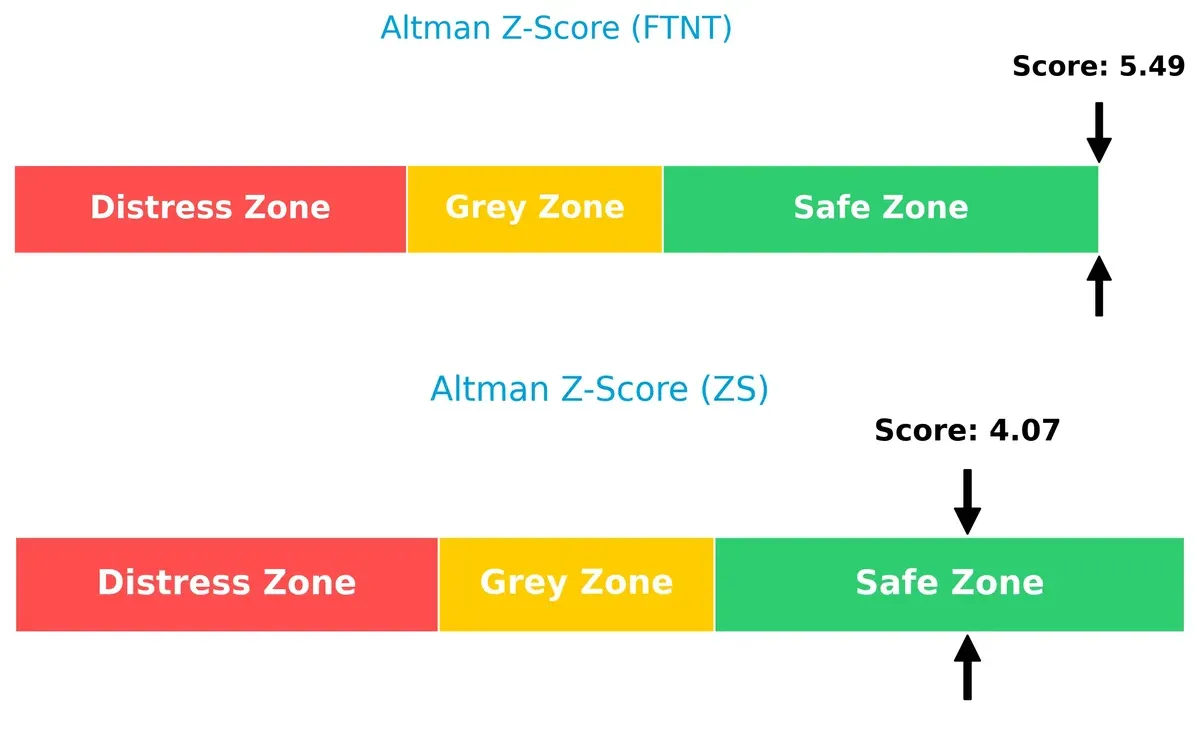
Bankruptcy Risk: Solvency Showdown
Fortinet’s Altman Z-Score of 5.49 versus Zscaler’s 4.07 places both firms safely above distress thresholds. This gap confirms Fortinet’s stronger solvency and lower bankruptcy risk in this cycle:
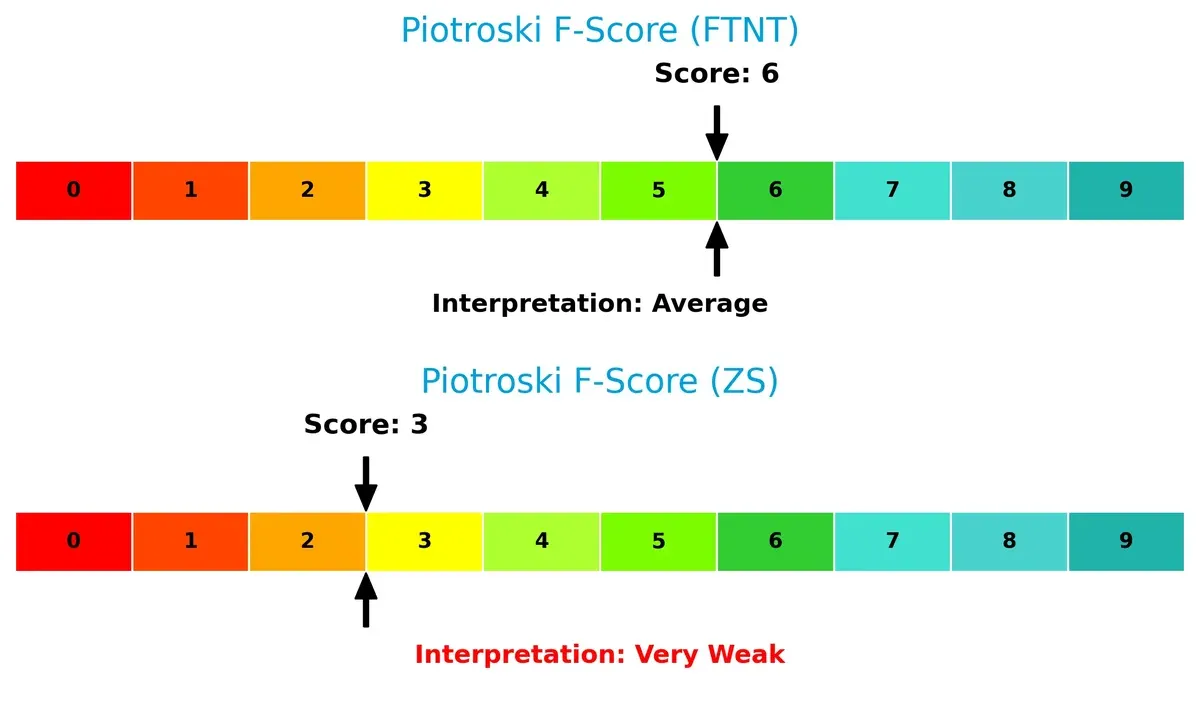
Financial Health: Quality of Operations
Fortinet’s Piotroski F-Score of 6 signals solid financial health and operational quality. Zscaler’s score of 3 raises red flags, indicating weaker internal metrics and potential financial instability:
How are the two companies positioned?
This section dissects the operational DNA of Fortinet and Zscaler by comparing their revenue distribution and internal dynamics. The goal is to confront their economic moats and identify which business model delivers the most resilient competitive advantage today.
Revenue Segmentation: The Strategic Mix
This visual comparison dissects how Fortinet and Zscaler diversify their income streams and where their primary sector bets lie:
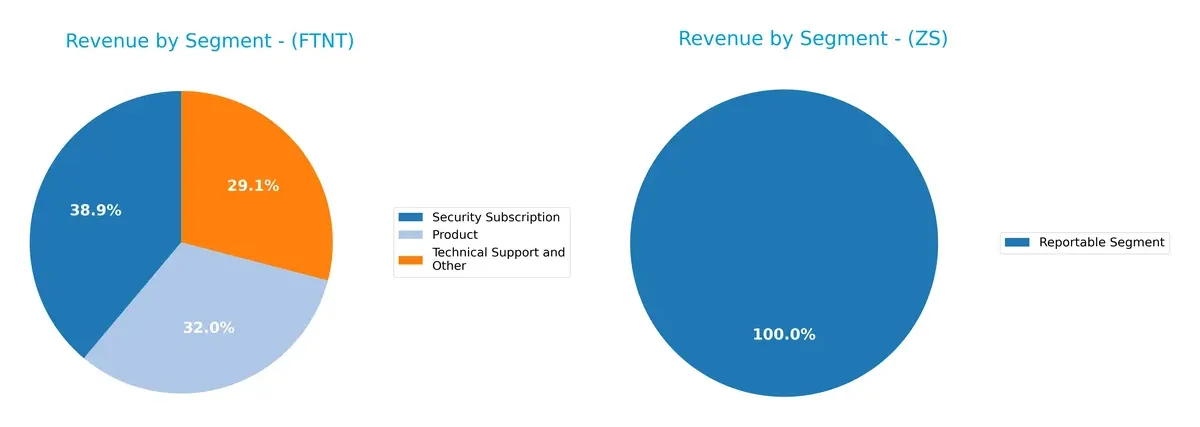
Fortinet shows a well-diversified mix with $2.3B in Security Subscription, $1.9B in Product, and $1.7B in Technical Support. Zscaler relies solely on one reported segment totaling $2.67B, indicating concentration risk. Fortinet’s spread anchors ecosystem lock-in and recurring revenue, while Zscaler pivots on a singular cloud security offering, exposing it to market shifts but benefiting from focused innovation.
Strengths and Weaknesses Comparison
This table compares the Strengths and Weaknesses of Fortinet, Inc. and Zscaler, Inc.:
Fortinet, Inc. Strengths
- Strong profitability with 27.26% net margin and 149.77% ROE
- Favorable ROIC at 28.76% well above WACC
- Diverse revenue streams across products, subscriptions, and support
- Broad global presence in Americas, EMEA, and Asia Pacific
- Solid liquidity with quick ratio above 1.0
- High fixed asset turnover at 4.2
Zscaler, Inc. Strengths
- Favorable price-to-earnings ratio due to negative earnings
- Strong liquidity with current and quick ratios at 2.01
- Moderate global presence including US, EMEA, and Asia Pacific
- Reasonable debt management with 27.98% debt-to-assets
- Efficient fixed asset turnover similar to Fortinet
- Lower valuation multiples compared to Fortinet
Fortinet, Inc. Weaknesses
- High valuation multiples with P/E of 32.48 and P/B of 48.64
- Dividend yield at zero, limiting income appeal
- Current ratio only neutral at 1.17, suggesting moderate short-term liquidity
- Debt-to-equity ratio at 0.81 is neutral but could build risk
- Asset turnover modest at 0.65
Zscaler, Inc. Weaknesses
- Negative profitability metrics with net margin, ROE, and ROIC all unfavorable
- Negative interest coverage indicating financial stress
- Unfavorable asset turnover at 0.42, indicating lower operational efficiency
- High debt-to-equity at 1.0, increasing leverage risk
- No dividend yield, limiting shareholder returns
Fortinet’s strengths lie in profitability and diversified revenue across global markets, but high valuation multiples present caution. Zscaler shows strong liquidity and efficient asset use but faces challenges with consistent losses and leverage. Both companies must balance growth and financial discipline in their strategies.
The Moat Duel: Analyzing Competitive Defensibility
A structural moat is the sole barrier defending long-term profits from relentless competition and market erosion. Here’s how Fortinet and Zscaler stack up:
Fortinet, Inc.: Integrated Security Ecosystem Moat
Fortinet’s moat is its integrated hardware-software platform, creating high switching costs and margin stability with an 80.8% gross margin. Its growing ROIC above WACC signals durable value creation as it expands into cloud and AI-driven cybersecurity in 2026.
Zscaler, Inc.: Cloud-Native Security Network Effects
Zscaler leverages cloud-native architecture and network effects, enabling rapid scaling. However, its negative ROIC versus WACC flags value destruction despite accelerating revenue growth. Its future hinges on converting growth into profitability amid intense cloud security competition.
Integrated Platform Strength vs. Cloud Network Expansion
Fortinet’s wider moat stems from superior capital efficiency and integrated product stickiness. Zscaler shows promise but remains vulnerable until it consistently generates excess returns. Fortinet is better positioned to defend market share in 2026’s evolving cybersecurity landscape.
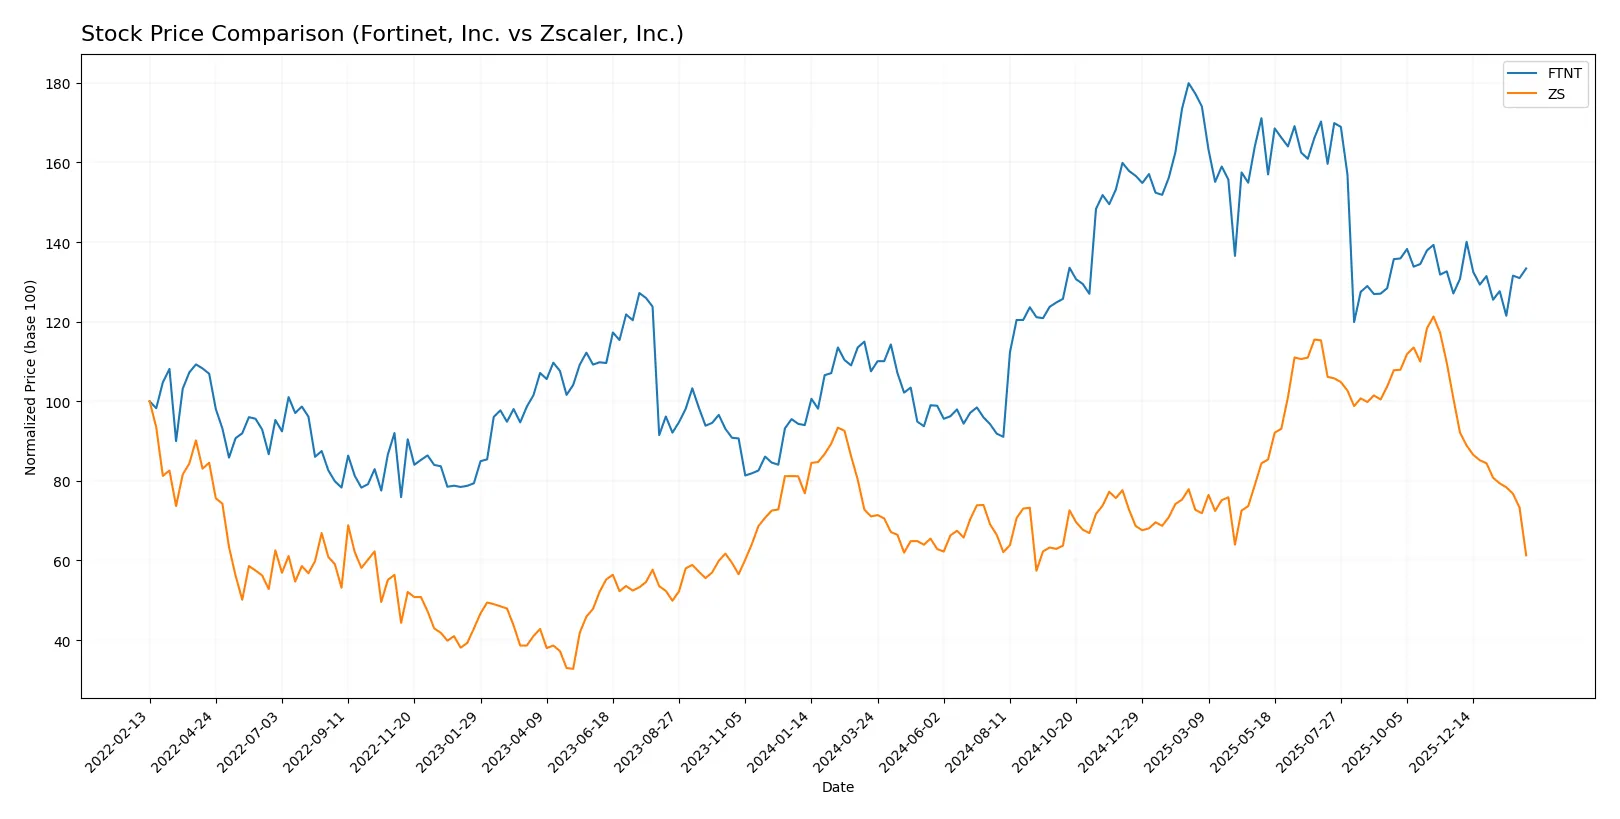
Which stock offers better returns?
The past year shows contrasting stock movements: Fortinet, Inc. gained 24.04%, decelerating after strong growth, while Zscaler, Inc. declined 13.76%, with accelerating selling pressure in recent months.
Trend Comparison
Fortinet, Inc.’s stock rose 24.04% over 12 months, signaling a bullish trend with decelerating gains. Its price ranged between 56.51 and 111.64, showing moderate volatility (15.07 std deviation).
Zscaler, Inc.’s stock dropped 13.76% over the same period, confirming a bearish trend with decelerating losses. Price fluctuated widely from 156.78 to 331.14, reflecting high volatility (47.43 std deviation).
Fortinet outperformed Zscaler with a positive 24.04% return versus Zscaler’s negative 13.76%, delivering the stronger market performance over the year.
Target Prices
Analysts show a strong bullish consensus for Fortinet, Inc. and Zscaler, Inc. based on current target price data.
| Company | Target Low | Target High | Consensus |
|---|---|---|---|
| Fortinet, Inc. | 70 | 90 | 85 |
| Zscaler, Inc. | 260 | 360 | 311.41 |
The consensus target for Fortinet at 85 exceeds its current price of 82.76, indicating modest upside potential. Zscaler’s target consensus of 311.41 is nearly double its present 167.33 price, signaling high growth expectations.

Don’t Let Luck Decide Your Entry Point
Optimize your entry points with our advanced ProRealTime indicators. You’ll get efficient buy signals with precise price targets for maximum performance. Start outperforming now!
How do institutions grade them?
The following tables summarize recent institutional grades for Fortinet, Inc. and Zscaler, Inc.:
Fortinet, Inc. Grades
This table shows the latest grades from recognized financial institutions for Fortinet, Inc.
| Grading Company | Action | New Grade | Date |
|---|---|---|---|
| Rosenblatt | Maintain | Buy | 2026-02-06 |
| Mizuho | Maintain | Underperform | 2026-02-06 |
| JP Morgan | Maintain | Underweight | 2026-02-06 |
| RBC Capital | Maintain | Sector Perform | 2026-02-06 |
| Wedbush | Maintain | Outperform | 2026-02-06 |
| Scotiabank | Downgrade | Sector Perform | 2026-02-02 |
| JP Morgan | Maintain | Underweight | 2026-01-30 |
| Rosenblatt | Upgrade | Buy | 2026-01-29 |
| TD Cowen | Upgrade | Buy | 2026-01-23 |
| Citigroup | Maintain | Neutral | 2026-01-13 |
Zscaler, Inc. Grades
This table shows the latest grades from recognized financial institutions for Zscaler, Inc.
| Grading Company | Action | New Grade | Date |
|---|---|---|---|
| Citigroup | Maintain | Buy | 2026-01-13 |
| Keybanc | Maintain | Overweight | 2026-01-12 |
| Piper Sandler | Maintain | Neutral | 2026-01-05 |
| RBC Capital | Maintain | Outperform | 2026-01-05 |
| Mizuho | Upgrade | Outperform | 2025-12-16 |
| Citigroup | Maintain | Buy | 2025-12-01 |
| Bernstein | Downgrade | Market Perform | 2025-12-01 |
| Baird | Maintain | Outperform | 2025-11-26 |
| Needham | Maintain | Buy | 2025-11-26 |
| BTIG | Maintain | Buy | 2025-11-26 |
Which company has the best grades?
Zscaler, Inc. generally receives more favorable and consistent grades, including multiple “Buy” and “Outperform” ratings. Fortinet, Inc. shows a mixed picture with notable “Underperform” and “Underweight” grades. This disparity could influence investor sentiment toward Zscaler.
Risks specific to each company
The following categories identify the critical pressure points and systemic threats facing both firms in the 2026 market environment:
1. Market & Competition
Fortinet, Inc.
- Operates in a crowded cybersecurity market with broad integrated solutions; strong brand and channel partnerships provide a moat.
Zscaler, Inc.
- Cloud-native security focus faces fierce competition and rapid innovation cycles; must scale fast to maintain relevance.
2. Capital Structure & Debt
Fortinet, Inc.
- Moderate leverage with debt-to-equity at 0.81; strong interest coverage (113x) signals robust debt servicing capacity.
Zscaler, Inc.
- Higher debt-to-equity ratio (1.0) combined with negative interest coverage raises red flags on financial stability.
3. Stock Volatility
Fortinet, Inc.
- Beta near 1.05 implies volatility in line with market; stable trading volume supports liquidity.
Zscaler, Inc.
- Beta slightly lower at 1.02 but wide price range (163-337) indicates episodic volatility and trading risk.
4. Regulatory & Legal
Fortinet, Inc.
- Compliance demands across global markets create ongoing operational risk but manageable given scale.
Zscaler, Inc.
- Cloud security regulations evolving rapidly; non-compliance risks could impact growth and margins.
5. Supply Chain & Operations
Fortinet, Inc.
- Hardware reliance exposes it to semiconductor and logistics disruptions; diversified geographic presence mitigates somewhat.
Zscaler, Inc.
- Pure cloud model reduces hardware dependency but depends heavily on third-party data center and network operators.
6. ESG & Climate Transition
Fortinet, Inc.
- Moderate ESG efforts; no dividend yield limits appeal to income-focused investors amid rising ESG scrutiny.
Zscaler, Inc.
- Faces pressure to improve sustainability metrics alongside rapid growth; lacks dividend, affecting defensive appeal.
7. Geopolitical Exposure
Fortinet, Inc.
- Global footprint includes sensitive regions (EMEA, APAC) exposing it to geopolitical tensions and trade restrictions.
Zscaler, Inc.
- Also global but with cloud focus, potentially more resilient to localized geopolitical disruptions but not immune.
Which company shows a better risk-adjusted profile?
Fortinet’s strongest risk lies in hardware supply chain vulnerabilities, while Zscaler’s critical risk centers on financial leverage and negative profitability. Fortinet’s robust interest coverage and safer capital structure yield a better risk-adjusted profile. Zscaler’s negative returns and interest coverage highlight financial distress despite favorable cloud positioning. Recent ratio data confirm Fortinet’s superior financial resilience amid market pressures.
Final Verdict: Which stock to choose?
Fortinet, Inc. wields unmatched efficiency and a robust economic moat, delivering strong and growing returns on invested capital. Its capacity to generate cash and sustain profitability stands out. A point of vigilance remains its elevated valuation multiples, which could pressure future gains. It suits investors aiming for aggressive growth with patience for premium pricing.
Zscaler, Inc. commands a strategic moat rooted in its cloud-native architecture and recurring revenue model. It offers a safer liquidity profile and a solid current ratio compared to Fortinet. However, profitability challenges and value destruction caution risk-averse investors. It fits well in a GARP (Growth at a Reasonable Price) portfolio, appealing to those betting on a turnaround.
If you prioritize consistent value creation and strong financial returns, Fortinet is the compelling choice due to its sustainable competitive advantage and operational excellence. However, if you seek growth potential with more stability in liquidity and a cloud-centric moat, Zscaler offers better safety but demands tolerance for profitability risks and valuation uncertainty.
Disclaimer: Investment carries a risk of loss of initial capital. The past performance is not a reliable indicator of future results. Be sure to understand risks before making an investment decision.
Go Further
I encourage you to read the complete analyses of Fortinet, Inc. and Zscaler, Inc. to enhance your investment decisions: