Home > Comparison > Technology > FTNT vs VERI
The strategic rivalry between Fortinet, Inc. and Veritone, Inc. defines the current trajectory of the technology sector. Fortinet operates as a capital-intensive cybersecurity powerhouse, delivering integrated hardware and software solutions globally. In contrast, Veritone focuses on AI-driven software infrastructure with a leaner, service-oriented model. This analysis pits Fortinet’s scale and stability against Veritone’s innovation and growth potential to identify the superior risk-adjusted opportunity for a diversified portfolio.
Table of contents
Companies Overview
Fortinet and Veritone both play critical roles in the evolving technology infrastructure landscape.
Fortinet, Inc.: Cybersecurity Infrastructure Leader
Fortinet dominates the cybersecurity sector with its broad, integrated security solutions. It generates revenue primarily through hardware and software licenses covering firewalls, endpoint protection, and network management. In 2026, Fortinet focuses on expanding its automated and scalable security platforms across global telecommunications and enterprise sectors.
Veritone, Inc.: AI-Powered Data Insights Provider
Veritone specializes in AI computing solutions via its aiWARE platform, which processes structured and unstructured data using machine learning for various industries. Revenue comes from AI services and media advertising solutions. In 2026, the company emphasizes enhancing AI-driven analytics for media, government, and legal markets.
Strategic Collision: Similarities & Divergences
Fortinet and Veritone both serve technology infrastructure but differ sharply in approach—Fortinet delivers a security-centric hardware and software ecosystem, while Veritone offers an AI-centric platform for data interpretation. Their competition lies in enterprise adoption of automated tech solutions. Fortinet’s stable market cap contrasts with Veritone’s higher volatility, reflecting distinct risk-return profiles for investors.
Income Statement Comparison
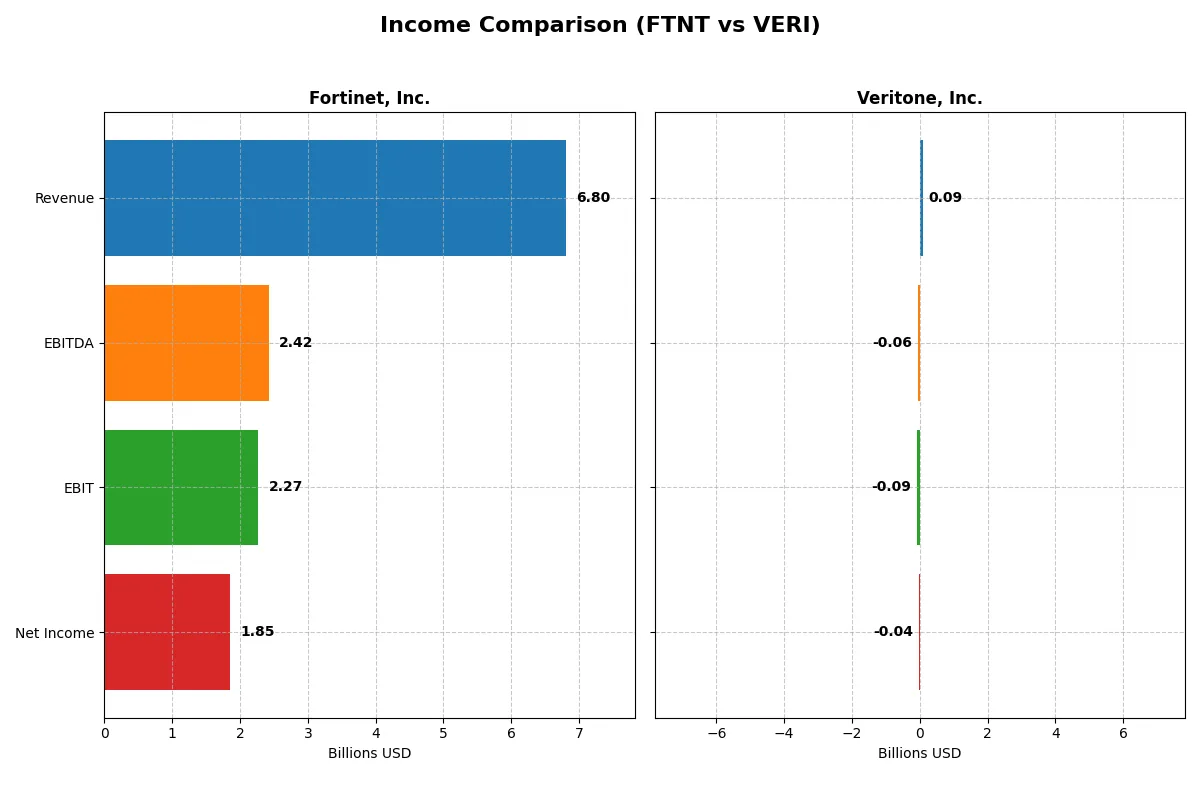
This data dissects the core profitability and scalability of both corporate engines to reveal who dominates the bottom line:
| Metric | Fortinet, Inc. (FTNT) | Veritone, Inc. (VERI) |
|---|---|---|
| Revenue | 6.80B | 93M |
| Cost of Revenue | 1.30B | 27M |
| Operating Expenses | 3.42B | 154M |
| Gross Profit | 5.50B | 65M |
| EBITDA | 2.42B | -59M |
| EBIT | 2.27B | -88M |
| Interest Expense | 20M | 12M |
| Net Income | 1.85B | -37M |
| EPS | 2.44 | -0.98 |
| Fiscal Year | 2025 | 2024 |
Income Statement Analysis: The Bottom-Line Duel
This income statement comparison exposes which company runs its core business most efficiently, revealing distinct operational strengths and weaknesses.
Fortinet, Inc. Analysis
Fortinet’s revenue surged from 3.34B in 2021 to 6.80B in 2025, with net income nearly tripling to 1.85B. Its gross margin stands at a robust 80.8%, and the net margin holds strong at 27.3%. In 2025, Fortinet maintained solid momentum, growing revenue by 14.2% and EBITDA by 10%, reflecting efficient cost control and scalable operations.
Veritone, Inc. Analysis
Veritone’s revenue rose overall but peaked at 150M in 2022 before declining to 93M in 2024. Despite a favorable gross margin of 70.6%, the company suffers from deep operating losses, posting a -40.4% net margin in 2024. The latest year showed a 7.4% revenue decline and widening EBIT losses, signaling ongoing challenges in reaching profitability despite operational adjustments.
Verdict: High Margin Growth vs. Profitability Struggles
Fortinet clearly outperforms Veritone in scale, margin quality, and profitability growth. Fortinet’s consistent revenue and net income expansion highlight a durable moat and disciplined capital allocation. Veritone’s volatile revenue and persistent losses mark it as an operational turnaround candidate. For investors prioritizing steady earnings and margin strength, Fortinet’s profile offers far greater appeal.
Financial Ratios Comparison
These vital ratios act as a diagnostic tool to expose the underlying fiscal health, valuation premiums, and capital efficiency of Fortinet, Inc. and Veritone, Inc.:
| Ratios | Fortinet, Inc. (FTNT) | Veritone, Inc. (VERI) |
|---|---|---|
| ROE | 1.50 | -2.78 |
| ROIC | 0.29 | -0.58 |
| P/E | 32.48 | -3.34 |
| P/B | 48.64 | 9.27 |
| Current Ratio | 1.17 | 0.97 |
| Quick Ratio | 1.09 | 0.97 |
| D/E | 0.81 | 8.91 |
| Debt-to-Assets | 9.6% | 60.5% |
| Interest Coverage | 103.72 | -7.31 |
| Asset Turnover | 0.65 | 0.47 |
| Fixed Asset Turnover | 4.20 | 8.51 |
| Payout ratio | 0 | 0 |
| Dividend yield | 0 | 0 |
| Fiscal Year | 2025 | 2024 |
Efficiency & Valuation Duel: The Vital Signs
Financial ratios act as a company’s DNA, exposing hidden risks and highlighting operational strengths critical to investor insight.
Fortinet, Inc.
Fortinet delivers exceptional profitability with a 150% ROE and a robust 27.3% net margin, signaling operational excellence. The stock trades at a stretched P/E of 32.5 and a lofty P/B of 48.6, indicating premium valuation. Despite no dividend, Fortinet reinvests heavily in R&D to fuel sustainable growth and shareholder value.
Veritone, Inc.
Veritone struggles with deeply negative profitability metrics, including a -278% ROE and a -40.4% net margin, reflecting operational challenges. The P/E is negative but low, while P/B stands at 9.3, suggesting undervaluation mixed with significant risk. Veritone pays no dividend, focusing on R&D to attempt a turnaround amid high financial leverage and weak liquidity.
Premium Valuation vs. Operational Fragility
Fortinet showcases superior profitability and reinvestment discipline, albeit at a premium valuation. Veritone’s metrics reveal operational distress and financial risks, despite cheaper multiples. Fortinet suits investors prioritizing stable growth and efficiency. Veritone aligns with high-risk profiles seeking deep value and potential recovery.
Which one offers the Superior Shareholder Reward?
Fortinet, Inc. (FTNT) delivers superior shareholder rewards compared to Veritone, Inc. (VERI). FTNT pays no dividends but aggressively deploys free cash flow (2.9B per share FCF in 2025) into share buybacks, fueling capital returns sustainably. VERI neither pays dividends nor generates positive free cash flow, relying on debt-laden reinvestments with negative margins. FTNT’s buyback program, strong margins (30.6% EBIT), and prudent leverage (debt/assets 9.6%) contrast sharply with VERI’s negative profitability and high leverage (debt/assets 60.5%). I conclude FTNT offers a more attractive and sustainable total return profile in 2026.
Comparative Score Analysis: The Strategic Profile
The radar chart reveals the fundamental DNA and trade-offs of Fortinet, Inc. and Veritone, Inc., highlighting their financial strengths and vulnerabilities:
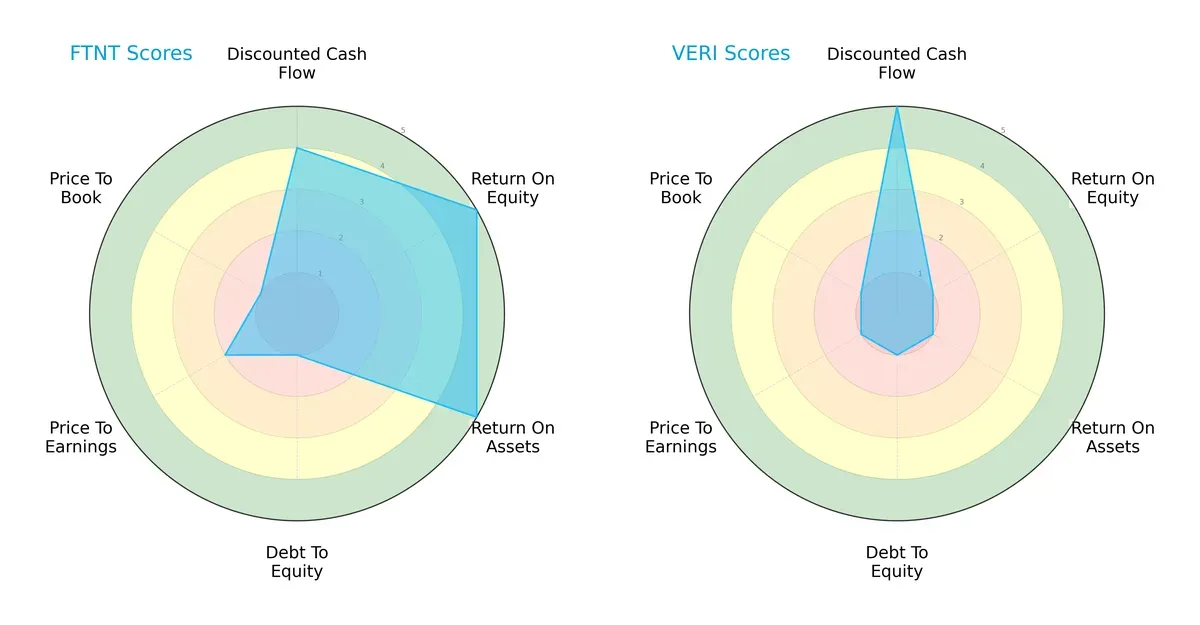
Fortinet boasts a balanced profile with very favorable ROE and ROA scores (5 each), signaling efficient profit generation and asset utilization. Its discounted cash flow score is favorable (4), but debt-to-equity and valuation metrics (P/E and P/B) are weak, indicating leverage risk and possible overvaluation. Veritone leans heavily on a strong DCF score (5) but suffers from very unfavorable profitability (ROE and ROA at 1) and valuation metrics, reflecting operational inefficiencies and potential overpricing. Fortinet’s diversified strengths make it the sturdier choice.
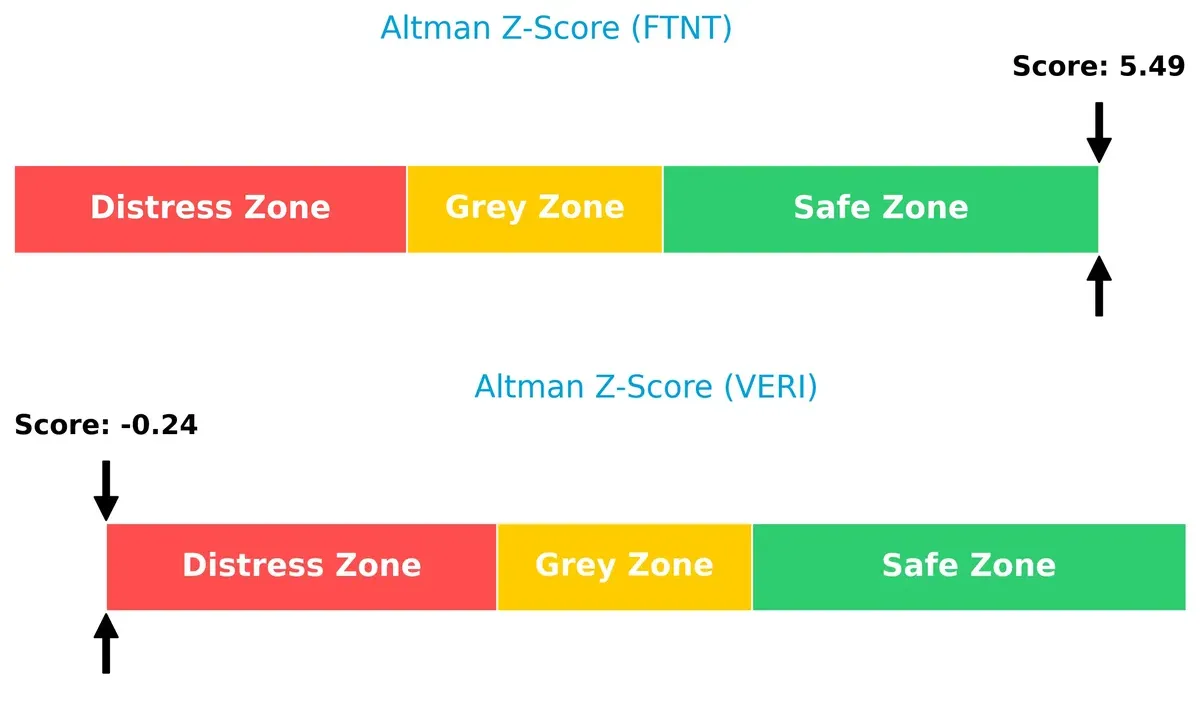
Bankruptcy Risk: Solvency Showdown
Fortinet’s Altman Z-Score of 5.49 secures it firmly in the safe zone, indicating low bankruptcy risk. Veritone’s score of -0.24 places it in the distress zone, implying serious financial instability and elevated default risk in this cycle:
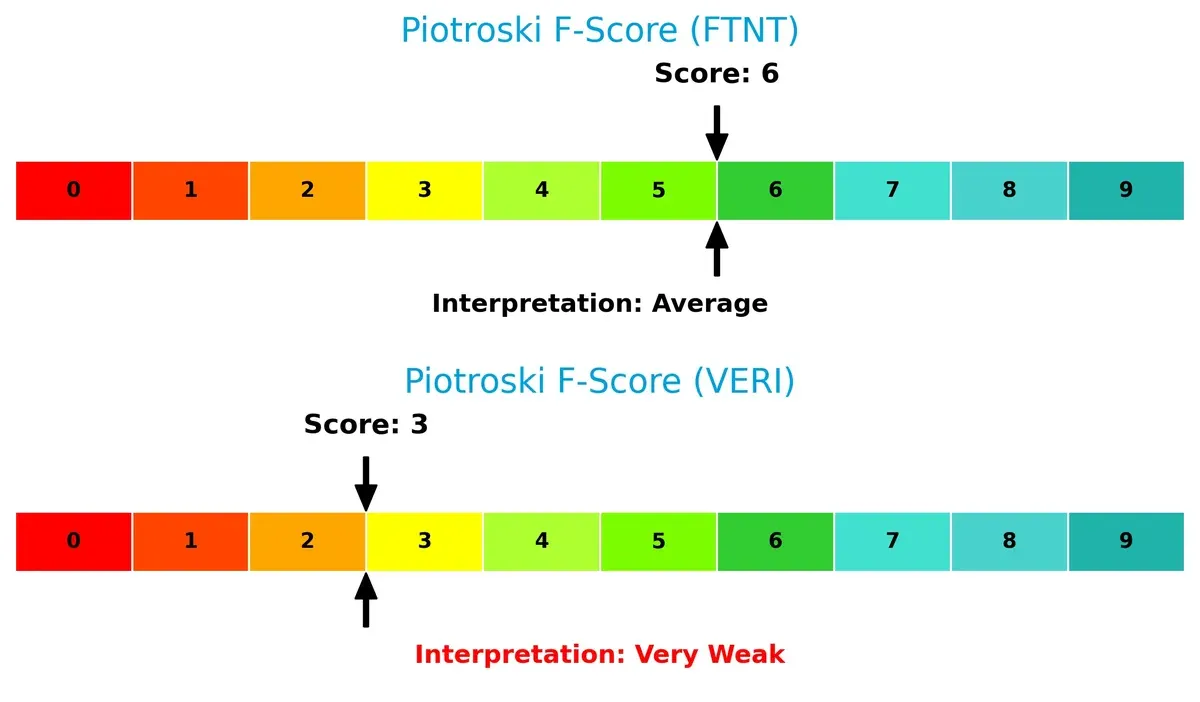
Financial Health: Quality of Operations
Fortinet’s Piotroski F-Score of 6 signals average financial health with room for improvement but no immediate red flags. Veritone’s score of 3 flags weak internal metrics and operational fragility, raising caution for risk-averse investors:
How are the two companies positioned?
This section dissects the operational DNA of Fortinet and Veritone by comparing their revenue distribution and internal dynamics. The goal is to confront their economic moats and identify which model delivers the most resilient, sustainable competitive advantage today.
Revenue Segmentation: The Strategic Mix
This visual comparison dissects how Fortinet, Inc. and Veritone, Inc. diversify their income streams and where their primary sector bets lie:
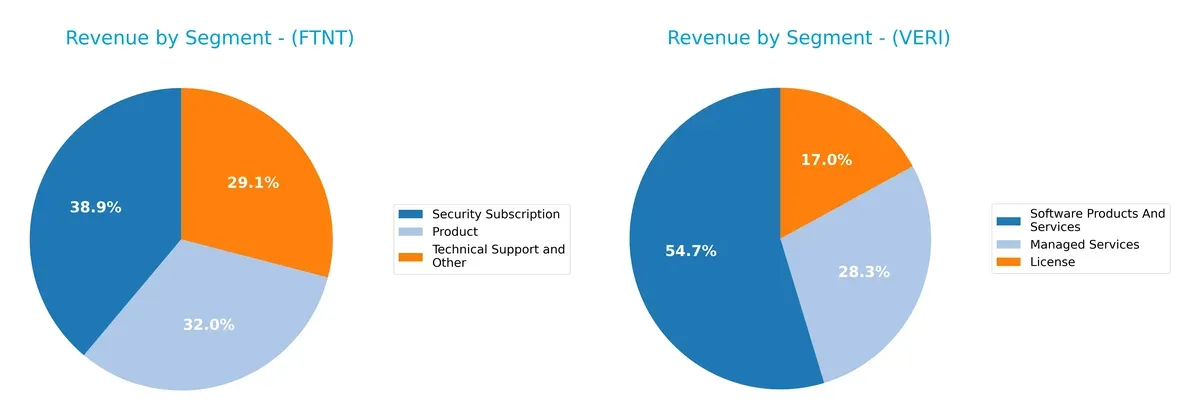
Fortinet anchors revenue across three robust segments: Security Subscription at $2.3B dwarfs Product ($1.9B) and Technical Support ($1.7B). This mix signals a strong ecosystem lock-in with recurring subscription income. Conversely, Veritone relies more evenly on Software Products and Services ($61M) and Managed Services ($32M), but at a fraction of Fortinet’s scale. Veritone’s narrower base risks volatility, while Fortinet’s broad mix underpins infrastructure dominance and resilient cash flow.
Strengths and Weaknesses Comparison
This table compares the strengths and weaknesses of Fortinet, Inc. and Veritone, Inc.:
Fortinet Strengths
- Strong profitability with net margin 27.26% ROE 149.77% ROIC 28.76%
- Favorable debt management and interest coverage
- Diversified revenue streams across products and services
- Global presence across Americas, EMEA, Asia Pacific
- Market share supported by high asset turnover and fixed asset efficiency
Veritone Strengths
- Favorable PE ratio relative to negative earnings
- Efficient fixed asset turnover at 8.51
- Revenue diversification in licenses, managed services, software products
- Presence in AI and media sectors, reflecting innovation efforts
Fortinet Weaknesses
- High valuation multiples PE 32.48 PB 48.64 may pressure future returns
- Zero dividend yield limits income appeal
- Neutral liquidity ratios may constrain short-term flexibility
Veritone Weaknesses
- Negative profitability with net margin -40.36% ROE -277.91% ROIC -58.27%
- Weak liquidity and high leverage with debt-to-assets 60.54%
- Negative interest coverage signals financial distress
- Unfavorable WACC at 11.27%
- No reported global revenue diversification
Fortinet’s strengths lie in robust profitability, global diversification, and sound financial structure, though high valuation multiples pose caution. Veritone faces significant financial challenges with negative earnings and weak liquidity but shows niche innovation and asset efficiency. Each company’s strategic focus reflects these contrasting financial profiles.
The Moat Duel: Analyzing Competitive Defensibility
A structural moat is the only reliable shield protecting long-term profits from relentless competition and market erosion:
Fortinet, Inc.: Integrated Security Ecosystem
Fortinet’s moat stems from its broad, integrated cybersecurity platform, locking customers with high switching costs. Its 20% ROIC spread over WACC confirms value creation. In 2026, expansion into AI-driven security could deepen this moat.
Veritone, Inc.: AI Innovation Edge
Veritone relies on proprietary AI algorithms but lacks Fortinet’s scale and integration. Its negative ROIC signals value destruction and weak capital efficiency. Growth hinges on new AI markets, yet profitability remains uncertain.
Integrated Ecosystem vs. AI Innovation: The Moat Face-Off
Fortinet’s wide, growing moat outmatches Veritone’s struggling capital returns and narrow competitive edge. Fortinet’s platform integration better defends market share amid intensifying cybersecurity demand.
Which stock offers better returns?
Over the past year, Fortinet’s shares gained 24%, showing a strong but decelerating upward momentum, while Veritone’s stock declined by nearly 14%, reflecting sustained downward pressure.
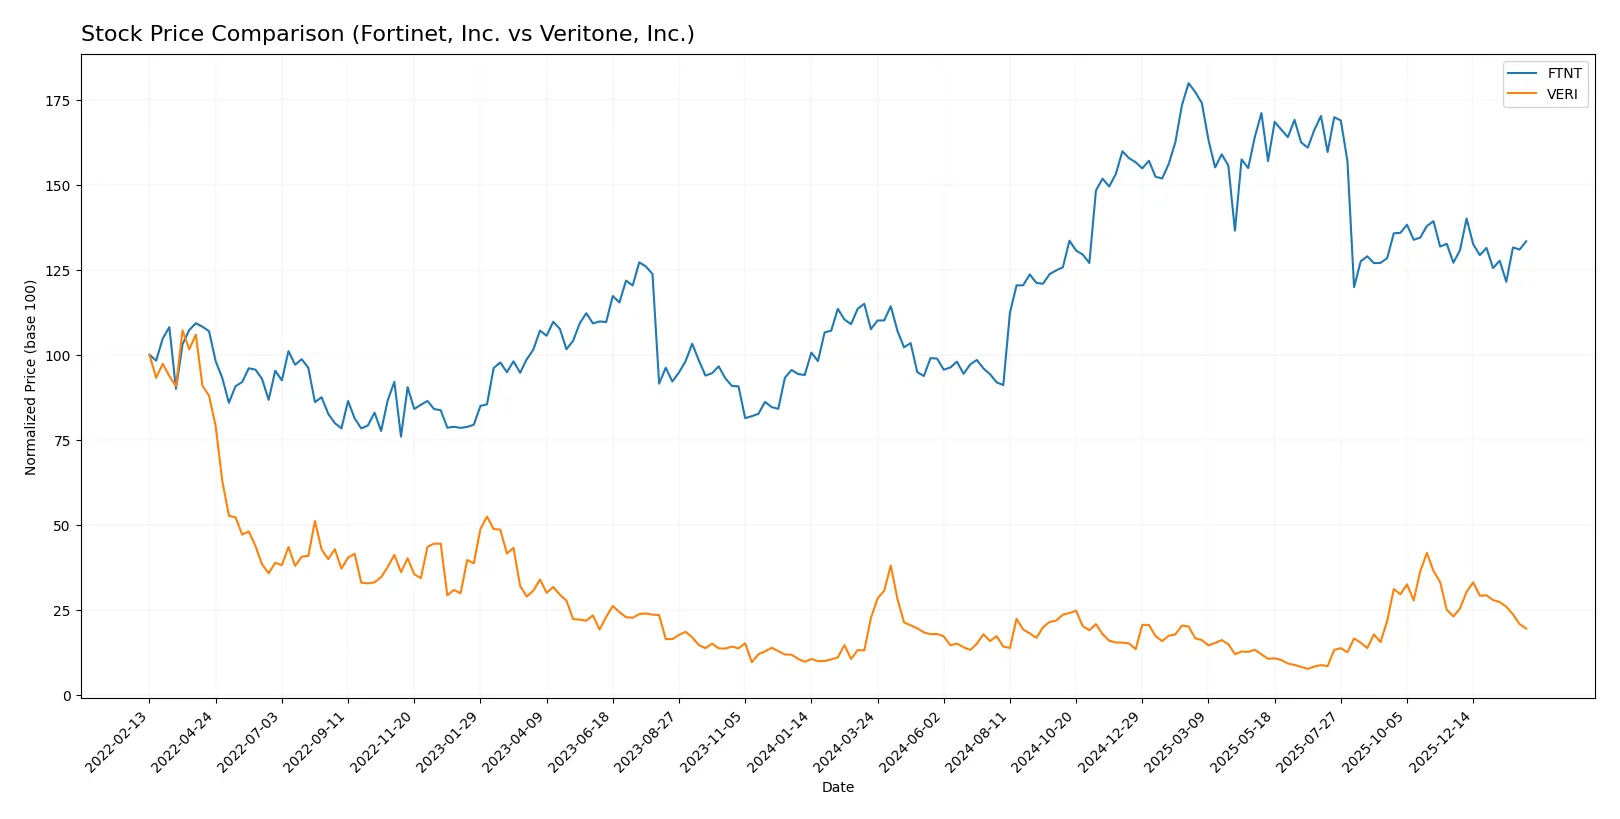
Trend Comparison
Fortinet, Inc. (FTNT) experienced a bullish trend with a 24.04% price increase over 12 months. The trend shows deceleration, and volatility remains elevated with a 15.07 std deviation.
Veritone, Inc. (VERI) faced a bearish trend with a 13.66% drop over the same period. Its price decline is decelerating, and volatility is low at a 1.25 std deviation.
Fortinet outperformed Veritone, delivering the highest market returns amid decelerating momentum, while Veritone’s stock weakened consistently over the year.
Target Prices
Analysts present a clear target consensus for Fortinet, Inc. and Veritone, Inc., reflecting measured optimism.
| Company | Target Low | Target High | Consensus |
|---|---|---|---|
| Fortinet, Inc. | 70 | 90 | 85 |
| Veritone, Inc. | 9 | 10 | 9.5 |
The consensus target for Fortinet stands modestly above the current price of $82.76, suggesting moderate upside potential. Veritone’s target prices far exceed its $3.35 market price, indicating high growth expectations but also elevated risk.

Don’t Let Luck Decide Your Entry Point
Optimize your entry points with our advanced ProRealTime indicators. You’ll get efficient buy signals with precise price targets for maximum performance. Start outperforming now!
How do institutions grade them?
The latest institutional grades for Fortinet, Inc. and Veritone, Inc. reveal diverse analyst opinions:
Fortinet, Inc. Grades
This table summarizes recent grade actions by recognized institutions for Fortinet, Inc.:
| Grading Company | Action | New Grade | Date |
|---|---|---|---|
| Rosenblatt | maintain | Buy | 2026-02-06 |
| Mizuho | maintain | Underperform | 2026-02-06 |
| JP Morgan | maintain | Underweight | 2026-02-06 |
| RBC Capital | maintain | Sector Perform | 2026-02-06 |
| Wedbush | maintain | Outperform | 2026-02-06 |
| Scotiabank | downgrade | Sector Perform | 2026-02-02 |
| JP Morgan | maintain | Underweight | 2026-01-30 |
| Rosenblatt | upgrade | Buy | 2026-01-29 |
| TD Cowen | upgrade | Buy | 2026-01-23 |
| Citigroup | maintain | Neutral | 2026-01-13 |
Veritone, Inc. Grades
Below are recent grade updates from established firms for Veritone, Inc.:
| Grading Company | Action | New Grade | Date |
|---|---|---|---|
| D. Boral Capital | maintain | Buy | 2026-01-30 |
| D. Boral Capital | maintain | Buy | 2025-12-09 |
| D. Boral Capital | maintain | Buy | 2025-12-04 |
| D. Boral Capital | maintain | Buy | 2025-12-02 |
| Needham | maintain | Buy | 2025-12-02 |
| D. Boral Capital | maintain | Buy | 2025-11-07 |
| D. Boral Capital | maintain | Buy | 2025-10-28 |
| HC Wainwright & Co. | maintain | Buy | 2025-10-20 |
| D. Boral Capital | maintain | Buy | 2025-10-15 |
| D. Boral Capital | maintain | Buy | 2025-09-24 |
Which company has the best grades?
Veritone, Inc. consistently receives Buy ratings from multiple firms, reflecting strong analyst confidence. Fortinet, Inc. shows mixed grades, ranging from Buy to Underperform. This divergence suggests Veritone’s outlook is more uniformly positive, potentially affecting investor sentiment and risk assessment.
Risks specific to each company
The following categories identify critical pressure points and systemic threats facing Fortinet, Inc. and Veritone, Inc. in the 2026 market environment:
1. Market & Competition
Fortinet, Inc.
- Well-established with broad cybersecurity solutions and strong client base; faces intense competition in software infrastructure.
Veritone, Inc.
- Smaller AI-focused player with niche platform; struggles to scale amid competitive pressure from larger tech firms.
2. Capital Structure & Debt
Fortinet, Inc.
- Maintains moderate debt with favorable interest coverage (113x); financial leverage manageable at 0.81 D/E ratio.
Veritone, Inc.
- Highly leveraged with 8.91 D/E ratio; poor interest coverage (-7.3) signals financial distress risk.
3. Stock Volatility
Fortinet, Inc.
- Beta near 1.05 indicates market-correlated, moderate volatility.
Veritone, Inc.
- Elevated beta at 2.14 shows high volatility and greater risk exposure.
4. Regulatory & Legal
Fortinet, Inc.
- Operates globally in regulated cybersecurity markets; compliance costs moderate but ongoing.
Veritone, Inc.
- AI sector faces evolving regulations, particularly on data use and privacy; regulatory uncertainty remains high.
5. Supply Chain & Operations
Fortinet, Inc.
- Diverse supply chain with hardware/software integration; operational scale reduces single-point risks.
Veritone, Inc.
- Lean operations and dependency on cloud infrastructure create potential bottlenecks and scalability challenges.
6. ESG & Climate Transition
Fortinet, Inc.
- ESG policies improving; moderate risk due to energy consumption of data centers.
Veritone, Inc.
- Early-stage ESG integration; may face pressure as AI workloads drive energy use.
7. Geopolitical Exposure
Fortinet, Inc.
- Global presence exposes it to geopolitical tensions, especially US-China tech competition.
Veritone, Inc.
- Primarily US- and UK-focused; less geopolitical risk but sensitive to international AI policy shifts.
Which company shows a better risk-adjusted profile?
Fortinet’s biggest risk lies in intense market competition and valuation pressures despite strong financial health. Veritone’s greatest threat is its weak capital structure and poor profitability, raising bankruptcy concerns. Fortinet demonstrates a markedly better risk-adjusted profile, supported by a safe Altman Z-Score (5.49) versus Veritone’s distress zone (-0.24). Veritone’s high debt and negative margins justify caution, while Fortinet’s stable operations and financial strength provide resilience.
Final Verdict: Which stock to choose?
Fortinet’s superpower lies in its robust and growing economic moat, driven by efficient capital allocation and a high return on invested capital well above its cost of capital. Its main point of vigilance is the stretched valuation multiples, which could temper upside in volatile markets. This stock suits portfolios seeking aggressive growth with a focus on high-quality profitability.
Veritone’s strategic moat is currently weak, reflected in its negative returns and financial distress signals. However, its discounted cash flow score suggests potential undervaluation, appealing to investors with a high risk tolerance who seek turnaround opportunities. Compared to Fortinet, it offers less stability and fits speculative or contrarian growth portfolios.
If you prioritize sustainable profitability and proven capital efficiency, Fortinet outshines as the compelling choice due to its strong competitive advantage and financial health. However, if you seek high-risk, high-reward scenarios with a focus on potential deep-value recovery, Veritone offers a speculative play with a chance for outsized gains but significant risk.
Disclaimer: Investment carries a risk of loss of initial capital. The past performance is not a reliable indicator of future results. Be sure to understand risks before making an investment decision.
Go Further
I encourage you to read the complete analyses of Fortinet, Inc. and Veritone, Inc. to enhance your investment decisions: