Home > Comparison > Technology > FTNT vs VRSN
The strategic rivalry between Fortinet, Inc. and VeriSign, Inc. shapes the evolving landscape of technology infrastructure. Fortinet operates as a capital-intensive cybersecurity powerhouse delivering integrated hardware and software solutions. In contrast, VeriSign excels as a high-margin internet infrastructure provider, managing critical domain name services. This analysis pits growth-driven security innovation against resilient infrastructure dominance to identify which trajectory offers superior risk-adjusted returns for diversified portfolios.
Table of contents
Companies Overview
Fortinet and VeriSign stand as pivotal players in the software infrastructure landscape, shaping critical facets of digital security and internet operations.
Fortinet, Inc.: Cybersecurity Powerhouse
Fortinet dominates cybersecurity with its broad portfolio of integrated hardware and software. Its core revenue stems from FortiGate firewalls, endpoint protection, and subscription services. In 2026, Fortinet focuses on expanding automated cybersecurity solutions to meet evolving threats across diverse industries worldwide.
VeriSign, Inc.: Internet Infrastructure Guardian
VeriSign secures internet navigation by managing major domain registries like .com and .net. Its revenue relies on providing authoritative domain name services and maintaining root servers. In 2026, VeriSign prioritizes enhancing the stability and resiliency of global internet infrastructure amid rising cyber risks.
Strategic Collision: Similarities & Divergences
Both companies specialize in software infrastructure with a security emphasis but diverge sharply. Fortinet delivers a comprehensive cybersecurity ecosystem targeting enterprises directly. VeriSign offers foundational internet services underpinning global domain stability. They compete indirectly in digital trust, with Fortinet’s growth driven by innovation and VeriSign’s strength rooted in monopoly-like domain control. Their investment profiles reflect this contrast between aggressive expansion and steady cash flow.
Income Statement Comparison
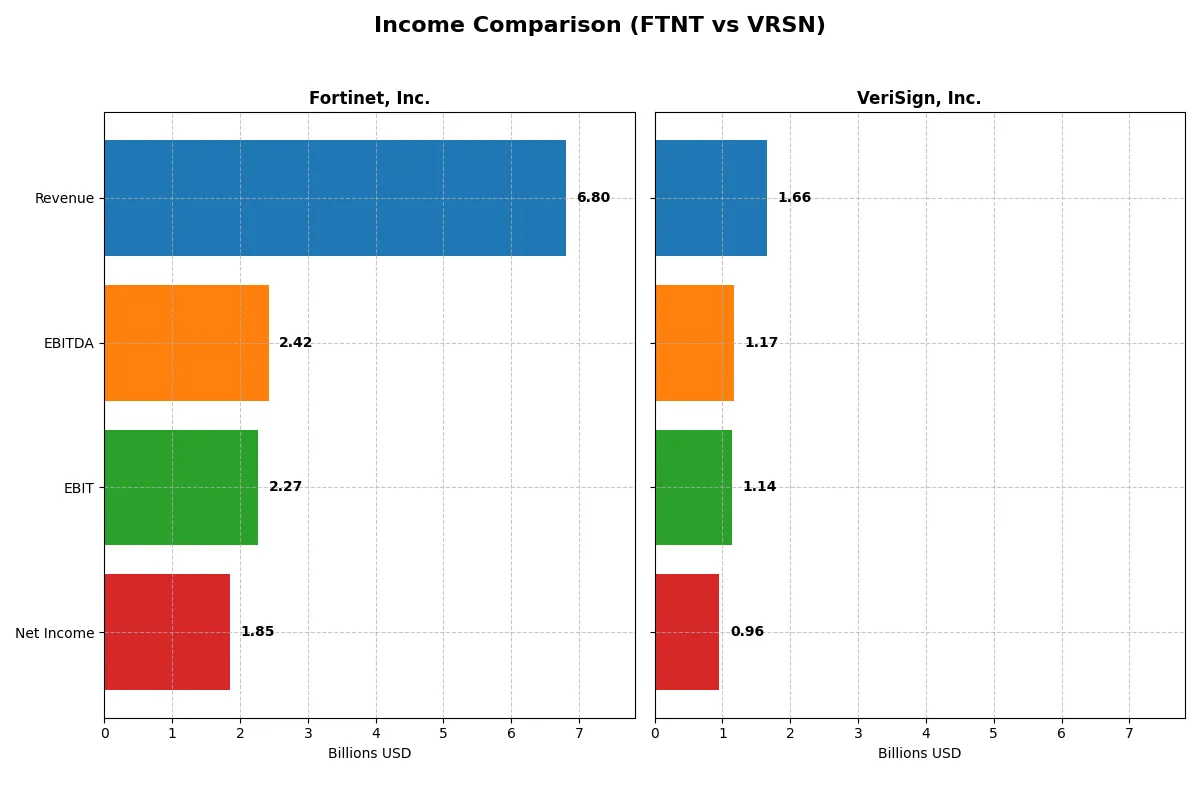
This data dissects the core profitability and scalability of both corporate engines to reveal who dominates the bottom line:
| Metric | Fortinet, Inc. (FTNT) | VeriSign, Inc. (VRSN) |
|---|---|---|
| Revenue | 6.8B | 1.7B |
| Cost of Revenue | 1.3B | 196M |
| Operating Expenses | 3.4B | 339M |
| Gross Profit | 5.5B | 1.5B |
| EBITDA | 2.4B | 1.2B |
| EBIT | 2.3B | 1.1B |
| Interest Expense | 20M | 77M |
| Net Income | 1.9B | 956M |
| EPS | 2.44 | 8.83 |
| Fiscal Year | 2025 | 2025 |
Income Statement Analysis: The Bottom-Line Duel
This income statement comparison reveals how efficiently Fortinet and VeriSign convert revenue into profit under varying cost structures and market pressures.
Fortinet, Inc. Analysis
Fortinet’s revenue more than doubled from 2021 to 2025, reaching $6.8B in 2025. Net income surged 205% over the period to $1.85B, demonstrating strong profitability. The company sustains a robust gross margin of 80.8% and a net margin near 27.3%, signaling efficient cost control. In 2025, Fortinet’s momentum remains positive with 14% revenue growth, though net margin slightly contracted, reflecting investment in growth.
VeriSign, Inc. Analysis
VeriSign posted steady revenue growth of 25% from 2021 to 2025, reaching $1.66B. Net income grew 22% to $956M, supported by an exceptional net margin of 57.7%. VeriSign maintains an impressive gross margin above 88% and EBIT margin near 69%, underscoring operational excellence. However, recent growth rates slowed, with only 6.4% revenue increase in 2025 and mixed signals on operating expense efficiency.
Margin Dominance vs. Growth Scale
Fortinet’s income statement highlights rapid growth and expanding profit base, while VeriSign excels in margin dominance and profitability ratios. Fortinet wins on scale and growth momentum, doubling revenues and tripling net income in five years. VeriSign’s superior margins make it a model of operational leverage but with more modest expansion. Investors prioritizing growth may prefer Fortinet; those valuing margin strength might lean toward VeriSign.
Financial Ratios Comparison
These vital ratios act as a diagnostic tool to expose the underlying fiscal health, valuation premiums, and capital efficiency of the companies compared below:
| Ratios | Fortinet, Inc. (FTNT) | VeriSign, Inc. (VRSN) |
|---|---|---|
| ROE | 1.50 | -0.65 |
| ROIC | 0.29 | -1.52 |
| P/E | 32.48 | 23.49 |
| P/B | 48.64 | -15.23 |
| Current Ratio | 1.17 | 0.49 |
| Quick Ratio | 1.09 | 0.49 |
| D/E | 0.81 | -1.21 |
| Debt-to-Assets | 0.10 | 2.66 |
| Interest Coverage | 103.72 | 14.56 |
| Asset Turnover | 0.65 | 2.46 |
| Fixed Asset Turnover | 4.20 | 7.75 |
| Payout ratio | 0 | 0.23 |
| Dividend yield | 0 | 0.96% |
| Fiscal Year | 2025 | 2025 |
Efficiency & Valuation Duel: The Vital Signs
Ratios act as a company’s DNA, exposing hidden risks and operational strengths that shape its investment profile.
Fortinet, Inc.
Fortinet posts a stellar ROE of 149.77% and a strong net margin of 27.26%, signaling operational excellence. Its P/E of 32.48 is stretched relative to sector averages, reflecting high growth expectations. The company returns no dividends but reinvests heavily in R&D, fueling long-term innovation and expansion.
VeriSign, Inc.
VeriSign shows a robust net margin of 57.68% but a negative ROE of -64.84%, reflecting profitability challenges despite strong cash flow. Its P/E of 23.49 appears reasonable. The firm pays a modest 0.96% dividend but faces liquidity risks with a low current ratio of 0.49, signaling potential short-term pressure.
Premium Valuation vs. Operational Safety
Fortinet delivers superior profitability and reinvestment discipline but trades at a premium valuation. VeriSign offers a leaner valuation but struggles with returns and liquidity. Risk-tolerant investors may favor Fortinet’s growth, while conservative profiles might seek VeriSign’s established cash flow despite its risks.
Which one offers the Superior Shareholder Reward?
Fortinet and VeriSign both forgo traditional dividends but differ sharply in capital return strategies. Fortinet pays no dividend, focusing on robust reinvestment, supported by a 0 payout ratio and zero yield. VeriSign offers a modest 0.96% dividend yield with a 22.5% payout ratio, signaling steady cash returns. Buybacks are a critical driver for both; Fortinet’s free cash flow per share reached 2.94 in 2025, enabling share repurchases that complement growth investments. VeriSign’s free cash flow per share stands at 11.56, supporting both dividends and buybacks sustainably. I see VeriSign’s balanced model as more sustainable and attractive for total return in 2026, blending income and growth, unlike Fortinet’s all-in reinvestment approach.
Comparative Score Analysis: The Strategic Profile
The radar chart reveals the fundamental DNA and trade-offs of Fortinet, Inc. and VeriSign, Inc., illustrating strengths across valuation, profitability, and leverage:
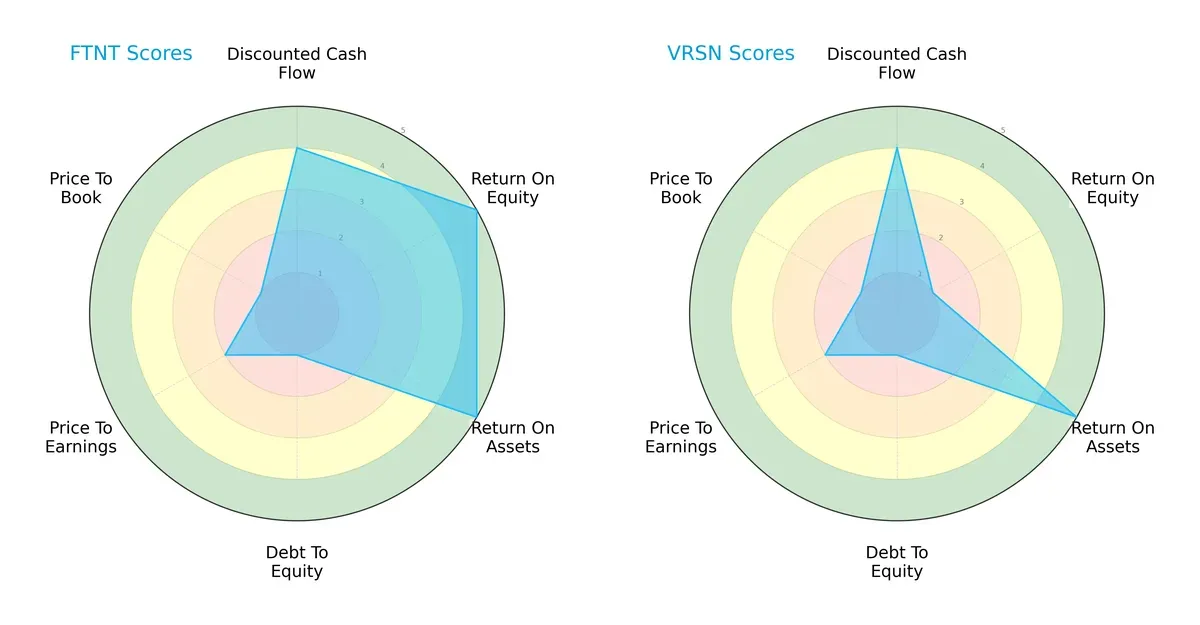
Fortinet shows a balanced profile with very favorable ROE and ROA scores (5 each), indicating efficient profit generation and asset utilization. Its discounted cash flow score is favorable (4), but it suffers from weak debt management and valuation metrics (both scored 1). VeriSign matches Fortinet’s DCF and ROA strengths but lags significantly in ROE (1), signaling less equity efficiency. Both struggle with debt-to-equity and valuation, but Fortinet’s superior profitability metrics give it a strategic edge.
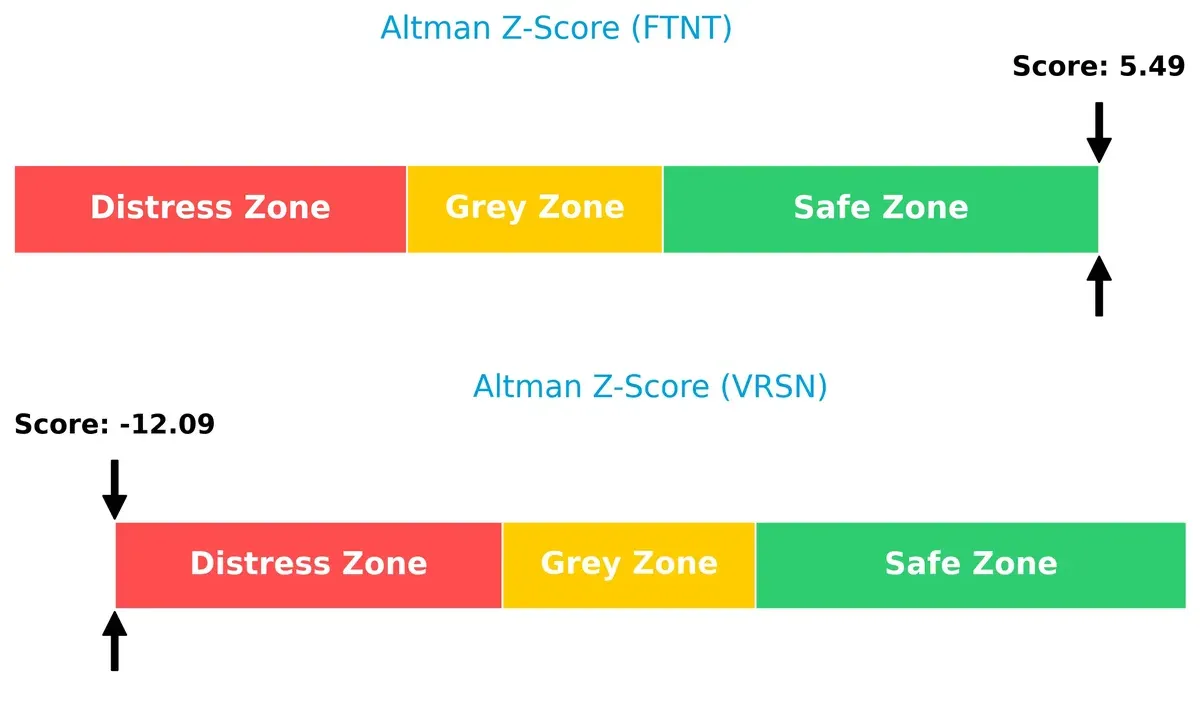
Bankruptcy Risk: Solvency Showdown
Fortinet’s Altman Z-Score of 5.49 places it securely in the safe zone, signaling robust solvency and low bankruptcy risk. VeriSign’s -12.09 score lands in distress territory, warning of severe financial instability and high bankruptcy risk under current conditions:
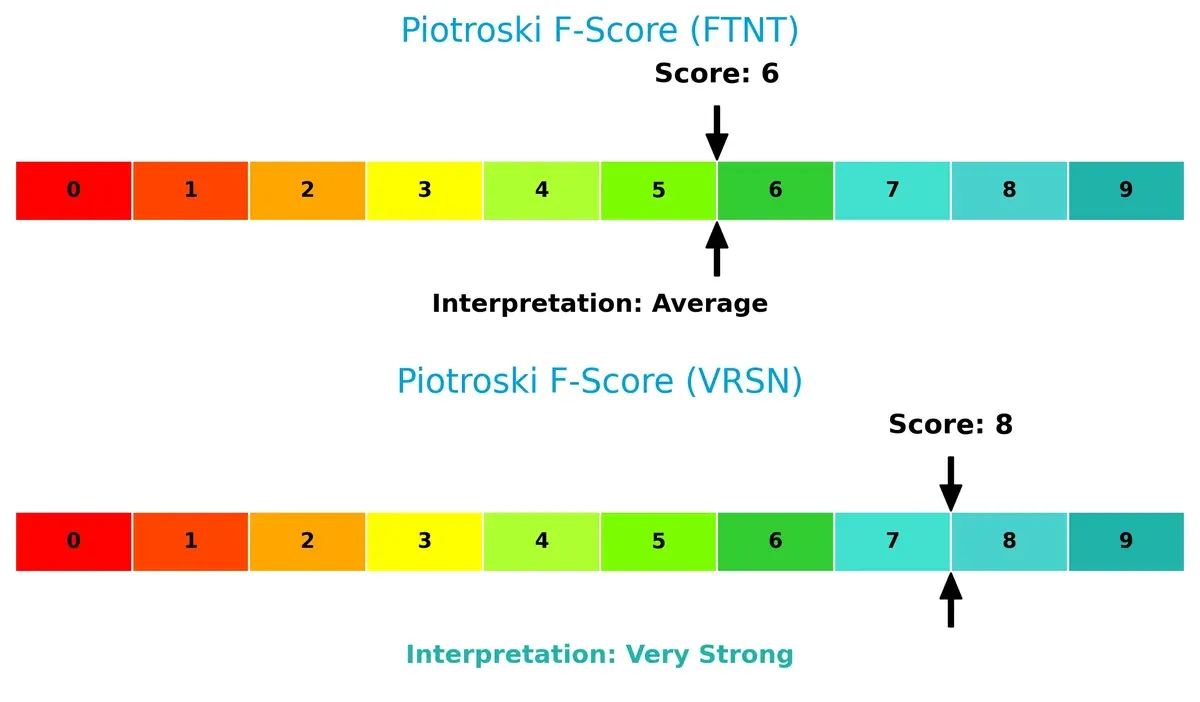
Financial Health: Quality of Operations
VeriSign’s Piotroski F-Score of 8 outperforms Fortinet’s 6, indicating stronger internal financial health and operational quality. Fortinet’s moderate score suggests some red flags in its fundamentals compared to VeriSign’s very strong rating:
How are the two companies positioned?
This section dissects the operational DNA of Fortinet and VeriSign by comparing their revenue distribution and internal strengths and weaknesses. The goal is to confront their economic moats and identify which model offers the most resilient, sustainable competitive advantage today.
Revenue Segmentation: The Strategic Mix
The following visual comparison dissects how Fortinet, Inc. and VeriSign, Inc. diversify their income streams and where their primary sector bets lie:
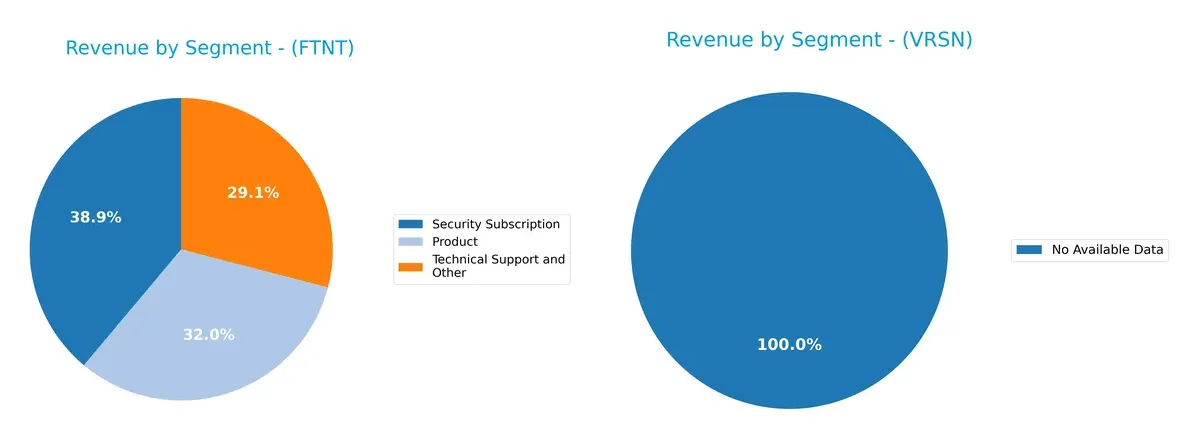
Fortinet shows a balanced revenue mix, with Security Subscription leading at $2.3B, followed by Product at $1.9B and Technical Support at $1.7B in 2024. This diversification reduces concentration risk and suggests a robust ecosystem lock-in. VeriSign lacks available segment data, preventing a direct comparison. Fortinet’s broad portfolio anchors its infrastructure dominance and resilience against market fluctuations.
Strengths and Weaknesses Comparison
This table compares the Strengths and Weaknesses of Fortinet, Inc. and VeriSign, Inc.:
Fortinet Strengths
- Diversified revenue streams including products and subscriptions
- Strong profitability with 27.26% net margin
- Favorable ROE and ROIC above WACC
- Global presence across Americas, EMEA, Asia Pacific
- High interest coverage ratio
- Solid asset turnover ratios
VeriSign Strengths
- Very high net margin at 57.68%
- Favorable WACC and interest coverage
- Strong asset turnover and fixed asset turnover
- Diverse geographic revenue with dominant US presence
- Favorable price-to-book despite negative debt-to-equity
- Generates modest dividend yield
Fortinet Weaknesses
- High PE and PB ratios signal possible overvaluation
- No dividend yield
- Moderate current and quick ratios suggest liquidity risks
- Moderate debt-to-assets ratio
- Neutral weighted average cost of capital
VeriSign Weaknesses
- Negative ROE and ROIC indicate poor capital efficiency
- Very low current and quick ratios raise liquidity concerns
- Extremely high debt-to-assets ratio signals financial risk
- Slight dividend yield despite financial weaknesses
- Negative debt-to-equity ratio complicates leverage assessment
Fortinet shows balanced strengths in profitability and global diversification but faces valuation and liquidity concerns. VeriSign’s strengths lie in profitability margins and asset efficiency, yet it struggles with capital returns and liquidity, posing strategic risks.
The Moat Duel: Analyzing Competitive Defensibility
A structural moat is the only thing protecting long-term profits from competitive erosion and market disruption:
Fortinet, Inc.: Integrated Cybersecurity Moat
Fortinet’s moat stems from broad product integration and high switching costs. It delivers stable 33% EBIT margins and growing ROIC. Expansion into AI-driven security deepens its moat in 2026.
VeriSign, Inc.: Domain Registry Network Moat
VeriSign’s moat relies on authoritative control over .com/.net domains, a critical network effect. However, declining ROIC signals weakening dominance. Potential regulatory risks cloud its 2026 outlook.
Integrated Cybersecurity vs. Network Control: The Moat Showdown
Fortinet’s expanding product ecosystem and rising profitability create a wider, deeper moat than VeriSign’s shrinking network advantage. Fortinet stands better poised to defend and grow market share.
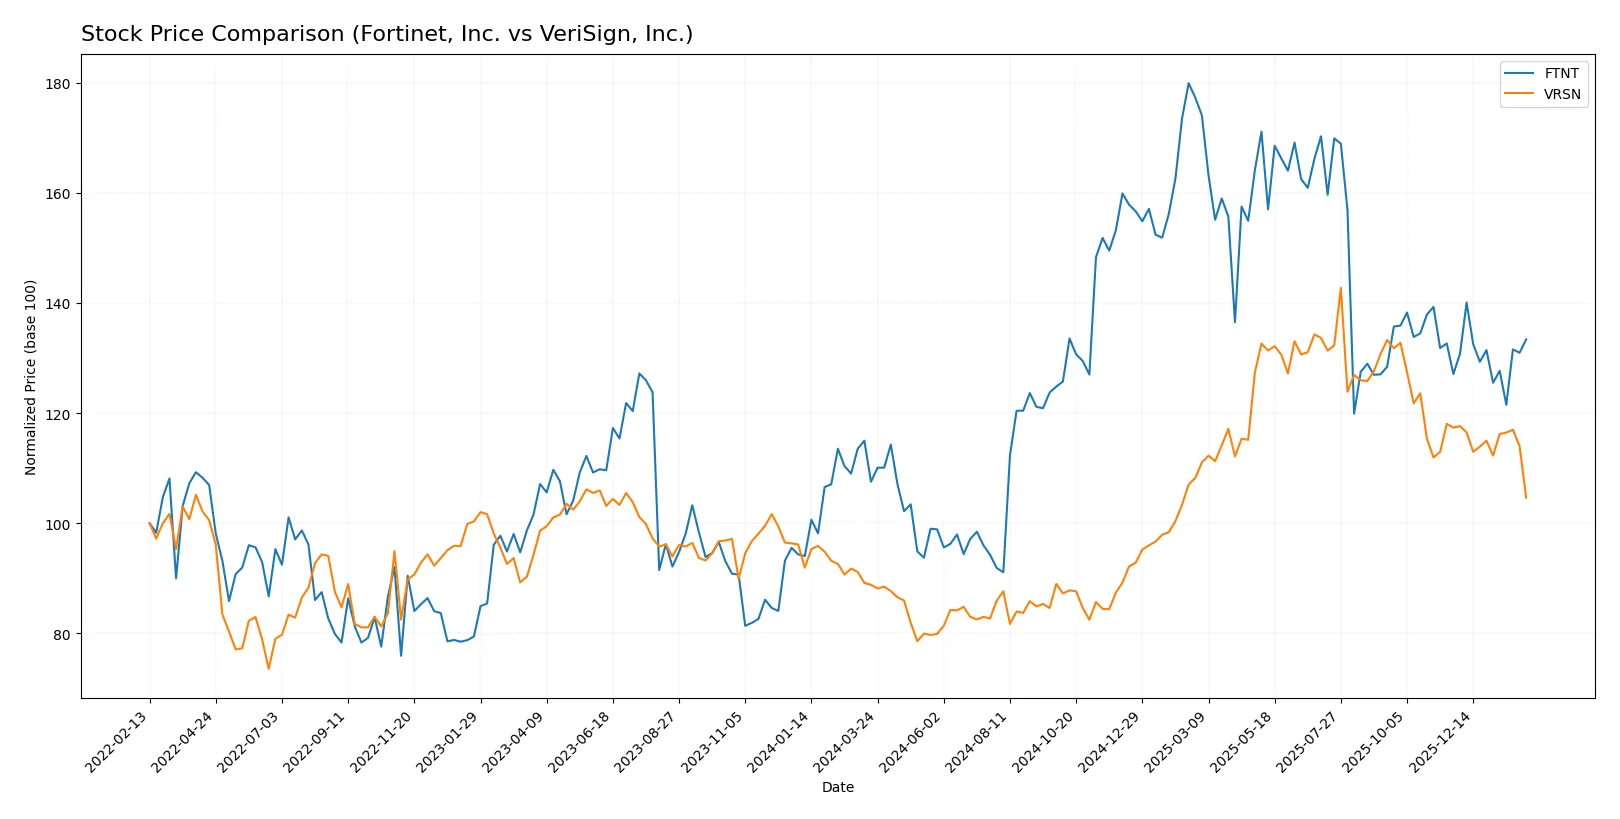
Which stock offers better returns?
Over the past year, Fortinet, Inc. and VeriSign, Inc. both delivered bullish returns with decelerating momentum. Fortinet showed steadier gains, while VeriSign faced stronger recent selling pressure.
Trend Comparison
Fortinet, Inc. gained 24.04% over 12 months, showing a bullish trend with deceleration. Its price ranged between 56.51 and 111.64, with volatility at 15.07%.
VeriSign, Inc. increased 17.83% over the same period, also bullish but decelerating. It showed higher volatility at 40.67%, with prices from 168.32 up to 305.79.
Fortinet outperformed VeriSign by 6.21% over the year, maintaining stronger upward momentum and less recent selling pressure.
Target Prices
Analysts show a positive outlook with solid upside potential for both Fortinet and VeriSign.
| Company | Target Low | Target High | Consensus |
|---|---|---|---|
| Fortinet, Inc. | 70 | 90 | 85 |
| VeriSign, Inc. | 325 | 325 | 325 |
Fortinet’s consensus target of 85 suggests a modest 3% upside from its current 82.76 price. VeriSign’s target at 325 signals a substantial 45% premium over today’s 224.17 price, reflecting strong analyst confidence.

Don’t Let Luck Decide Your Entry Point
Optimize your entry points with our advanced ProRealTime indicators. You’ll get efficient buy signals with precise price targets for maximum performance. Start outperforming now!
How do institutions grade them?
Fortinet, Inc. Grades
The following table summarizes recent analyst grades for Fortinet, Inc.:
| Grading Company | Action | New Grade | Date |
|---|---|---|---|
| Rosenblatt | maintain | Buy | 2026-02-06 |
| Mizuho | maintain | Underperform | 2026-02-06 |
| JP Morgan | maintain | Underweight | 2026-02-06 |
| RBC Capital | maintain | Sector Perform | 2026-02-06 |
| Wedbush | maintain | Outperform | 2026-02-06 |
| Scotiabank | downgrade | Sector Perform | 2026-02-02 |
| JP Morgan | maintain | Underweight | 2026-01-30 |
| Rosenblatt | upgrade | Buy | 2026-01-29 |
| TD Cowen | upgrade | Buy | 2026-01-23 |
| Citigroup | maintain | Neutral | 2026-01-13 |
VeriSign, Inc. Grades
Below is a summary of recent analyst grades for VeriSign, Inc.:
| Grading Company | Action | New Grade | Date |
|---|---|---|---|
| JP Morgan | maintain | Neutral | 2026-01-06 |
| Baird | maintain | Outperform | 2025-07-01 |
| Baird | maintain | Outperform | 2025-04-25 |
| Baird | maintain | Outperform | 2025-04-01 |
| Citigroup | maintain | Buy | 2025-02-04 |
| Citigroup | maintain | Buy | 2025-01-03 |
| Baird | upgrade | Outperform | 2024-12-09 |
| Baird | maintain | Neutral | 2024-06-27 |
| Baird | maintain | Neutral | 2024-04-26 |
| Citigroup | maintain | Buy | 2024-04-02 |
Which company has the best grades?
VeriSign, Inc. consistently receives Outperform and Buy ratings from multiple firms, reflecting stronger institutional confidence. Fortinet, Inc. shows a mixed profile with several Underperform and Underweight ratings offset by some Buy and Outperform calls. Investors may view VeriSign’s grades as more favorable in terms of analyst sentiment and potential upside.
Risks specific to each company
The following categories identify critical pressure points and systemic threats facing Fortinet, Inc. and VeriSign, Inc. in the 2026 market environment:
1. Market & Competition
Fortinet, Inc.
- Faces intense cybersecurity sector rivalry with rapid innovation demands.
VeriSign, Inc.
- Dominates domain registry but faces pressure from alternative digital infrastructure providers.
2. Capital Structure & Debt
Fortinet, Inc.
- Maintains moderate debt with favorable interest coverage; debt-to-assets ratio is low.
VeriSign, Inc.
- Exhibits highly leveraged balance sheet with debt-to-assets above 265%, a red flag for financial risk.
3. Stock Volatility
Fortinet, Inc.
- Beta near 1.05 indicates market-correlated volatility.
VeriSign, Inc.
- Lower beta of 0.75 suggests less sensitivity to market swings.
4. Regulatory & Legal
Fortinet, Inc.
- Must comply with global cybersecurity regulations and data privacy laws.
VeriSign, Inc.
- Subject to internet governance and domain registration regulatory scrutiny.
5. Supply Chain & Operations
Fortinet, Inc.
- Relies on hardware and software supply chains vulnerable to geopolitical disruptions.
VeriSign, Inc.
- Operational focus on internet infrastructure reduces physical supply chain risks.
6. ESG & Climate Transition
Fortinet, Inc.
- Faces increasing pressure to align cybersecurity solutions with ESG frameworks.
VeriSign, Inc.
- ESG risks moderate given digital infrastructure focus but must address energy use of data centers.
7. Geopolitical Exposure
Fortinet, Inc.
- Global footprint exposes it to trade tensions and regulatory divergence.
VeriSign, Inc.
- Geopolitical risks moderate with concentrated internet registry services.
Which company shows a better risk-adjusted profile?
Fortinet’s primary risk lies in intense competition and innovation demands. VeriSign faces critical financial distress risks from excessive leverage. Fortinet’s safer Altman Z-score and balanced capital structure offer a better risk-adjusted profile despite market volatility. VeriSign’s alarming negative Z-score signals elevated bankruptcy risk, underscoring its financial fragility in 2026.
Final Verdict: Which stock to choose?
Fortinet’s superpower lies in its robust value creation and steadily growing profitability. Its very favorable moat, marked by a high ROIC well above WACC, signals a company efficiently deploying capital for durable competitive advantage. A point of vigilance remains its stretched valuation multiples, suggesting caution on price. Fortinet suits investors targeting aggressive growth with a tolerance for premium pricing.
VeriSign’s strategic moat stems from its dominant position in digital infrastructure, delivering high gross margins and strong free cash flow yield. It offers a more conservative safety profile compared to Fortinet, despite weaker returns on invested capital and concerning liquidity ratios. VeriSign fits well within a GARP framework, appealing to investors seeking growth balanced with reasonable risk controls.
If you prioritize durable capital efficiency and growth momentum, Fortinet outshines as the compelling choice due to its proven ability to create shareholder value. However, if you seek stability with a strategic moat in digital assets and a more measured risk profile, VeriSign offers better stability despite challenges in capital returns. Both present analytical scenarios worth considering based on your investment strategy and risk appetite.
Disclaimer: Investment carries a risk of loss of initial capital. The past performance is not a reliable indicator of future results. Be sure to understand risks before making an investment decision.
Go Further
I encourage you to read the complete analyses of Fortinet, Inc. and VeriSign, Inc. to enhance your investment decisions: