Home > Comparison > Technology > FTNT vs PATH
The strategic rivalry between Fortinet, Inc. and UiPath Inc. shapes the Technology sector’s Software – Infrastructure landscape. Fortinet operates as a capital-intensive cybersecurity hardware and software provider, while UiPath excels as a high-margin robotic process automation platform. This analysis pits Fortinet’s integrated security approach against UiPath’s AI-driven automation growth. I will determine which company offers superior risk-adjusted returns for a diversified portfolio navigating evolving tech demands.
Table of contents
Companies Overview
Fortinet and UiPath stand out as pivotal players in the software infrastructure sector, shaping enterprise technology agendas globally.
Fortinet, Inc.: Cybersecurity Infrastructure Powerhouse
Fortinet dominates the cybersecurity infrastructure market with broad integrated security solutions. Its core revenue stems from hardware and software licenses like FortiGate firewalls and secure networking products. In 2026, Fortinet sharpens its strategy on automated, scalable cybersecurity services, targeting diverse industries including telecom, finance, and government to fortify their digital defenses.
UiPath Inc.: Robotic Process Automation Leader
UiPath leads in robotic process automation (RPA), generating revenue through its end-to-end automation platform. It enables enterprises to build, deploy, and manage software robots that optimize workflows. In 2026, UiPath focuses on expanding AI-driven automation capabilities and enhancing low-code environments to accelerate adoption in banking, healthcare, and government sectors.
Strategic Collision: Similarities & Divergences
Fortinet and UiPath both innovate within software infrastructure but follow different philosophies—Fortinet with a closed, security-centric ecosystem versus UiPath’s open, AI-powered automation platform. Their primary battleground is enterprise digital transformation, where security and operational efficiency intertwine. Fortinet offers a defensive moat in cybersecurity, while UiPath presents growth potential through scalable automation, defining two distinct investment profiles.
Income Statement Comparison
This data dissects the core profitability and scalability of both corporate engines to reveal who dominates the bottom line:
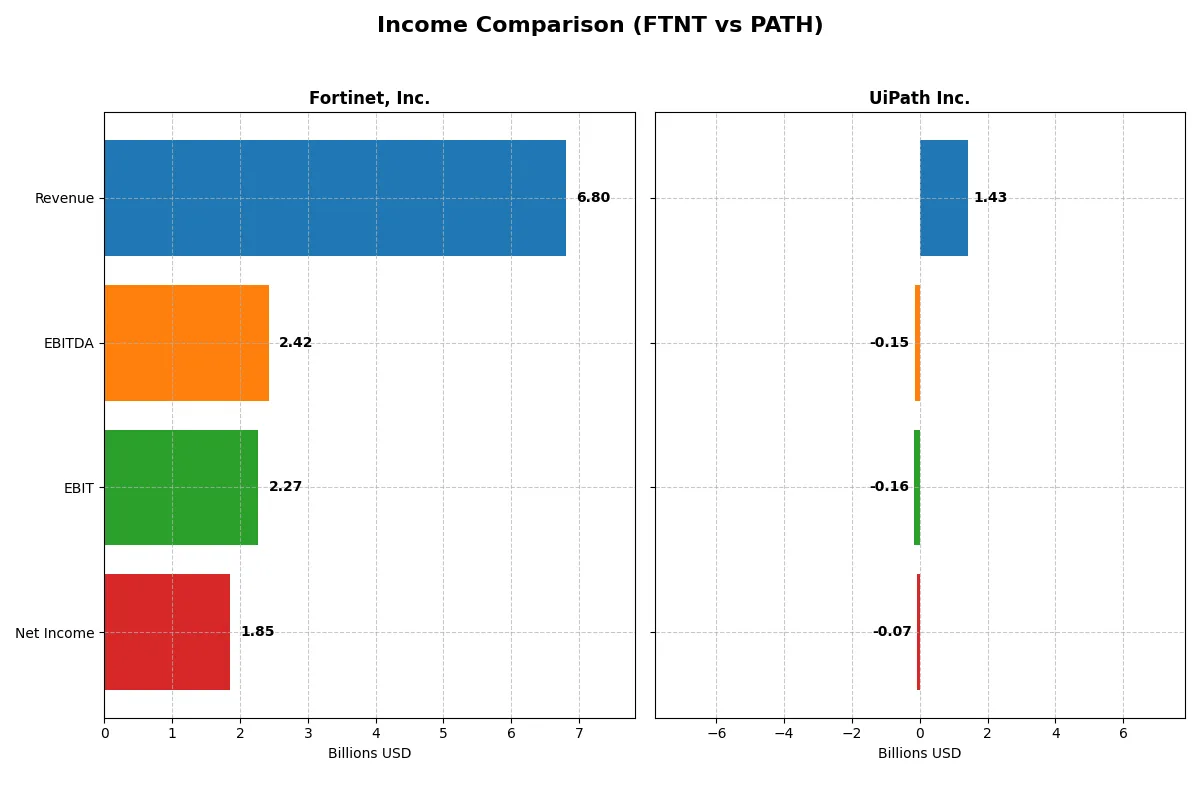
| Metric | Fortinet, Inc. (FTNT) | UiPath Inc. (PATH) |
|---|---|---|
| Revenue | 6.8B | 1.4B |
| Cost of Revenue | 1.3B | 247M |
| Operating Expenses | 3.4B | 1.3B |
| Gross Profit | 5.5B | 1.2B |
| EBITDA | 2.4B | -145M |
| EBIT | 2.3B | -163M |
| Interest Expense | 20M | 0 |
| Net Income | 1.9B | -74M |
| EPS | 2.44 | -0.13 |
| Fiscal Year | 2025 | 2025 |
Income Statement Analysis: The Bottom-Line Duel
This income statement comparison reveals which company transforms revenue into profit most efficiently and sustains margin strength over time.
Fortinet, Inc. Analysis
Fortinet’s revenue grew from 3.34B in 2021 to 6.8B in 2025, more than doubling in five years. Net income surged from 607M to 1.85B, demonstrating strong profitability. Gross margins hold steady above 80%, while net margins near 27%, reflecting excellent cost control. The 2025 year shows sustained momentum with a 14% revenue increase and a 7.5% EPS growth.
UiPath Inc. Analysis
UiPath expanded revenue from 608M in 2021 to 1.43B in 2025, a 135% increase. However, it remains unprofitable, posting a net loss of 74M in 2025 despite improving margins. Gross margins exceed 82%, but negative EBIT and net margins indicate ongoing challenges in scaling efficiently. The 2025 results show modest growth and narrowing losses, signaling operational progress.
Profitability Command vs. Growth Struggles
Fortinet dominates with robust profitability and margin expansion, delivering consistent earnings growth alongside revenue gains. UiPath exhibits rapid top-line growth but struggles to convert scale into profits, maintaining negative net margins. For investors prioritizing fundamental earnings strength, Fortinet’s profile offers a clearer route to sustainable returns.
Financial Ratios Comparison
These vital ratios act as a diagnostic tool to expose the underlying fiscal health, valuation premiums, and capital efficiency of the companies compared below:
| Ratios | Fortinet, Inc. (FTNT) | UiPath Inc. (PATH) |
|---|---|---|
| ROE | 1.50 | -0.04 |
| ROIC | 0.29 | -0.07 |
| P/E | 32.5 | -108.0 |
| P/B | 48.6 | 4.31 |
| Current Ratio | 1.17 | 2.93 |
| Quick Ratio | 1.09 | 2.93 |
| D/E | 0.81 | 0.04 |
| Debt-to-Assets | 0.10 | 0.03 |
| Interest Coverage | 104 | 0 |
| Asset Turnover | 0.65 | 0.50 |
| Fixed Asset Turnover | 4.20 | 14.41 |
| Payout Ratio | 0 | 0 |
| Dividend Yield | 0 | 0 |
| Fiscal Year | 2025 | 2025 |
Efficiency & Valuation Duel: The Vital Signs
Financial ratios serve as a company’s DNA, unveiling hidden risks and operational excellence beyond surface numbers.
Fortinet, Inc.
Fortinet displays robust profitability with a stellar 150% ROE and a strong 27.3% net margin, signaling operational efficiency. However, its P/E of 32.5 suggests the stock is stretched compared to sector averages. The company pays no dividend, instead reinvesting heavily in R&D to fuel growth and maintain its competitive moat.
UiPath Inc.
UiPath struggles with negative returns, showing a -4% ROE and a -5.15% net margin, reflecting ongoing operational challenges. The P/E ratio is negative but misleading, while a moderate P/B of 4.3 points to a discounted valuation. UiPath maintains a strong liquidity position with no dividends, prioritizing growth investments through elevated R&D spending.
Premium Valuation vs. Operational Safety
Fortinet offers impressive returns but trades at a premium, reflecting high market expectations. UiPath remains riskier with negative profitability but benefits from solid liquidity and lower valuation multiples. Investors seeking stable profitability may prefer Fortinet, while those focused on growth potential might consider UiPath’s turnaround profile.
Which one offers the Superior Shareholder Reward?
Fortinet and UiPath both forego dividends, reflecting divergent shareholder reward strategies. Fortinet delivers robust free cash flow (2.9B in 2025) with no dividend payout but executes substantial buybacks, balancing growth and capital return. UiPath reinvests heavily in R&D amid losses, with minimal buybacks and weaker operating margins. I see Fortinet’s buyback-driven model as more sustainable and rewarding in 2026, offering a superior total return compared to UiPath’s high-risk growth focus.
Comparative Score Analysis: The Strategic Profile
The radar chart reveals the fundamental DNA and trade-offs of Fortinet, Inc. and UiPath Inc., highlighting their financial strengths and weaknesses across key metrics:
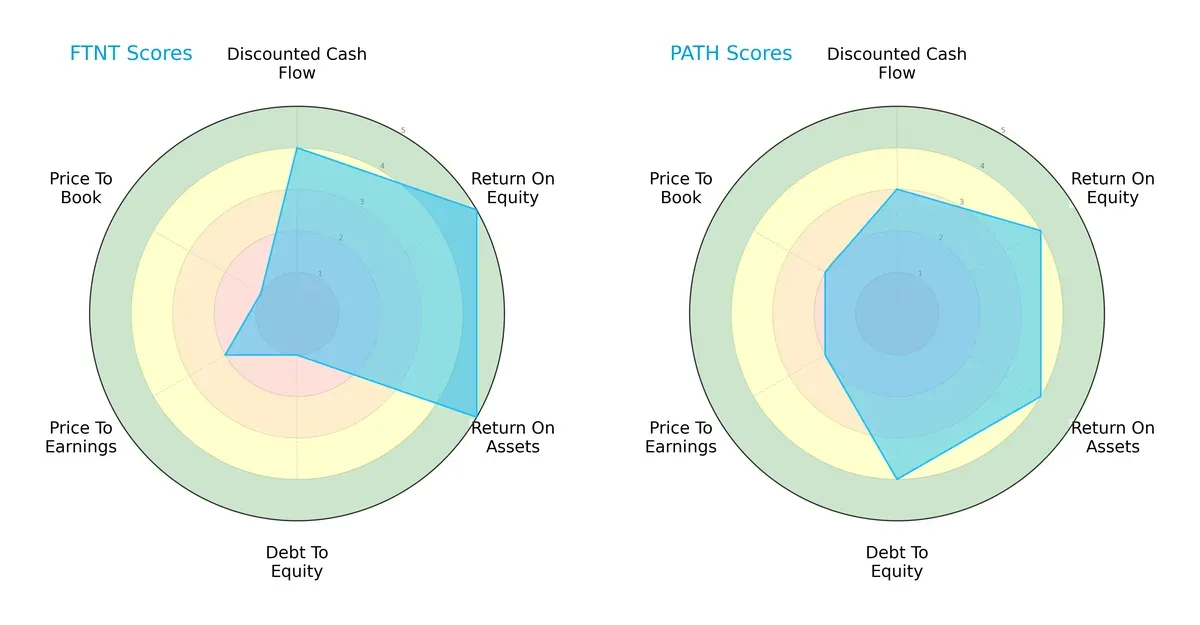
Fortinet shows superior profitability with higher ROE (5 vs. 4) and ROA (5 vs. 4) scores, indicating efficient asset and equity use. However, its balance sheet is weaker, reflected by a very unfavorable debt-to-equity score (1 vs. 4). UiPath offers a more balanced profile with moderate DCF (3 vs. 4) and stronger financial stability. Both share unfavorable valuation scores, but Fortinet relies heavily on operational efficiency while UiPath leans on financial prudence.
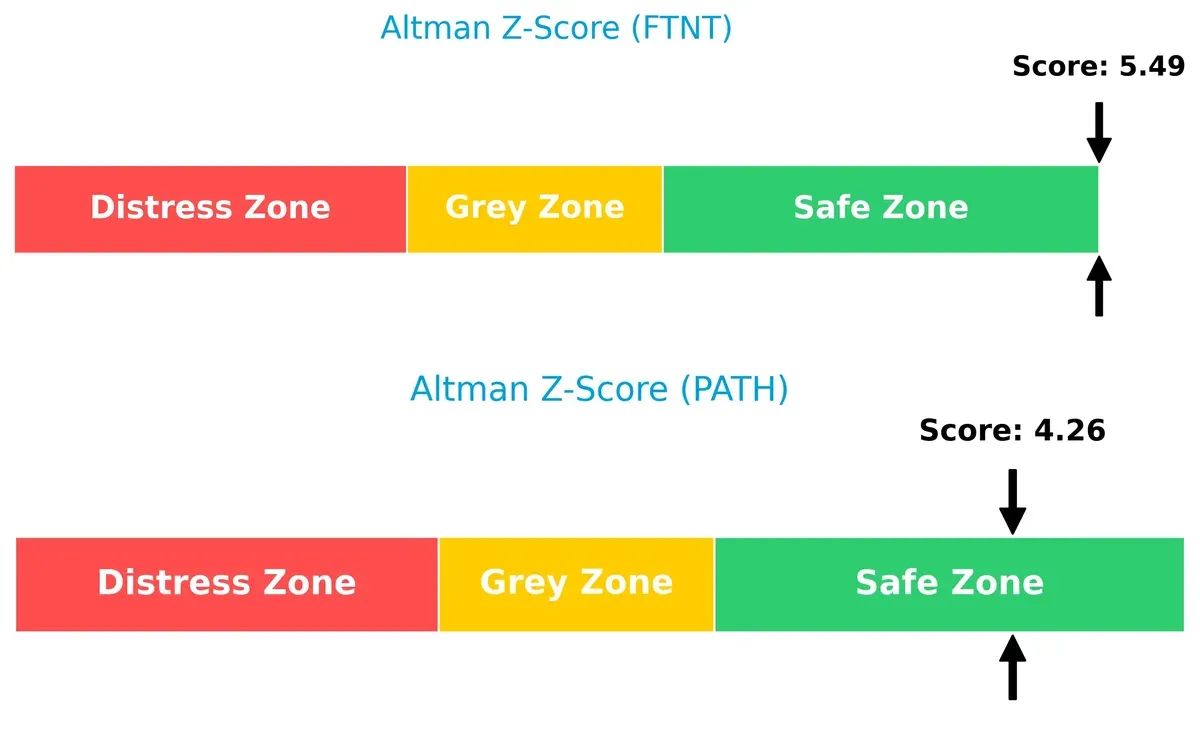
Bankruptcy Risk: Solvency Showdown
Fortinet’s Altman Z-Score (5.49) surpasses UiPath’s (4.26), both well within the safe zone. This gap signals Fortinet’s stronger buffer against bankruptcy risk in a volatile market:
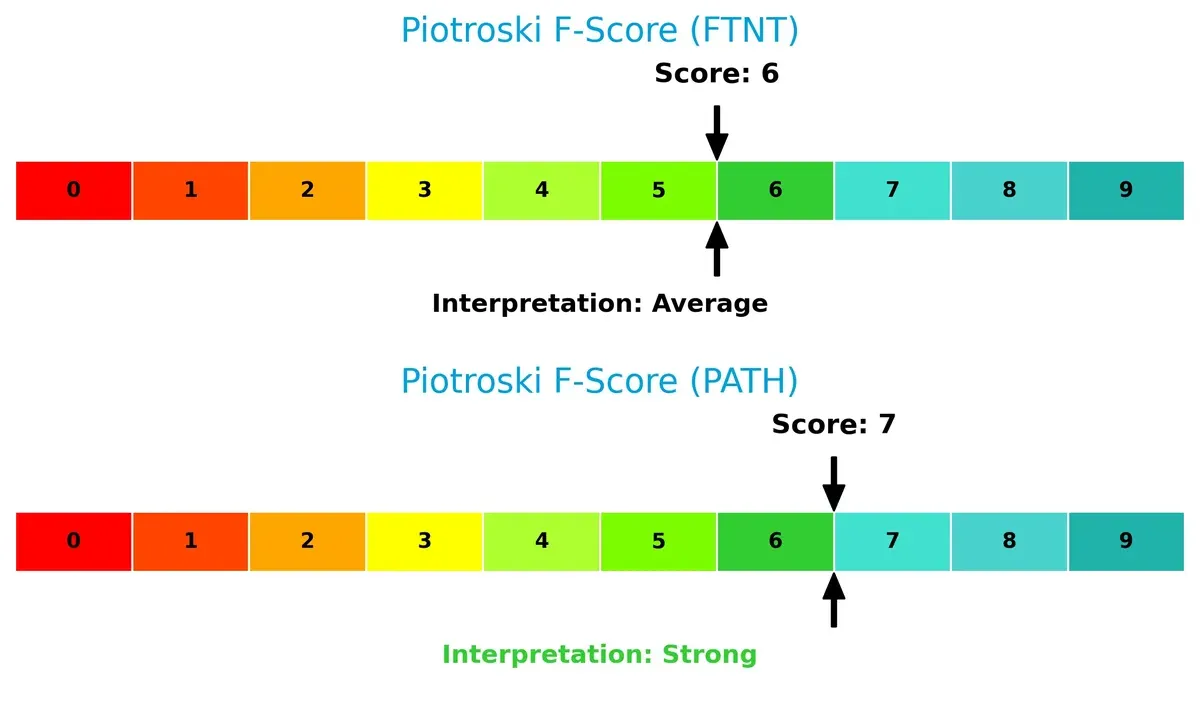
Financial Health: Quality of Operations
UiPath edges out Fortinet with a Piotroski F-Score of 7 versus 6, suggesting better overall financial health. Fortinet’s score, while average, hints at some internal red flags worth monitoring:
How are the two companies positioned?
This section dissects Fortinet and UiPath’s operational DNA by comparing their revenue distribution and internal strengths and weaknesses. The goal is to confront their economic moats and identify which model offers a more resilient, sustainable competitive advantage today.
Revenue Segmentation: The Strategic Mix
This visual comparison dissects how Fortinet and UiPath diversify their income streams and reveals where their primary sector bets lie:
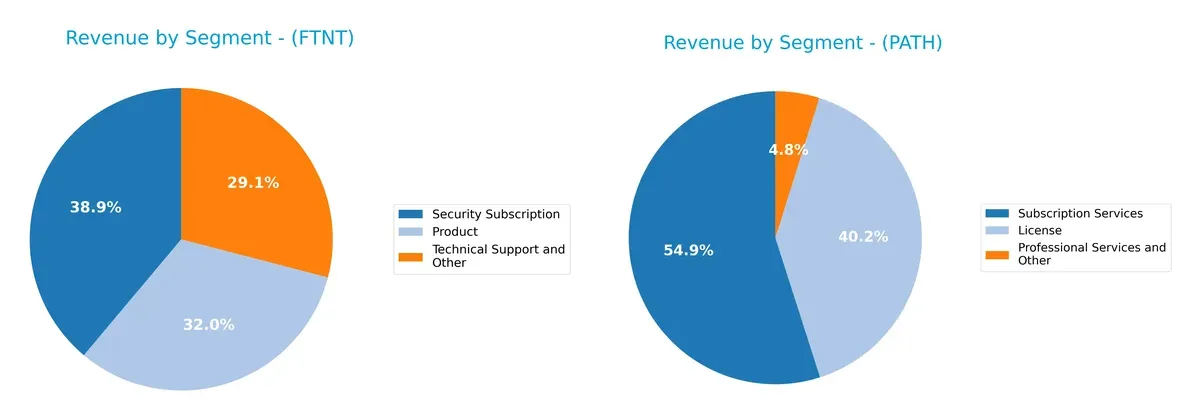
Fortinet anchors revenue in Security Subscription at $2.3B, complemented by $1.9B in Products and $1.7B in Technical Support. This mix shows a balanced ecosystem lock-in through recurring services and product sales. UiPath pivots more on Subscription Services at $800M, with License revenue close behind at $620M, and smaller Professional Services. UiPath’s reliance on subscription growth signals a SaaS-centric moat, while Fortinet’s broader base reduces concentration risk.
Strengths and Weaknesses Comparison
This table compares the strengths and weaknesses of Fortinet and UiPath based on diversification, profitability, financials, innovation, global reach, and market share:
Fortinet Strengths
- Balanced revenue from products, subscriptions, and support
- Strong profitability with 27% net margin and 150% ROE
- Low debt levels and high interest coverage
- Solid global reach across Americas, EMEA, and Asia Pacific
- Favorable fixed asset turnover at 4.2
UiPath Strengths
- Higher liquidity with current and quick ratios near 3.0
- Very low debt and low debt-to-assets ratio
- Strong fixed asset turnover at 14.4
- Growing subscription and license revenues
- Diversified geographic presence in Americas, EMEA, and Asia Pacific
Fortinet Weaknesses
- High valuation ratios: P/E 32.5 and P/B 48.6 raise concerns
- Dividend yield at zero
- Moderate current ratio at 1.17 limits short-term buffer
- Neutral asset turnover at 0.65
UiPath Weaknesses
- Negative profitability metrics with net margin -5% and ROE -4%
- Negative ROIC at -7.4% below WACC
- Zero interest coverage signals risk on debt service
- Unfavorable asset turnover at 0.5
- Zero dividend yield
Fortinet’s strengths lie in strong profitability and balanced global diversification, though valuation appears stretched. UiPath benefits from solid liquidity and asset efficiency but suffers from sustained unprofitability and financial risk. These contrasts highlight their differing strategic and operational challenges.
The Moat Duel: Analyzing Competitive Defensibility
A structural moat shields long-term profits from relentless competitive forces; without it, erosion is inevitable:
Fortinet, Inc.: Integrated Security Ecosystem Moat
Fortinet’s moat stems from its integrated cybersecurity platform, creating high switching costs and stable 33% EBIT margins. Its expanding global footprint deepens this moat in 2026.
UiPath Inc.: Automation Network Effects Moat
UiPath leverages network effects in robotic process automation, but weaker profitability contrasts with Fortinet’s strength. Growth in AI-driven automation tools offers expansion but also intensifies competitive pressure.
Integrated Platform vs. Network Effects: Fortinet’s Profit Powerhouse
Fortinet’s wider moat arises from superior ROIC exceeding WACC by 20%, versus UiPath’s negative spread, despite both improving returns. Fortinet better defends market share with scalable, high-margin solutions.
Which stock offers better returns?
Over the past year, Fortinet, Inc. gained 24.04%, showing a strong bullish trend with decelerating momentum. UiPath Inc. fell 43.34%, marking a bearish trend with slowing decline.
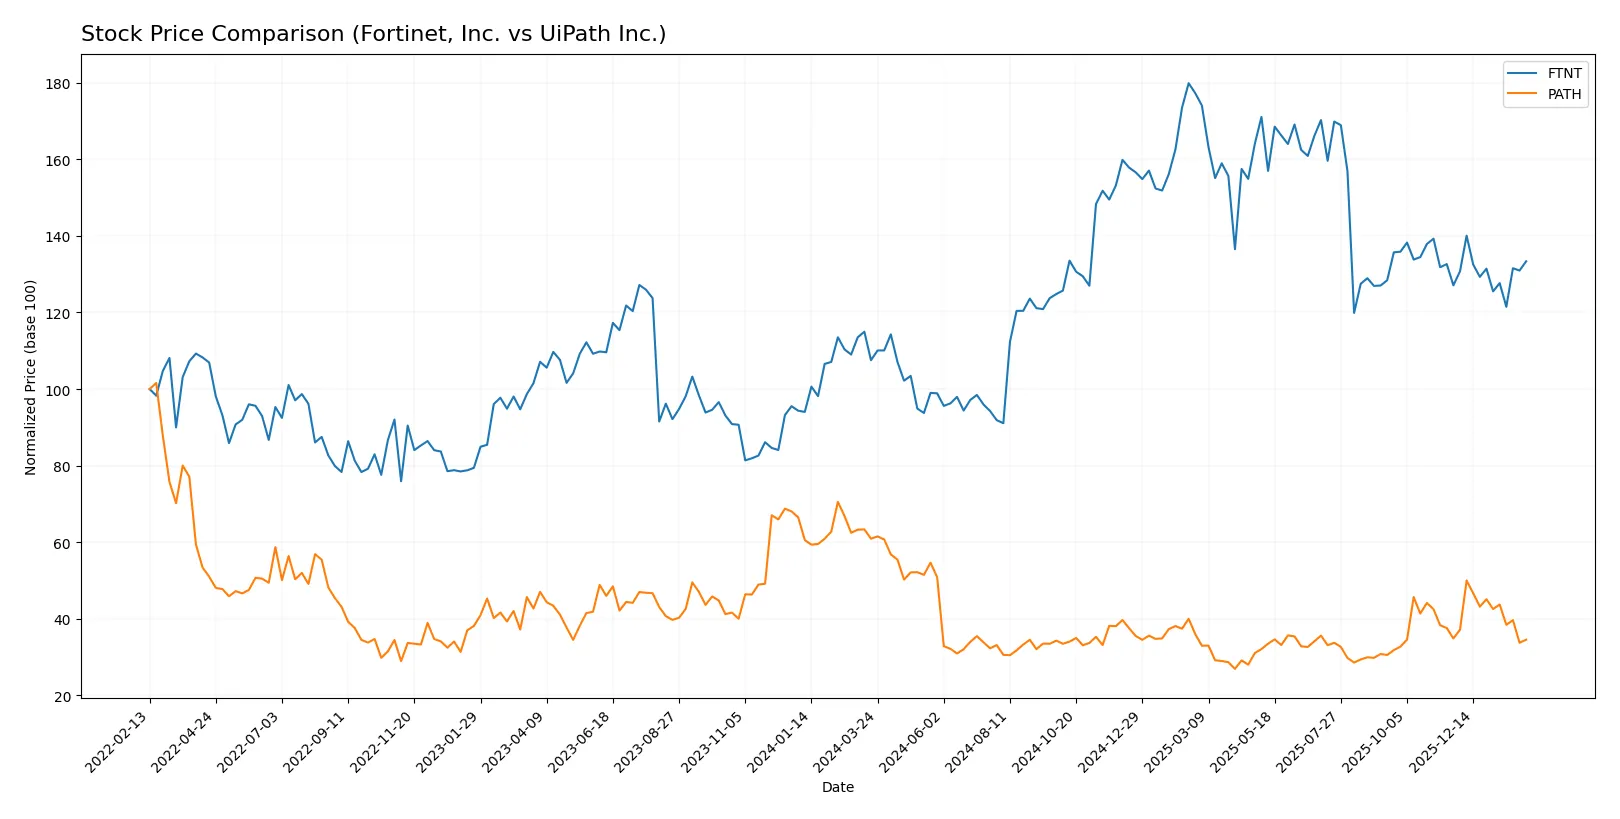
Trend Comparison
Fortinet’s stock rose 24.04% over 12 months, displaying a bullish trend despite decelerating growth and a high volatility of 15.07%. It peaked at 111.64 and bottomed at 56.51.
UiPath’s stock dropped 43.34% over the past year, confirming a bearish trend with deceleration and low volatility near 2.89%. The price fluctuated between 10.04 and 22.97.
Fortinet outperformed UiPath significantly, delivering positive returns while UiPath experienced heavy losses over the same period.
Target Prices
Analysts present a cautiously optimistic target consensus for Fortinet and UiPath.
| Company | Target Low | Target High | Consensus |
|---|---|---|---|
| Fortinet, Inc. | 70 | 90 | 85 |
| UiPath Inc. | 14 | 19 | 16.6 |
Fortinet’s target consensus exceeds its current price of $82.76, signaling moderate upside potential. UiPath’s consensus target at $16.6 also suggests a positive price trajectory versus the $12.89 current price.

Don’t Let Luck Decide Your Entry Point
Optimize your entry points with our advanced ProRealTime indicators. You’ll get efficient buy signals with precise price targets for maximum performance. Start outperforming now!
How do institutions grade them?
Fortinet, Inc. Grades
The following table summarizes the latest institutional grades for Fortinet, Inc.:
| Grading Company | Action | New Grade | Date |
|---|---|---|---|
| Rosenblatt | Maintain | Buy | 2026-02-06 |
| Mizuho | Maintain | Underperform | 2026-02-06 |
| JP Morgan | Maintain | Underweight | 2026-02-06 |
| RBC Capital | Maintain | Sector Perform | 2026-02-06 |
| Wedbush | Maintain | Outperform | 2026-02-06 |
| Scotiabank | Downgrade | Sector Perform | 2026-02-02 |
| JP Morgan | Maintain | Underweight | 2026-01-30 |
| Rosenblatt | Upgrade | Buy | 2026-01-29 |
| TD Cowen | Upgrade | Buy | 2026-01-23 |
| Citigroup | Maintain | Neutral | 2026-01-13 |
UiPath Inc. Grades
The following table summarizes the latest institutional grades for UiPath Inc.:
| Grading Company | Action | New Grade | Date |
|---|---|---|---|
| Barclays | Maintain | Equal Weight | 2026-01-12 |
| RBC Capital | Maintain | Sector Perform | 2026-01-05 |
| RBC Capital | Maintain | Sector Perform | 2025-12-10 |
| Morgan Stanley | Maintain | Equal Weight | 2025-12-09 |
| DA Davidson | Maintain | Neutral | 2025-12-05 |
| BMO Capital | Maintain | Market Perform | 2025-12-04 |
| Mizuho | Maintain | Neutral | 2025-12-04 |
| RBC Capital | Maintain | Sector Perform | 2025-12-04 |
| Needham | Maintain | Hold | 2025-12-04 |
| Barclays | Maintain | Equal Weight | 2025-12-04 |
Which company has the best grades?
Fortinet shows a wider spread of grades, including multiple Buy and Outperform ratings, while UiPath predominantly receives Neutral to Sector Perform grades. Fortinet’s stronger institutional sentiment could influence investor perception positively.
Risks specific to each company
The following categories identify the critical pressure points and systemic threats facing both firms in the 2026 market environment:
1. Market & Competition
Fortinet, Inc.
- Operates in a highly competitive cybersecurity market with strong incumbents and rapid innovation cycles.
UiPath Inc.
- Faces intense competition in the RPA and automation space, with evolving AI technologies pressuring market share.
2. Capital Structure & Debt
Fortinet, Inc.
- Moderate debt-to-equity ratio of 0.81 signals balanced leverage; interest coverage is very strong at 113x.
UiPath Inc.
- Very low leverage with a debt-to-equity of 0.04 but zero interest coverage, indicating potential risk if debt rises.
3. Stock Volatility
Fortinet, Inc.
- Beta of 1.05 suggests slightly above-market volatility but stable trading range ($70.12–$114.82).
UiPath Inc.
- Beta of 1.07 implies marginally higher volatility; trading range is wider and stock price lower ($9.38–$19.84).
4. Regulatory & Legal
Fortinet, Inc.
- Subject to cybersecurity compliance and data privacy laws globally, which can increase costs and risks.
UiPath Inc.
- Faces regulatory scrutiny on data usage and AI ethics, especially in U.S. and European markets.
5. Supply Chain & Operations
Fortinet, Inc.
- Hardware and software integration depend on global supply chains vulnerable to geopolitical and logistic disruptions.
UiPath Inc.
- Software-centric model reduces supply chain risks but relies heavily on cloud infrastructure stability.
6. ESG & Climate Transition
Fortinet, Inc.
- Increasing pressure to reduce carbon footprint in hardware production and data center energy use.
UiPath Inc.
- Faces ESG scrutiny on ethical AI development and energy consumption in cloud operations.
7. Geopolitical Exposure
Fortinet, Inc.
- Global footprint subjects it to trade tensions, especially U.S.-China tech restrictions.
UiPath Inc.
- Geographic concentration in U.S., Romania, and Japan limits broad geopolitical risks but creates regional exposure.
Which company shows a better risk-adjusted profile?
Fortinet’s key risk is market competition and hardware supply chain vulnerabilities, but strong financials and high interest coverage mitigate concerns. UiPath struggles with negative profitability and regulatory risks in AI but benefits from low leverage and strong liquidity. Overall, Fortinet shows a more favorable risk-adjusted profile, supported by its safe-zone Altman Z-score of 5.5 and very favorable ROE of 150%. UiPath’s negative margins and zero interest coverage raise caution despite a strong Piotroski score of 7. The widening stock price range and higher volume volatility in UiPath underline its elevated market risk.
Final Verdict: Which stock to choose?
Fortinet, Inc. stands out with its unmatched ability to generate high returns on invested capital, signaling a robust economic moat and efficient capital allocation. Its main point of vigilance remains a modest current ratio, which warrants monitoring but does not overshadow its operational strength. This stock suits portfolios aiming for aggressive growth anchored in sustainable profitability.
UiPath Inc. leverages a strategic moat rooted in its recurring revenue model and cloud automation expertise, offering a relatively safer balance sheet with a strong current ratio and low debt. However, it is still navigating profitability challenges, making it more fitting for growth at a reasonable price (GARP) investors who tolerate volatility for future payoff.
If you prioritize durable value creation and proven profitability, Fortinet outshines with its superior returns and operational efficiency. However, if you seek exposure to innovative growth with a more conservative balance sheet, UiPath offers better stability amid its transition phase. Both carry risks, but your choice depends on your appetite for aggressive growth versus measured growth potential.
Disclaimer: Investment carries a risk of loss of initial capital. The past performance is not a reliable indicator of future results. Be sure to understand risks before making an investment decision.
Go Further
I encourage you to read the complete analyses of Fortinet, Inc. and UiPath Inc. to enhance your investment decisions: