Home > Comparison > Technology > FTNT vs TDC
The strategic rivalry between Fortinet, Inc. and Teradata Corporation shapes the evolution of the technology sector’s software infrastructure landscape. Fortinet dominates as a cybersecurity powerhouse with integrated hardware and software solutions, while Teradata excels as a multi-cloud data platform provider focused on enterprise analytics. This head-to-head pits cybersecurity innovation against data analytics leadership. This analysis aims to identify which trajectory offers superior risk-adjusted returns for a diversified portfolio in 2026.
Table of contents
Companies Overview
Fortinet and Teradata stand as key players in the software infrastructure market, shaping enterprise technology landscapes globally.
Fortinet, Inc.: Cybersecurity Powerhouse
Fortinet leads in cybersecurity solutions, generating revenue through integrated hardware and software products like FortiGate firewalls and endpoint protection. Its 2026 strategy emphasizes broad, automated security offerings spanning networking, email, and web applications. Fortinet’s competitive edge lies in its comprehensive product ecosystem addressing diverse industry needs with scalable security management.
Teradata Corporation: Data Analytics Specialist
Teradata specializes in multi-cloud data platforms that enable enterprise analytics and ecosystem simplification. Revenue flows from its flagship Vantage platform, alongside consulting and support services that guide customers’ cloud migration and data strategy execution. In 2026, Teradata focuses on expanding multi-cloud integration and analytical infrastructure value for sectors like finance and healthcare.
Strategic Collision: Similarities & Divergences
Both companies excel in software infrastructure but diverge sharply in focus: Fortinet pursues a security-centric, integrated hardware-software model while Teradata champions an open multi-cloud analytics platform. Their primary battleground is enterprise IT ecosystems—Fortinet in secure networking, Teradata in data management. These distinctions create contrasting investment profiles: Fortinet offers broad cybersecurity moat, Teradata delivers specialized data analytics expertise.
Income Statement Comparison
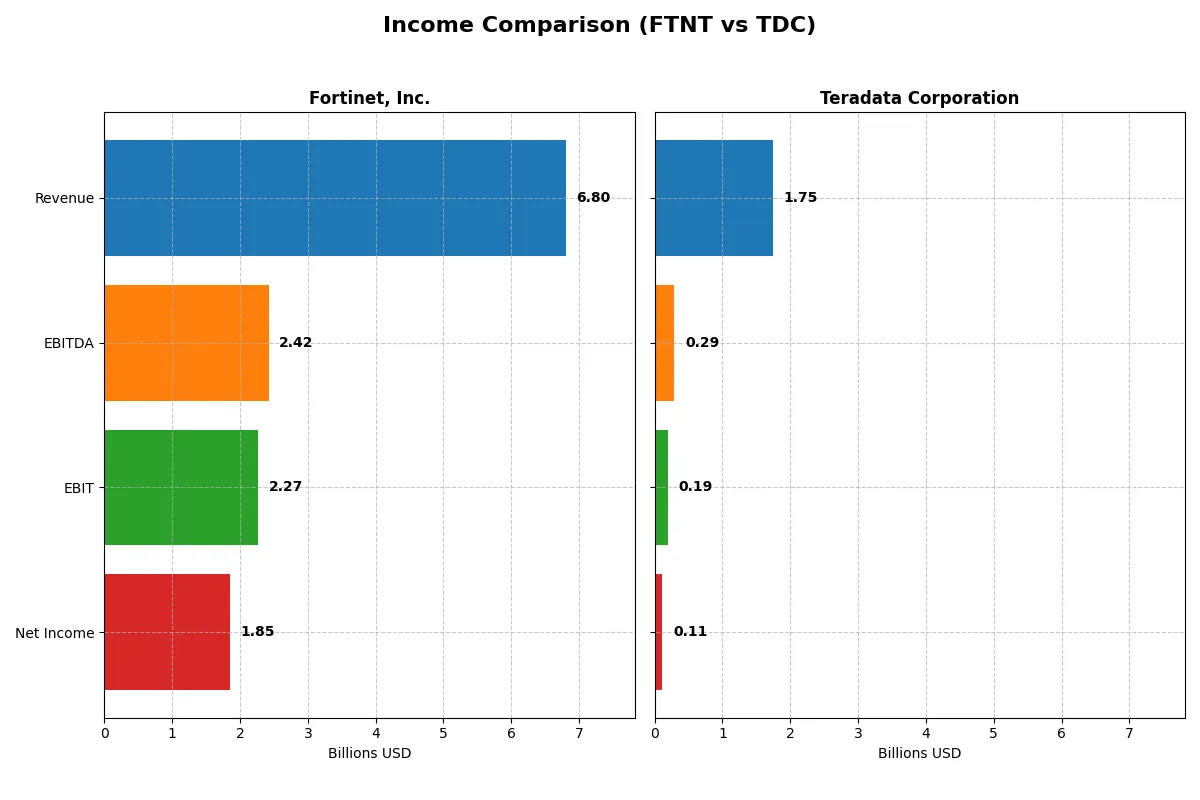
This data dissects the core profitability and scalability of both corporate engines to reveal who dominates the bottom line:
| Metric | Fortinet, Inc. (FTNT) | Teradata Corporation (TDC) |
|---|---|---|
| Revenue | 6.8B | 1.75B |
| Cost of Revenue | 1.3B | 692M |
| Operating Expenses | 3.42B | 849M |
| Gross Profit | 5.5B | 1.06B |
| EBITDA | 2.42B | 293M |
| EBIT | 2.27B | 193M |
| Interest Expense | 20M | 29M |
| Net Income | 1.85B | 114M |
| EPS | 2.44 | 1.18 |
| Fiscal Year | 2025 | 2024 |
Income Statement Analysis: The Bottom-Line Duel
This income statement comparison reveals which company operates with superior efficiency and profitability in their respective markets.
Fortinet, Inc. Analysis
Fortinet’s revenue surged from 3.3B in 2021 to nearly 6.8B in 2025, doubling over five years. Its net income more than tripled, reaching 1.85B in 2025. Gross and net margins remain robust at 80.8% and 27.3%, respectively, underscoring strong cost control and pricing power. The latest year shows solid momentum with 14% revenue growth and favorable operating leverage.
Teradata Corporation Analysis
Teradata’s revenue declined slightly from 1.9B in 2021 to 1.75B in 2024, signaling top-line pressure. Net income halved over the period, falling to 114M in 2024. Margins are slimmer, with a gross margin of 60.5% and net margin of 6.5%, reflecting tighter profitability. However, Teradata’s 2024 shows improved EBIT growth (+31%) and a near doubling of net margin, hinting at operational recovery.
Margin Strength vs. Revenue Growth
Fortinet clearly leads in scale, efficiency, and sustained margin expansion, demonstrating superior capital allocation and market positioning. Teradata struggles with shrinking revenue and profitability, despite recent margin improvements. For investors, Fortinet’s growth and margin consistency offer a stronger fundamental profile than Teradata’s uneven recovery.
Financial Ratios Comparison
These vital ratios act as a diagnostic tool to expose the underlying fiscal health, valuation premiums, and capital efficiency of Fortinet, Inc. and Teradata Corporation:
| Ratios | Fortinet (FTNT) | Teradata (TDC) |
|---|---|---|
| ROE | 1.50 | 0.86 |
| ROIC | 0.29 | 0.17 |
| P/E | 32.48 | 26.34 |
| P/B | 48.64 | 22.58 |
| Current Ratio | 1.17 | 0.81 |
| Quick Ratio | 1.09 | 0.79 |
| D/E | 0.81 | 4.33 |
| Debt-to-Assets | 0.10 | 0.34 |
| Interest Coverage | 103.72 | 7.21 |
| Asset Turnover | 0.65 | 1.03 |
| Fixed Asset Turnover | 4.20 | 9.07 |
| Payout ratio | 0 | 0 |
| Dividend yield | 0 | 0 |
| Fiscal Year | 2025 | 2024 |
Efficiency & Valuation Duel: The Vital Signs
Financial ratios act as a company’s DNA, exposing hidden risks and operational strengths critical for investment decisions.
Fortinet, Inc.
Fortinet delivers exceptional profitability with a 150% ROE and a strong 27.3% net margin, signaling operational excellence. However, its valuation appears stretched, with a P/E of 32.5 and a high P/B of 48.6. The company retains earnings to fuel growth, as it pays no dividends, reflecting a reinvestment focus on innovation.
Teradata Corporation
Teradata shows solid profitability, posting an 85.7% ROE and a modest 6.5% net margin. Its valuation, with a P/E of 26.3 and P/B of 22.6, remains relatively expensive given weaker liquidity and high leverage. Teradata also forgoes dividends, channeling cash into R&D to drive future growth, reflecting a growth-oriented capital allocation.
Premium Valuation vs. Operational Safety
Fortinet commands a premium valuation backed by superior profitability and efficient capital use, while Teradata faces higher financial risk with less robust margins. Fortinet’s profile suits investors prioritizing operational strength and growth, whereas Teradata appeals more to those tolerating risk for potential turnaround rewards.
Which one offers the Superior Shareholder Reward?
I compare Fortinet and Teradata’s shareholder reward through their distribution strategies. Neither pays dividends, so reinvestment and buybacks are crucial. Fortinet boasts zero dividend yield and payout but generates robust free cash flow of 2.9B per share. Its buyback program is aggressive, amplifying shareholder value. Teradata also pays no dividends but delivers slightly lower free cash flow per share at 2.87B. However, its buyback intensity is modest. Fortinet’s higher free cash flow coverage and stronger buyback activity underpin a more sustainable model for long-term value. I conclude Fortinet offers the superior total shareholder return profile in 2026.
Comparative Score Analysis: The Strategic Profile
The radar chart reveals the fundamental DNA and trade-offs of Fortinet, Inc. and Teradata Corporation, highlighting their strategic strengths and vulnerabilities:
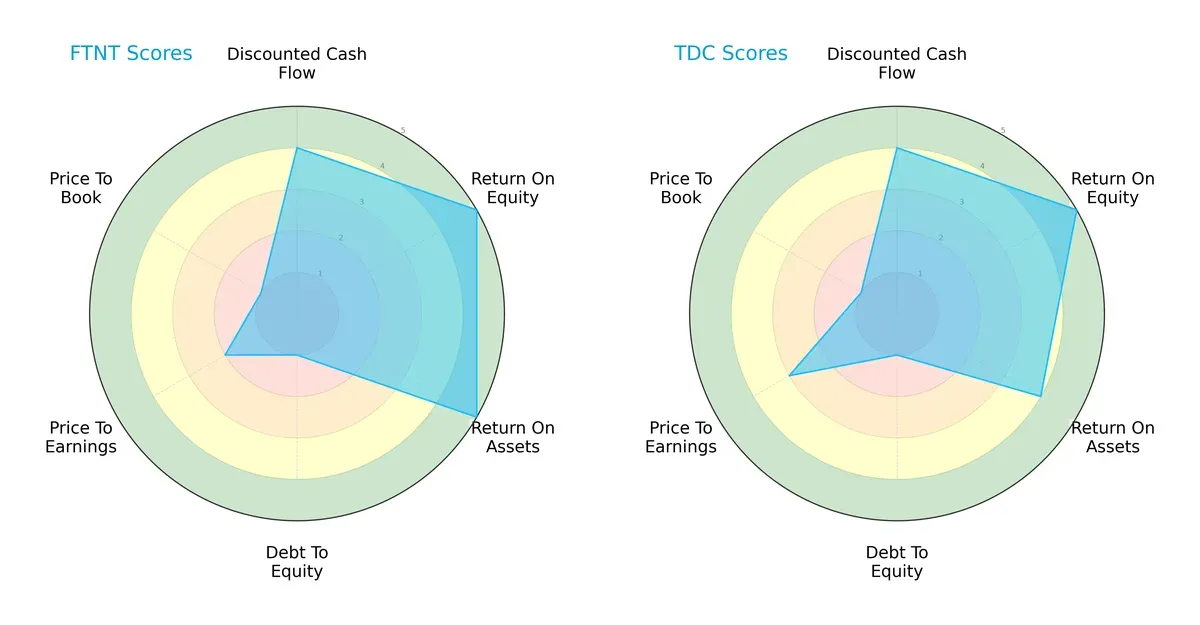
Both firms share strong discounted cash flow (DCF) and return on equity (ROE) scores, signaling robust profitability and valuation support. Fortinet edges Teradata on return on assets (ROA) with a 5 versus 4, showing superior asset efficiency. However, both struggle with debt-to-equity and price-to-book (P/B) metrics, scoring very unfavorably, reflecting elevated leverage and stretched valuation multiples. Teradata offers a slightly better price-to-earnings (P/E) score, suggesting marginally fairer valuation. Overall, Fortinet presents a more balanced operational profile, while Teradata leans on valuation advantages amid financial leverage concerns.
Bankruptcy Risk: Solvency Showdown
Fortinet’s Altman Z-Score of 5.49 versus Teradata’s 0.69 indicates a stark contrast in bankruptcy risk:
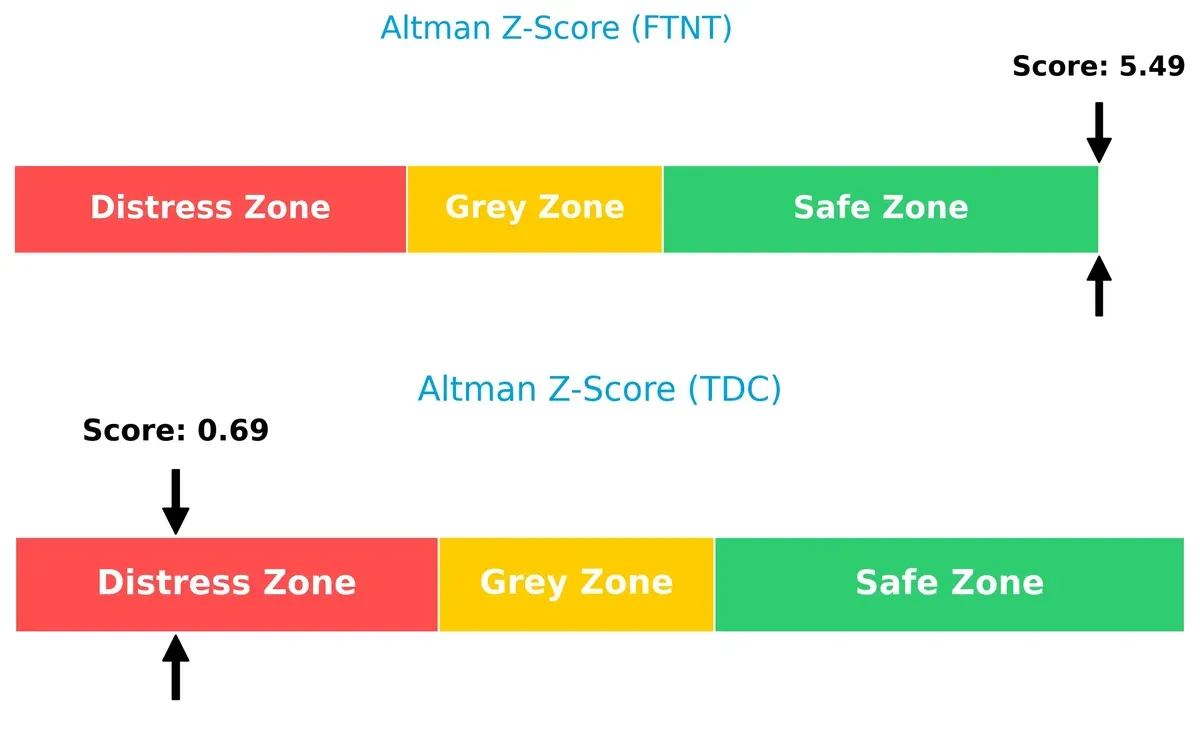
Fortinet resides firmly in the safe zone, signaling strong solvency and resilience in this economic cycle. Teradata’s distress zone score warns of significant financial fragility, raising red flags for long-term survival without material capital restructuring.
Financial Health: Quality of Operations
Teradata’s Piotroski F-Score of 8 outperforms Fortinet’s 6, revealing a stronger internal financial quality and operational health:
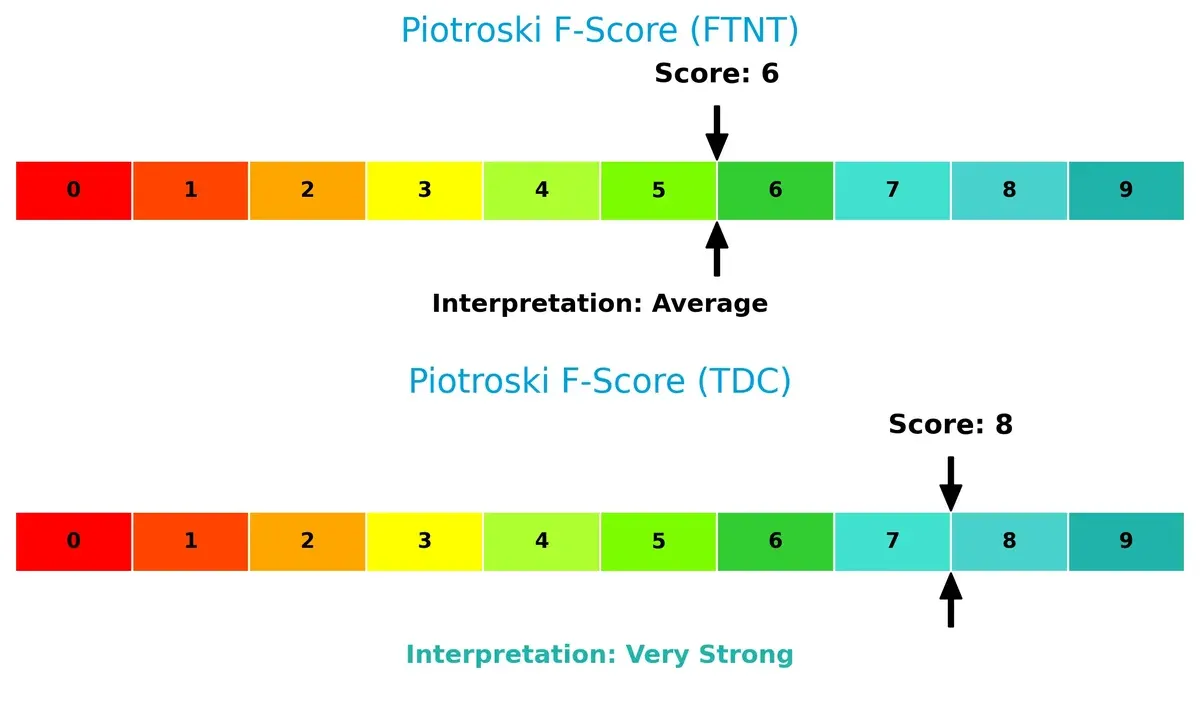
Teradata demonstrates superior profitability, liquidity, and efficiency metrics, while Fortinet’s moderate score suggests caution. Investors should consider Teradata’s robust fundamentals against its solvency risks, whereas Fortinet’s financial health is stable but less dynamic.
How are the two companies positioned?
This section dissects Fortinet and Teradata’s operational DNA by comparing their revenue distribution and internal dynamics. The goal is to confront their economic moats and identify which model offers the most resilient competitive advantage today.
Revenue Segmentation: The Strategic Mix
The following visual comparison dissects how Fortinet, Inc. and Teradata Corporation diversify their income streams and where their primary sector bets lie:
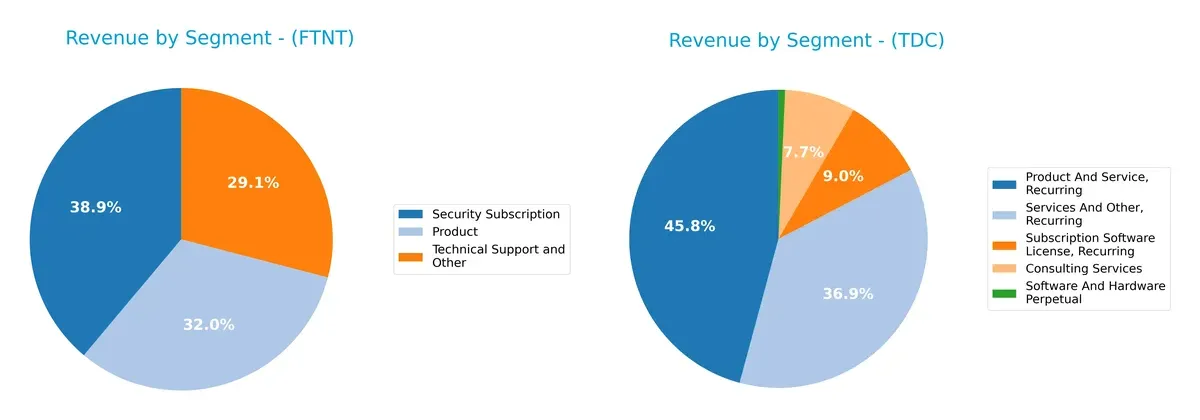
Fortinet anchors revenue in three balanced segments: Product at $1.9B, Security Subscription at $2.3B, and Technical Support at $1.7B. This mix signals a robust ecosystem lock-in through recurring security services. Teradata, however, pivots on two heavyweights: Product And Service Recurring at $1.5B and Services And Other Recurring at $1.2B, dwarfing smaller slices like Consulting at $248M. Teradata’s concentration heightens exposure to enterprise data analytics demand cycles. Fortinet’s diversification cushions volatility better.
Strengths and Weaknesses Comparison
This table compares the Strengths and Weaknesses of Fortinet, Inc. and Teradata Corporation:
Fortinet Strengths
- Strong profitability with 27.26% net margin and 149.77% ROE
- Favorable ROIC of 28.76% well above WACC
- Balanced global presence across Americas, EMEA, Asia Pacific
- Diverse revenue streams from products, subscriptions, and technical support
- High interest coverage ratio indicating low financial risk
- Favorable fixed asset turnover of 4.2
Teradata Strengths
- High ROE of 85.71% and favorable ROIC of 16.89%
- Favorable WACC of 5.65% supports capital efficiency
- Strong asset turnover at 1.03 and fixed asset turnover at 9.07
- Global footprint with significant Americas and EMEA revenue
- Diverse recurring revenue from consulting, subscriptions, and services
- Favorable interest coverage ratio supports debt servicing
Fortinet Weaknesses
- Unfavorable valuation metrics: P/E 32.48, P/B 48.64
- Neutral liquidity ratios with current ratio 1.17
- No dividend yield limits income appeal
- Moderate debt-to-equity at 0.81 could constrain flexibility
- Slightly higher exposure to market valuation risk
Teradata Weaknesses
- Unfavorable liquidity with current ratio 0.81 and quick ratio 0.79
- High debt-to-equity ratio of 4.33 elevates financial risk
- Unfavorable P/E 26.34 and P/B 22.58 valuations
- Zero dividend yield reduces yield attractiveness
- Neutral debt-to-assets at 33.8% may pressure balance sheet
Fortinet demonstrates superior profitability and balanced international diversification but faces valuation and liquidity challenges. Teradata shows strong capital efficiency and asset utilization but is constrained by weaker liquidity and higher leverage. Both companies have no dividend yield, impacting income-focused investors.
The Moat Duel: Analyzing Competitive Defensibility
A structural moat is the only thing protecting long-term profits from relentless competition erosion. Let’s dissect the moats of two tech infrastructure players:
Fortinet, Inc.: Network Effect and Integrated Security Ecosystem
Fortinet’s moat stems from its broad, integrated cybersecurity platform that locks in customers through network effects and switching costs. Its 33.4% EBIT margin and 20%+ ROIC above WACC confirm strong value creation. Expansion in Asia-Pacific and new product suites in 2026 should deepen this moat.
Teradata Corporation: Data Platform Specialization and Multi-Cloud Connectivity
Teradata’s moat lies in its specialized multi-cloud data platform focused on enterprise analytics, contrasting Fortinet’s cybersecurity focus. Despite lower margins (11.0% EBIT) and a smaller market cap, Teradata’s accelerating ROIC trend signals efficient capital use. Its cloud migration services offer growth opportunities amid market shifts.
Network Effects vs. Platform Specialization: Who Holds the Deeper Moat?
Fortinet’s integrated security ecosystem delivers wider and more stable economic profits than Teradata’s niche data platform. Fortinet’s superior margins and revenue growth position it better to defend market share against competitors in 2026.
Which stock offers better returns?
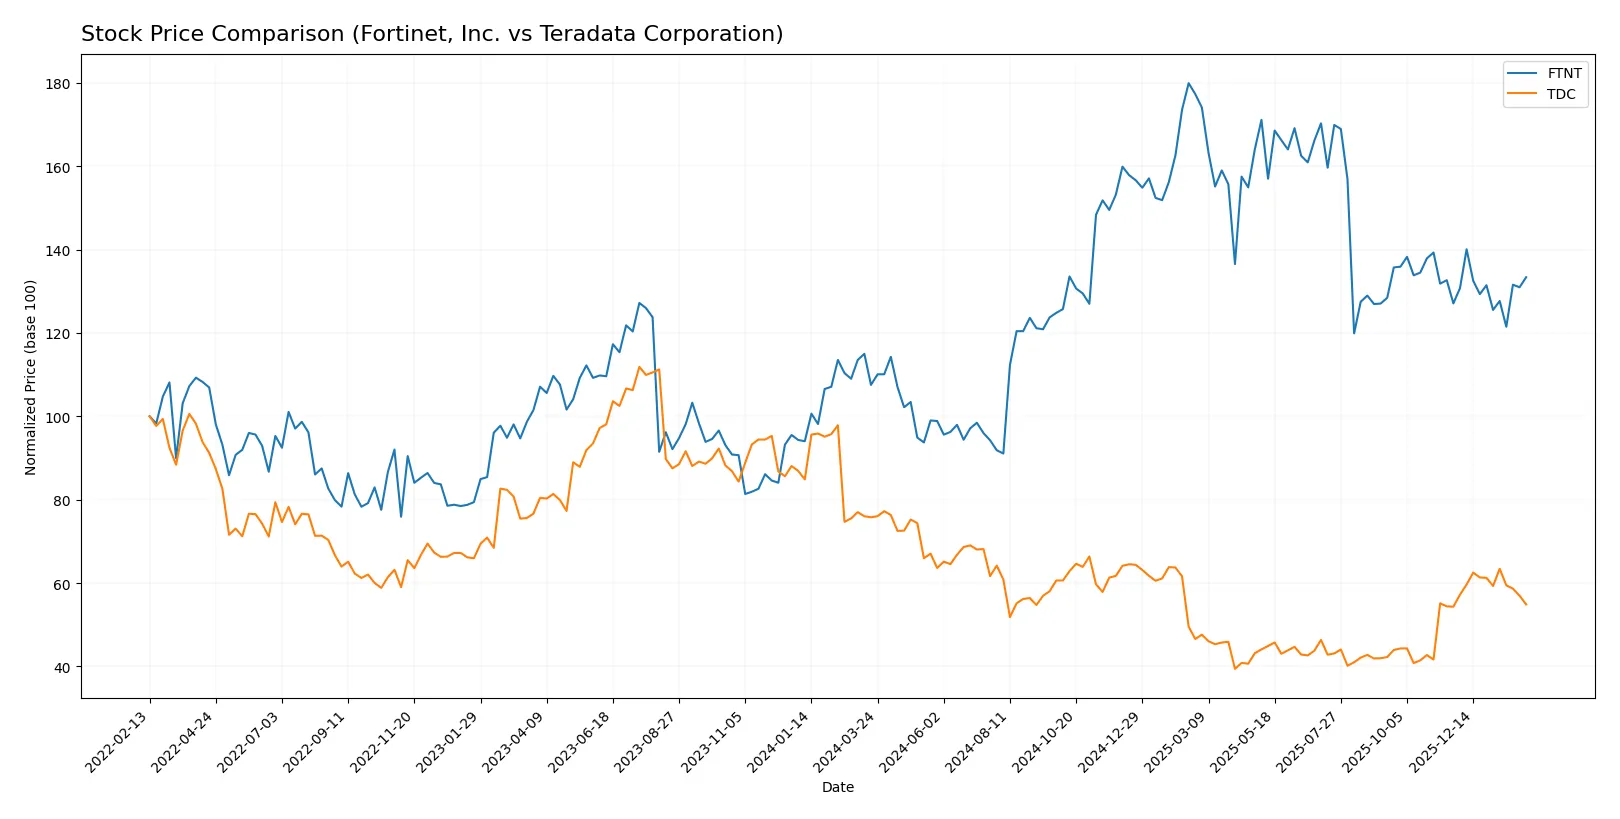
The past year shows Fortinet’s price rising sharply by 24%, while Teradata’s stock fell 28%, highlighting contrasting trading dynamics and momentum.
Trend Comparison
Fortinet, Inc. displays a bullish trend over 12 months with a 24.04% price gain but slowing momentum. Volatility is high with a 15.07% standard deviation, peaking at 111.64 and bottoming at 56.51.
Teradata Corporation suffers a bearish trend, dropping 27.6% in 12 months. The decline accelerates despite moderate volatility at 5.35%. The stock reached 38.67 at its high and 19.73 at its low.
Fortinet’s strong positive trend outperforms Teradata’s accelerated decline. Fortinet delivers superior market returns in this period.
Target Prices
Analysts show a constructive outlook with moderate upside potential for these software infrastructure firms.
| Company | Target Low | Target High | Consensus |
|---|---|---|---|
| Fortinet, Inc. | 70 | 90 | 85 |
| Teradata Corporation | 27 | 35 | 31 |
Fortinet’s consensus target of 85 slightly exceeds its current price of 82.76, signaling modest growth expectations. Teradata’s target consensus of 31 also suggests upside from its 27.47 price, reflecting cautious optimism.

Don’t Let Luck Decide Your Entry Point
Optimize your entry points with our advanced ProRealTime indicators. You’ll get efficient buy signals with precise price targets for maximum performance. Start outperforming now!
How do institutions grade them?
Fortinet, Inc. Grades
The following table summarizes recent grades assigned to Fortinet by reputable institutions:
| Grading Company | Action | New Grade | Date |
|---|---|---|---|
| Rosenblatt | maintain | Buy | 2026-02-06 |
| Mizuho | maintain | Underperform | 2026-02-06 |
| JP Morgan | maintain | Underweight | 2026-02-06 |
| RBC Capital | maintain | Sector Perform | 2026-02-06 |
| Wedbush | maintain | Outperform | 2026-02-06 |
| Scotiabank | downgrade | Sector Perform | 2026-02-02 |
| JP Morgan | maintain | Underweight | 2026-01-30 |
| Rosenblatt | upgrade | Buy | 2026-01-29 |
| TD Cowen | upgrade | Buy | 2026-01-23 |
| Citigroup | maintain | Neutral | 2026-01-13 |
Teradata Corporation Grades
Here is a summary of recent grades for Teradata from recognized grading firms:
| Grading Company | Action | New Grade | Date |
|---|---|---|---|
| Citigroup | maintain | Buy | 2026-02-04 |
| Barclays | maintain | Underweight | 2026-01-12 |
| RBC Capital | maintain | Sector Perform | 2026-01-05 |
| Morgan Stanley | maintain | Overweight | 2025-12-17 |
| Citizens | upgrade | Market Outperform | 2025-11-10 |
| Evercore ISI Group | maintain | Outperform | 2025-11-05 |
| Barclays | maintain | Underweight | 2025-11-05 |
| TD Cowen | maintain | Hold | 2025-11-05 |
| UBS | maintain | Neutral | 2025-08-06 |
| Guggenheim | maintain | Buy | 2025-05-07 |
Which company has the best grades?
Teradata consistently receives more positive ratings, including Buy, Outperform, and Overweight. Fortinet shows mixed opinions with several Underperform and Underweight grades. Teradata’s stronger consensus may signal greater investor confidence.
Risks specific to each company
The following categories identify the critical pressure points and systemic threats facing both firms in the 2026 market environment:
1. Market & Competition
Fortinet, Inc.
- Operates in a highly competitive cybersecurity sector with rapid innovation cycles and intense pricing pressure.
Teradata Corporation
- Faces strong competition in enterprise analytics and multi-cloud platforms, with shifting customer preferences.
2. Capital Structure & Debt
Fortinet, Inc.
- Maintains low debt levels (D/E 0.81) and strong interest coverage (113x), signaling solid financial stability.
Teradata Corporation
- Exhibits high leverage (D/E 4.33) and moderate interest coverage (6.66x), increasing financial risk.
3. Stock Volatility
Fortinet, Inc.
- Beta near 1.05 suggests moderate volatility aligned with the tech sector average.
Teradata Corporation
- Lower beta at 0.54 indicates relative stock stability but potentially less market upside.
4. Regulatory & Legal
Fortinet, Inc.
- Subject to cybersecurity regulations globally; evolving compliance requirements may increase costs.
Teradata Corporation
- Faces data privacy and cloud compliance regulations; risk from regulatory changes in multiple jurisdictions.
5. Supply Chain & Operations
Fortinet, Inc.
- Relies on hardware components; supply chain disruptions could impact product delivery and costs.
Teradata Corporation
- Primarily software and cloud-based; operational risks center on service reliability and cloud migration execution.
6. ESG & Climate Transition
Fortinet, Inc.
- Increasing pressure to enhance ESG disclosures and reduce environmental footprint amid global cybersecurity demand.
Teradata Corporation
- Growing focus on sustainable cloud infrastructure and responsible data practices; ESG integration remains a challenge.
7. Geopolitical Exposure
Fortinet, Inc.
- Global footprint exposes it to geopolitical tensions affecting technology supply and cross-border data flows.
Teradata Corporation
- International operations face risks from trade policies and geopolitical instability, especially in Asia-Pacific.
Which company shows a better risk-adjusted profile?
Fortinet’s strongest risk is market competition amid fast innovation and regulatory complexity, but its low leverage and robust interest coverage mitigate financial risks. Teradata’s critical vulnerability lies in high leverage, placing it in financial distress per Altman Z-Score. Despite strong operational scores, Teradata’s capital structure risks overshadow resilience. Fortinet’s risk-adjusted profile appears stronger, supported by safer financial footing and a diversified product portfolio. Recent data showing Teradata’s Altman Z-Score in the distress zone underscores my concern over its solvency risk.
Final Verdict: Which stock to choose?
Fortinet’s superpower lies in its ability to generate exceptional returns on invested capital, consistently outpacing its cost of capital. This cash-generating prowess fuels its aggressive growth trajectory. However, investors should watch its stretched valuation multiples, which could temper near-term upside. Fits best in an Aggressive Growth portfolio focused on innovation leaders.
Teradata offers a strategic moat through its recurring revenue model and efficient asset turnover. Compared to Fortinet, it presents a more stable, value-oriented profile but with slower growth and a weaker liquidity position. It suits a GARP (Growth at a Reasonable Price) investor seeking steady income with moderate risk.
If you prioritize high-growth potential and economic moat strength, Fortinet outshines with superior value creation and robust profitability. However, if you seek better stability and attractive free cash flow yields at a lower valuation, Teradata offers a compelling alternative despite its recent bearish trend. Both present distinct analytical scenarios depending on your risk tolerance and portfolio goals.
Disclaimer: Investment carries a risk of loss of initial capital. The past performance is not a reliable indicator of future results. Be sure to understand risks before making an investment decision.
Go Further
I encourage you to read the complete analyses of Fortinet, Inc. and Teradata Corporation to enhance your investment decisions: