Home > Comparison > Technology > SNPS vs FTNT
The strategic rivalry between Synopsys, Inc. and Fortinet, Inc. shapes the evolution of the technology infrastructure sector. Synopsys operates as a capital-intensive software provider specializing in electronic design automation, while Fortinet delivers high-margin, integrated cybersecurity solutions. This head-to-head focuses on a clash between deep technical innovation and broad security platform dominance. This analysis will identify which company presents superior risk-adjusted potential for a diversified portfolio in 2026.
Table of contents
Companies Overview
Synopsys and Fortinet stand as pivotal players in the software infrastructure landscape, each commanding substantial market influence.
Synopsys, Inc.: Electronics Design Automation Leader
Synopsys dominates electronic design automation, generating revenue through its Fusion Design Platform and Verification Continuum tools. Its core competitive advantage lies in comprehensive IP solutions for SoC infrastructure and security IP products. In 2026, Synopsys focuses strategically on expanding virtual prototyping and FPGA-based systems to improve integrated circuit design efficiency.
Fortinet, Inc.: Cybersecurity Solutions Powerhouse
Fortinet leads in integrated cybersecurity, earning revenue via its FortiGate hardware and software licenses. Its market strength is anchored in broad security functions like firewall, intrusion prevention, and endpoint protection. The company’s 2026 strategy emphasizes automated, scalable security solutions and expansion across global telecom, government, and healthcare sectors through channel partnerships.
Strategic Collision: Similarities & Divergences
Both firms operate in software infrastructure but diverge sharply in focus: Synopsys is a closed ecosystem for chip design, while Fortinet offers an open, integrated cybersecurity platform. Their primary battleground is technological innovation to secure market leadership in their niches. Synopsys appeals to capital-intensive semiconductor design, whereas Fortinet attracts growth-driven cybersecurity investors seeking broad exposure.
Income Statement Comparison
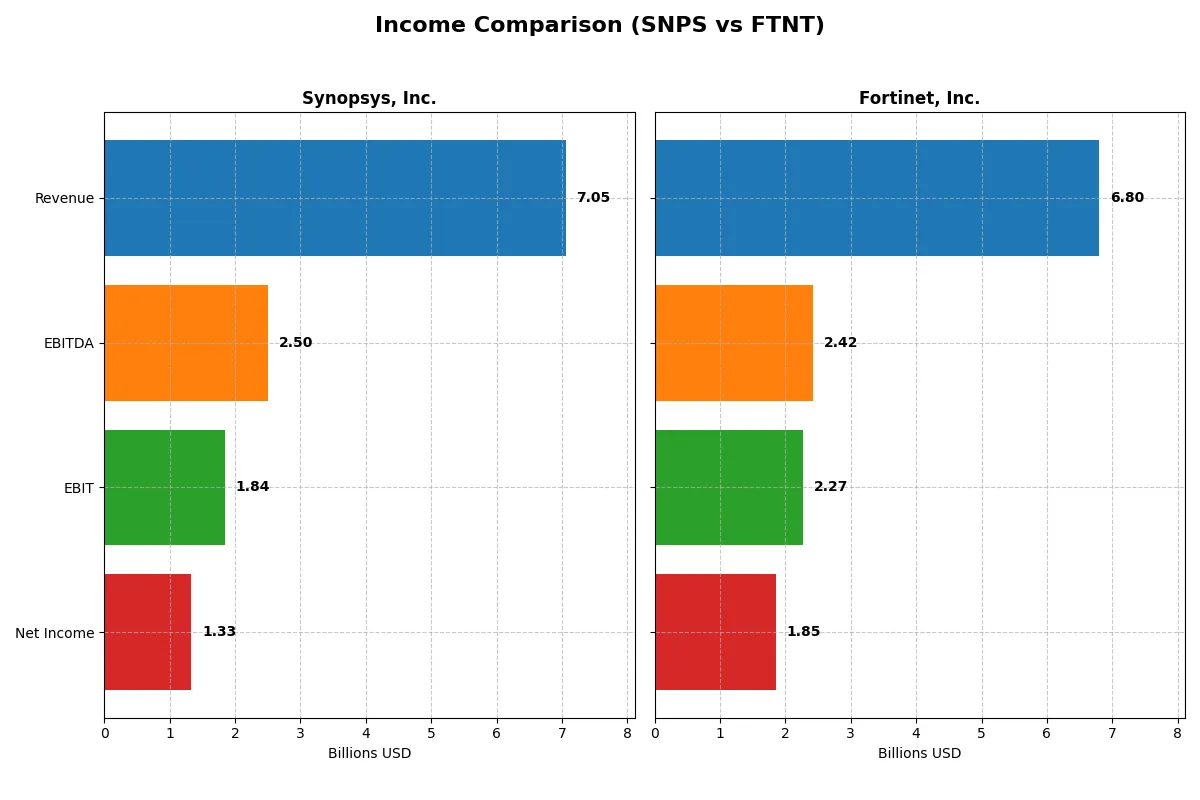
This data dissects the core profitability and scalability of both corporate engines to reveal who dominates the bottom line:
| Metric | Synopsys, Inc. (SNPS) | Fortinet, Inc. (FTNT) |
|---|---|---|
| Revenue | 7.05B | 6.80B |
| Cost of Revenue | 1.62B | 1.30B |
| Operating Expenses | 4.52B | 3.42B |
| Gross Profit | 5.43B | 5.50B |
| EBITDA | 2.50B | 2.42B |
| EBIT | 1.84B | 2.27B |
| Interest Expense | 447M | 20M |
| Net Income | 1.33B | 1.85B |
| EPS | 8.13 | 2.44 |
| Fiscal Year | 2025 | 2025 |
Income Statement Analysis: The Bottom-Line Duel
The following income statement comparison reveals the true efficiency and profitability of Synopsys and Fortinet’s corporate engines over recent years.
Synopsys, Inc. Analysis
Synopsys grew revenue from 4.2B in 2021 to 7.1B in 2025, a 68% rise, with net income up 76% overall. Gross margins remain strong near 77%, and EBIT margin at 26%, signaling solid profitability. However, net margin dipped nearly 49% in 2025, reflecting rising operating expenses and a one-year EPS decline, suggesting some margin pressure despite revenue momentum.
Fortinet, Inc. Analysis
Fortinet doubled revenue over five years, reaching 6.8B in 2025, and net income surged 205%, powered by a robust gross margin above 80%. EBIT margin expanded to 33%, with net margin holding at 27%, outperforming Synopsys on profitability. Operational efficiency improved with controlled expenses and a 7.5% EPS growth in 2025, underscoring strong earnings momentum and margin expansion.
Margin Power vs. Revenue Scale
Fortinet’s superior margin expansion and sharper net income growth clearly outpace Synopsys, despite both companies growing revenue significantly. Fortinet’s higher profitability and operational efficiency make it the fundamental winner in this comparison. Investors seeking stronger margin leverage and EPS growth may favor Fortinet’s profile over Synopsys’s scale-driven gains.
Financial Ratios Comparison
These vital ratios act as a diagnostic tool to expose the underlying fiscal health, valuation premiums, and capital efficiency of the companies compared below:
| Ratios | Synopsys, Inc. (SNPS) | Fortinet, Inc. (FTNT) |
|---|---|---|
| ROE | 4.7% | 150.0% |
| ROIC | 2.0% | 28.8% |
| P/E | 54.6 | 32.5 |
| P/B | 2.57 | 48.64 |
| Current Ratio | 1.62 | 1.17 |
| Quick Ratio | 1.52 | 1.09 |
| D/E | 0.50 | 0.81 |
| Debt-to-Assets | 29.6% | 9.6% |
| Interest Coverage | 2.0 | 103.7 |
| Asset Turnover | 0.15 | 0.65 |
| Fixed Asset Turnover | 5.04 | 4.20 |
| Payout Ratio | 0 | 0 |
| Dividend Yield | 0 | 0 |
| Fiscal Year | 2025 | 2025 |
Efficiency & Valuation Duel: The Vital Signs
Financial ratios act as the company’s DNA, revealing hidden risks and operational excellence that shape investor confidence and valuation.
Synopsys, Inc.
Synopsys posts a modest ROE of 4.7% and a strong net margin near 19%, but its high P/E of 54.6 signals an expensive valuation. The company remains operationally stretched with low ROIC versus WACC. Without dividends, it prioritizes heavy R&D investment, fueling growth potential but limiting immediate shareholder returns.
Fortinet, Inc.
Fortinet delivers an outstanding ROE of 150% and a robust net margin of 27.3%, highlighting operational efficiency. Its P/E of 32.5 is high but more reasonable than Synopsys’s. Fortinet’s reinvestment supports growth, evidenced by solid free cash flow, while it lacks dividends. The firm’s balance sheet strength and interest coverage bolster its risk profile.
Premium Valuation vs. Operational Strength
Fortinet offers a better balance, combining high profitability with more reasonable valuation multiples and superior cash flow metrics. Synopsys appears overvalued and operationally challenged despite strong margins. Investors seeking growth with operational safety may prefer Fortinet’s profile, while risk-tolerant investors might consider Synopsys’s innovation focus.
Which one offers the Superior Shareholder Reward?
I observe Synopsys (SNPS) and Fortinet (FTNT) both forgo dividends, focusing on reinvestment and buybacks to reward shareholders. Synopsys shows zero dividend yield and payout but boasts strong free cash flow of 8.4/share in 2025. Fortinet also pays no dividend, with a lower free cash flow of 2.9/share. Both execute share buybacks, but Synopsys’s healthier balance sheet and superior free cash flow coverage suggest more sustainable capital allocation. Fortinet’s higher leverage (debt/equity 0.81 vs. SNPS’s 0.50) raises risk. I conclude Synopsys offers a more attractive total return profile in 2026, balancing reinvestment and buybacks with prudent financial health.
Comparative Score Analysis: The Strategic Profile
The radar chart reveals the fundamental DNA and trade-offs of Synopsys, Inc. and Fortinet, Inc., highlighting their financial strengths and valuation dynamics:
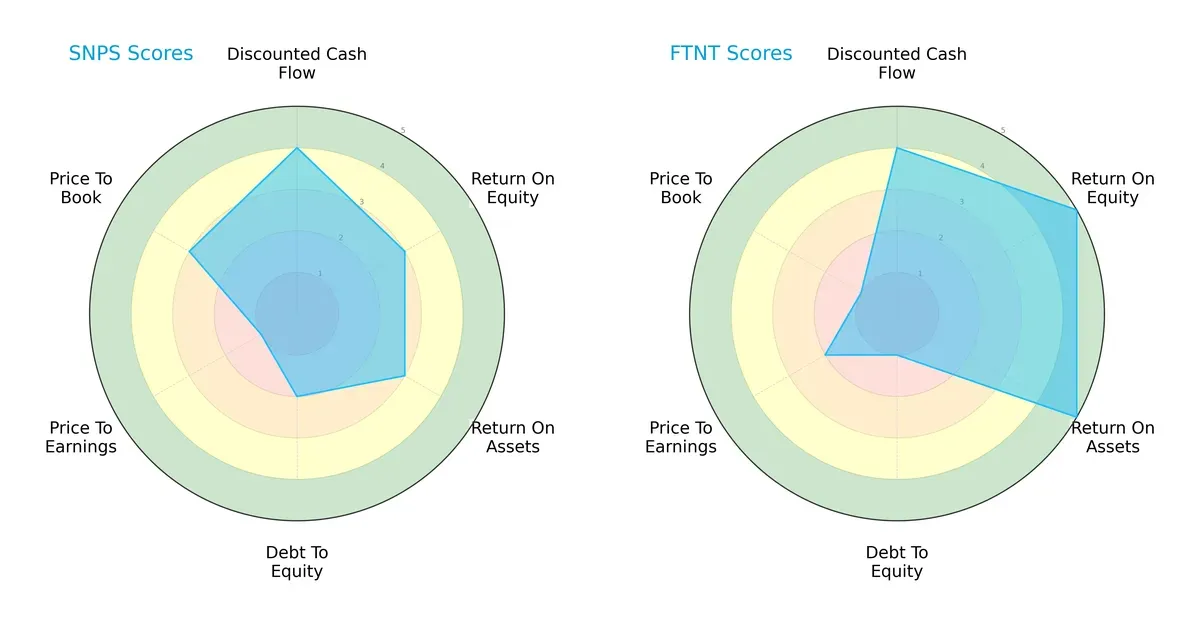
Fortinet excels in profitability, with very favorable ROE and ROA scores of 5 each, compared to Synopsys’s moderate 3 scores. Both score equally on discounted cash flow (4), indicating similar future cash flow expectations. Synopsys has a better debt profile (score 2 vs. 1 for Fortinet), signaling lower financial risk. Valuation metrics favor Synopsys modestly in price-to-book (3 vs. 1), but Fortinet edges slightly in price-to-earnings (2 vs. 1). Overall, Fortinet leans on operational efficiency, while Synopsys maintains a more balanced but modest profile.
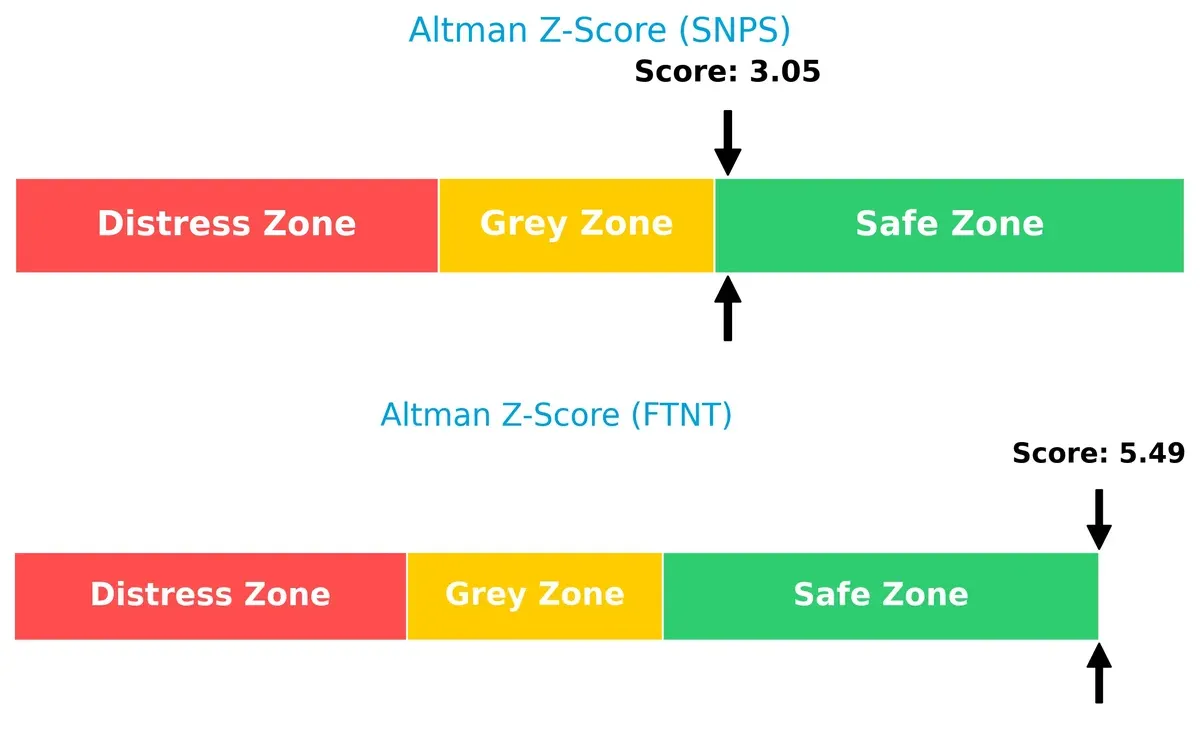
Bankruptcy Risk: Solvency Showdown
Fortinet’s Altman Z-Score of 5.49 significantly outpaces Synopsys’s 3.05, indicating a stronger buffer against bankruptcy risks in this economic cycle:
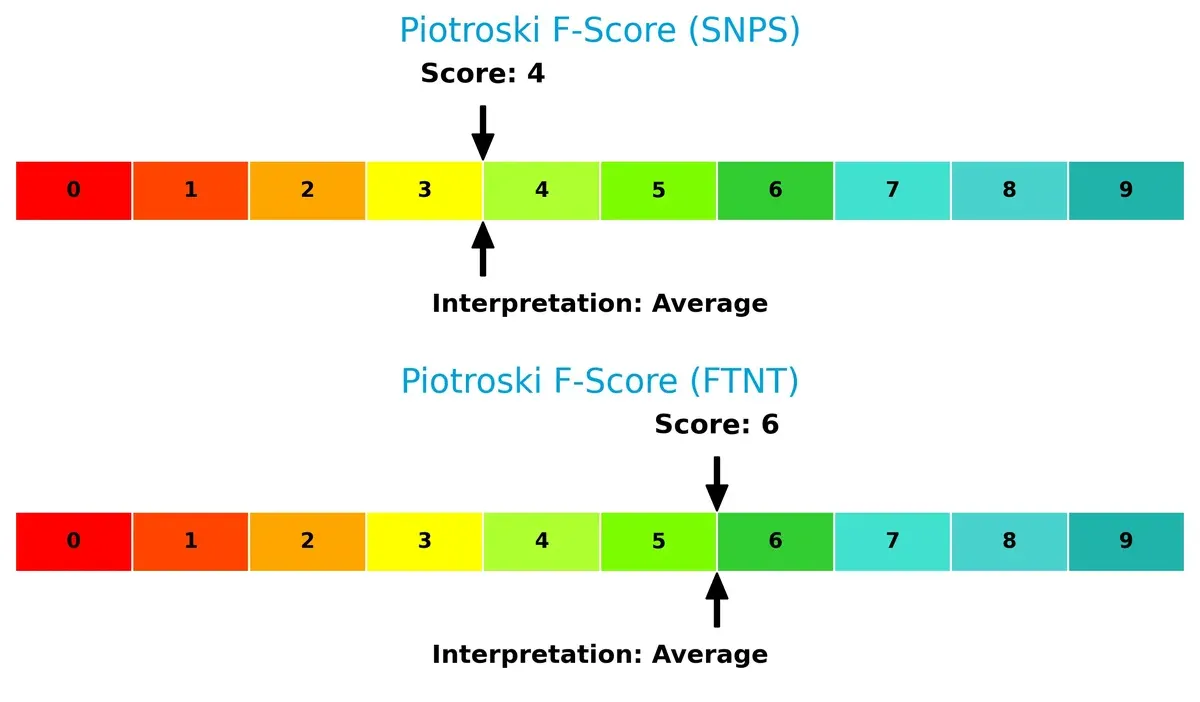
Financial Health: Quality of Operations
Fortinet’s Piotroski F-Score of 6 surpasses Synopsys’s score of 4, suggesting Fortinet maintains healthier internal financial conditions and fewer operational red flags:
How are the two companies positioned?
This section dissects the operational DNA of Synopsys and Fortinet by comparing their revenue distribution and internal dynamics, including strengths and weaknesses. The goal is to confront their economic moats to identify which model offers the most resilient competitive advantage today.
Revenue Segmentation: The Strategic Mix
This visual comparison dissects how Synopsys, Inc. and Fortinet, Inc. diversify their income streams and reveals their primary sector bets:
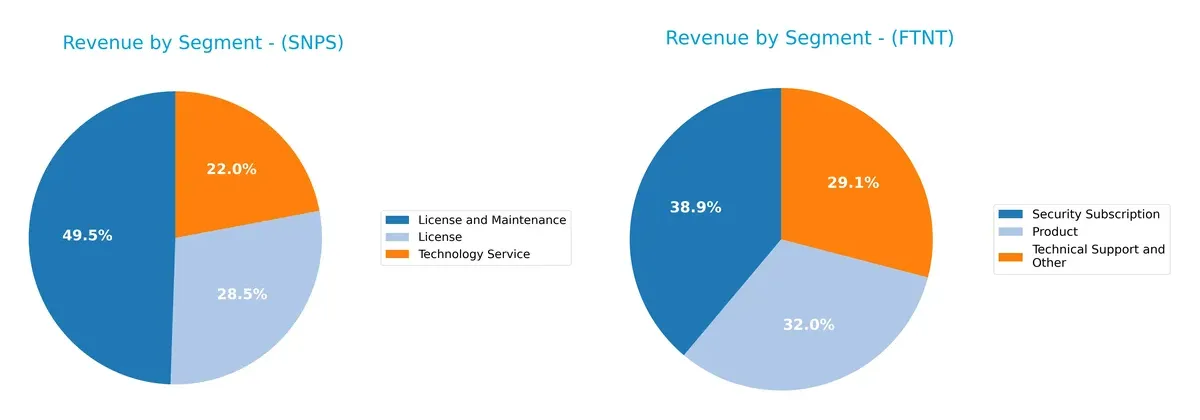
Synopsys anchors revenue in License and Maintenance at $3.49B, with Technology Service contributing $1.55B, showing moderate diversification within software services. Fortinet pivots around Security Subscription at $2.32B and Product at $1.91B, with Technical Support adding $1.73B, reflecting a balanced mix. Synopsys’s reliance on licensing suggests ecosystem lock-in, while Fortinet’s spread reduces concentration risk amid evolving cybersecurity demands.
Strengths and Weaknesses Comparison
This table compares the strengths and weaknesses of Synopsys, Inc. and Fortinet, Inc.:
Synopsys Strengths
- Diverse revenue streams including License, Maintenance, and Technology Services
- Strong global presence with significant US and Asia sales
- Favorable current and quick ratios indicate solid liquidity
- Moderate debt-to-assets ratio supports financial stability
Fortinet Strengths
- High profitability with superior net margin, ROE, and ROIC
- Balanced revenue from Products, Security Subscriptions, and Support
- Strong global footprint across Americas, EMEA, and Asia-Pacific
- Excellent interest coverage ratio signals strong debt service capacity
Synopsys Weaknesses
- Low ROE and ROIC below WACC suggest weak capital efficiency
- High P/E ratio indicates potential overvaluation risk
- Asset turnover is low, pointing to inefficient asset use
- No dividend yield limits income appeal for some investors
Fortinet Weaknesses
- Very high PB ratio reveals possible market overvaluation
- Slightly unfavorable P/E ratio compared to peers
- Current ratio is only neutral, implying tighter short-term liquidity
- No dividend yield may deter income-focused investors
Synopsys shows balanced liquidity and a diversified product base but struggles with capital returns and valuation metrics. Fortinet excels in profitability and debt management but faces valuation and liquidity concerns. Both companies lack dividend income, which may influence certain investor preferences.
The Moat Duel: Analyzing Competitive Defensibility
A structural moat is the only reliable barrier defending a company’s long-term profits from relentless competitive erosion:
Synopsys, Inc.: Intangible Assets Powerhouse
Synopsys leverages deep intangible assets like proprietary IP and design platforms. Despite strong margins, declining ROIC signals weakening capital efficiency in 2026. New markets could strain its moat further.
Fortinet, Inc.: Growing ROIC Security Fortress
Fortinet’s moat centers on integrated cybersecurity solutions with high switching costs. Its ROIC outpaces WACC by 20%, showing efficient capital use and expanding profitability, underpinning a robust competitive position.
Verdict: Intangible Assets vs. ROIC Excellence
Fortinet’s wide and expanding moat, demonstrated by strong ROIC growth, outmatches Synopsys’ shrinking capital returns. Fortinet stands better equipped to defend and grow its market share in 2026.
Which stock offers better returns?
The stock prices of Synopsys, Inc. and Fortinet, Inc. showed contrasting trends over the past 12 months, reflecting distinct trading dynamics and investor sentiment shifts.
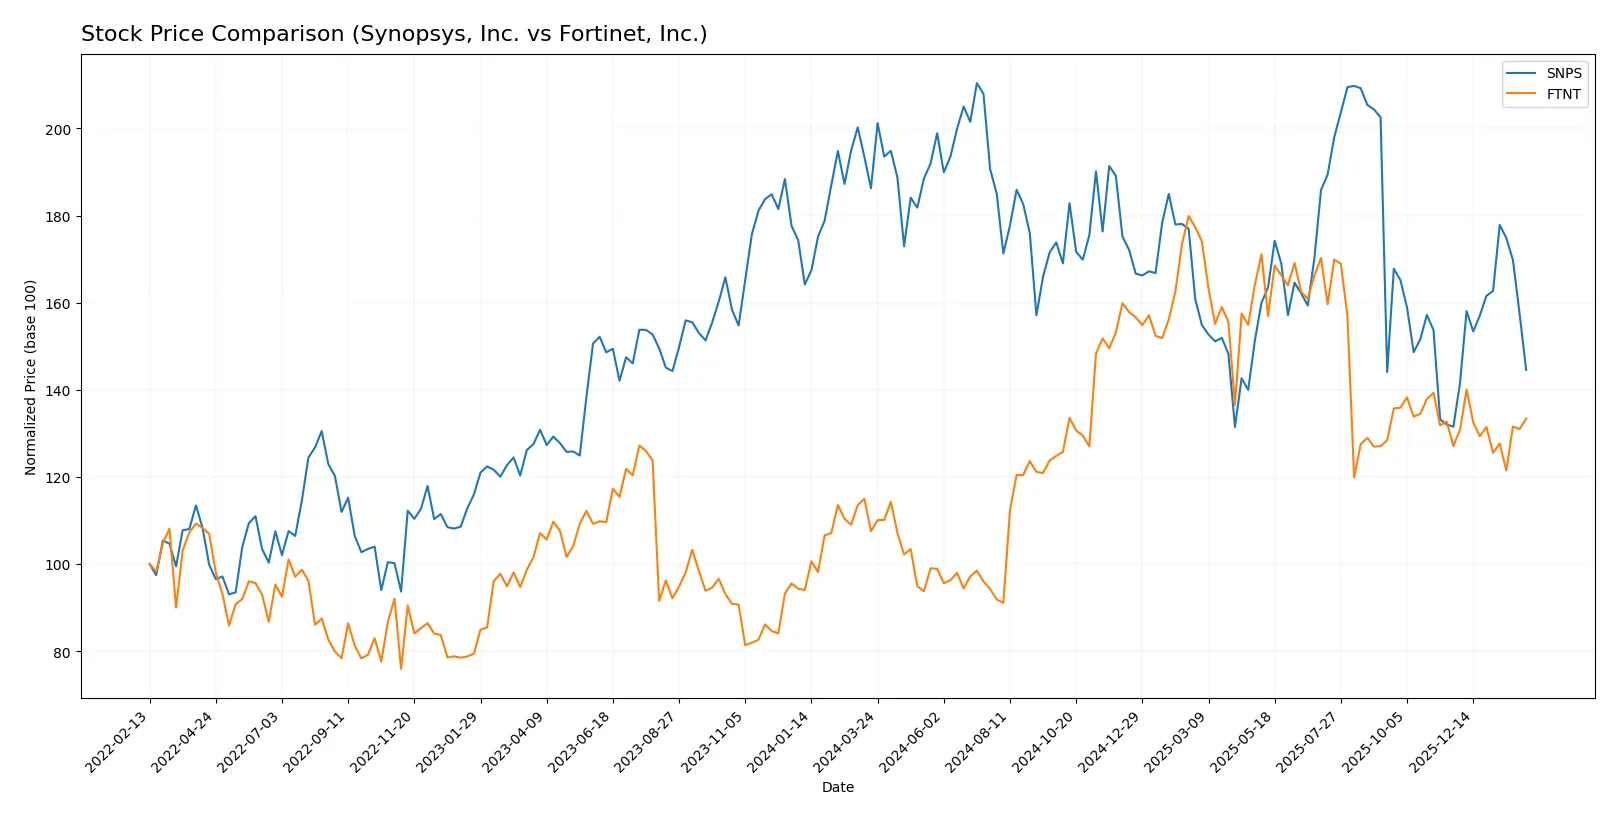
Trend Comparison
Synopsys, Inc. experienced a bearish trend over the past year, with a 22.39% price decline and accelerating downward momentum. Its price ranged between 388.13 and 621.3, showing significant volatility.
Fortinet, Inc. delivered a bullish trend over the same period, rising 24.04% with decelerating gains. Its price fluctuated from 56.51 to 111.64, exhibiting comparatively lower volatility.
Fortinet outperformed Synopsys with a robust positive return and a more stable upward trajectory over the last 12 months.
Target Prices
Analysts present a clear upward outlook for Synopsys, Inc. and Fortinet, Inc., reflecting confidence in their growth prospects.
| Company | Target Low | Target High | Consensus |
|---|---|---|---|
| Synopsys, Inc. | 425 | 600 | 530 |
| Fortinet, Inc. | 70 | 90 | 85 |
The consensus target for Synopsys at $530 suggests a 24% upside from the current $427 price. Fortinet’s $85 target implies modest 3% appreciation from $83, indicating near-term stability.

Don’t Let Luck Decide Your Entry Point
Optimize your entry points with our advanced ProRealTime indicators. You’ll get efficient buy signals with precise price targets for maximum performance. Start outperforming now!
How do institutions grade them?
Below is a summary of institutional grades for Synopsys, Inc. and Fortinet, Inc.:
Synopsys, Inc. Grades
This table lists recent institutional grades assigned to Synopsys, Inc.:
| Grading Company | Action | New Grade | Date |
|---|---|---|---|
| Piper Sandler | Downgrade | Neutral | 2026-01-13 |
| Morgan Stanley | Maintain | Overweight | 2025-12-12 |
| Wells Fargo | Maintain | Equal Weight | 2025-12-11 |
| JP Morgan | Maintain | Overweight | 2025-12-11 |
| Keybanc | Maintain | Overweight | 2025-12-11 |
| Piper Sandler | Maintain | Overweight | 2025-12-11 |
| B of A Securities | Upgrade | Buy | 2025-12-11 |
| Needham | Maintain | Buy | 2025-12-11 |
| Rosenblatt | Maintain | Buy | 2025-12-11 |
| Rosenblatt | Upgrade | Buy | 2025-12-09 |
Fortinet, Inc. Grades
This table summarizes recent institutional grades for Fortinet, Inc.:
| Grading Company | Action | New Grade | Date |
|---|---|---|---|
| Rosenblatt | Maintain | Buy | 2026-02-06 |
| Mizuho | Maintain | Underperform | 2026-02-06 |
| JP Morgan | Maintain | Underweight | 2026-02-06 |
| RBC Capital | Maintain | Sector Perform | 2026-02-06 |
| Wedbush | Maintain | Outperform | 2026-02-06 |
| Scotiabank | Downgrade | Sector Perform | 2026-02-02 |
| JP Morgan | Maintain | Underweight | 2026-01-30 |
| Rosenblatt | Upgrade | Buy | 2026-01-29 |
| TD Cowen | Upgrade | Buy | 2026-01-23 |
| Citigroup | Maintain | Neutral | 2026-01-13 |
Which company has the best grades?
Synopsys, Inc. holds a stronger overall rating with multiple “Buy” and “Overweight” grades from leading institutions. Fortinet, Inc. shows more mixed ratings, including “Underperform” and “Underweight” alongside some “Buy” grades. Investors may interpret Synopsys’s more consistent positive outlook as a sign of broader institutional confidence.
Risks specific to each company
The following categories identify critical pressure points and systemic threats facing Synopsys, Inc. and Fortinet, Inc. in the 2026 market environment:
1. Market & Competition
Synopsys, Inc.
- Faces intense competition in electronic design automation with high innovation demands.
Fortinet, Inc.
- Competes aggressively in cybersecurity with rapid technology evolution and strong rivals.
2. Capital Structure & Debt
Synopsys, Inc.
- Moderate leverage (debt-to-assets 29.64%), interest coverage neutral at 4.12x, signaling manageable debt risk.
Fortinet, Inc.
- Lower debt-to-assets (9.59%) and very strong interest coverage (113x), showing solid financial stability.
3. Stock Volatility
Synopsys, Inc.
- Beta 1.126 indicates slightly higher volatility than the market, moderate trading volume.
Fortinet, Inc.
- Beta 1.047 suggests volatility near market average, with significantly higher trading volume.
4. Regulatory & Legal
Synopsys, Inc.
- Subject to technology export controls and IP litigation risks in semiconductor sector.
Fortinet, Inc.
- Faces regulatory scrutiny on data privacy and cybersecurity compliance globally.
5. Supply Chain & Operations
Synopsys, Inc.
- Dependent on semiconductor ecosystem, vulnerable to chip shortages and manufacturing delays.
Fortinet, Inc.
- Relies on hardware and software supply chains, risk of component scarcity amid geopolitical tensions.
6. ESG & Climate Transition
Synopsys, Inc.
- ESG initiatives are emerging; climate risks tied to energy-intensive chip design processes.
Fortinet, Inc.
- Increasing focus on sustainable cybersecurity solutions; faces pressure to reduce carbon footprint.
7. Geopolitical Exposure
Synopsys, Inc.
- Exposure to US-China trade tensions affecting semiconductor exports.
Fortinet, Inc.
- Global operations expose it to varied geopolitical risks, especially in Asia-Pacific and EMEA regions.
Which company shows a better risk-adjusted profile?
Fortinet’s strongest risk factor is regulatory and geopolitical exposure due to its global cybersecurity footprint. Synopsys struggles most with supply chain risks amid semiconductor uncertainties. Fortinet’s superior capital structure and higher profitability yield a better risk-adjusted profile. Its Altman Z-Score of 5.49 versus Synopsys’s 3.05 confirms stronger financial safety. However, Fortinet’s extreme reliance on market valuations (high P/B) warrants caution.
Final Verdict: Which stock to choose?
Synopsys, Inc. leverages unmatched efficiency in R&D to fuel long-term innovation, making it a powerful engine for growth. Its point of vigilance lies in declining capital returns, signaling potential challenges in sustaining profitability. Synopsys suits portfolios focused on aggressive growth and technological leadership.
Fortinet, Inc. commands a strategic moat through its dominant cybersecurity platform and robust free cash flow generation. Compared to Synopsys, it offers better financial stability and a proven ability to create shareholder value consistently. Fortinet fits well within GARP portfolios seeking growth with reasonable risk management.
If you prioritize innovation-driven expansion with higher risk tolerance, Synopsys appears compelling for its growth potential despite value erosion concerns. However, if you seek durable competitive advantages and stronger capital efficiency, Fortinet outshines as a more stable choice with superior profitability metrics. Both present distinct analytical scenarios tailored to specific investor profiles.
Disclaimer: Investment carries a risk of loss of initial capital. The past performance is not a reliable indicator of future results. Be sure to understand risks before making an investment decision.
Go Further
I encourage you to read the complete analyses of Synopsys, Inc. and Fortinet, Inc. to enhance your investment decisions: