Home > Comparison > Technology > FTNT vs STNE
The strategic rivalry between Fortinet, Inc. and StoneCo Ltd. shapes the evolution of technology infrastructure. Fortinet operates as a cybersecurity powerhouse focused on integrated security solutions. StoneCo specializes in fintech, delivering payment and commerce platforms primarily in Brazil. This analysis pits Fortinet’s capital-light, high-security model against StoneCo’s growth-driven fintech approach. I will assess which trajectory offers the superior risk-adjusted return for a diversified portfolio in today’s dynamic tech landscape.
Table of contents
Companies Overview
Fortinet and StoneCo stand as pivotal players in the global software infrastructure landscape, each commanding distinct market niches.
Fortinet, Inc.: Cybersecurity Infrastructure Leader
Fortinet dominates the cybersecurity sector with its broad portfolio of integrated security solutions. It drives revenue through hardware and software licenses for firewalls, endpoint protection, and network management. In 2026, Fortinet prioritizes expanding its automated security services and enhancing its centralized management platforms to solidify its competitive edge.
StoneCo Ltd.: Financial Technology Innovator
StoneCo leads in Brazil’s fintech arena by providing electronic commerce solutions to small and medium businesses. Its core revenue stems from merchant services distributed via proprietary Stone Hubs and direct sales. The company’s strategic focus in 2026 centers on deepening its market penetration through hyper-localized service delivery and digital merchant integration.
Strategic Collision: Similarities & Divergences
Fortinet and StoneCo both leverage software infrastructure but diverge sharply in approach. Fortinet builds a closed ecosystem of cybersecurity tools, while StoneCo adopts an open, service-focused fintech model. Their battleground lies in securing and empowering digital commerce environments. Investors face contrasting profiles: Fortinet offers stability through enterprise security dominance; StoneCo presents growth potential tied to Brazil’s expanding digital economy.
Income Statement Comparison
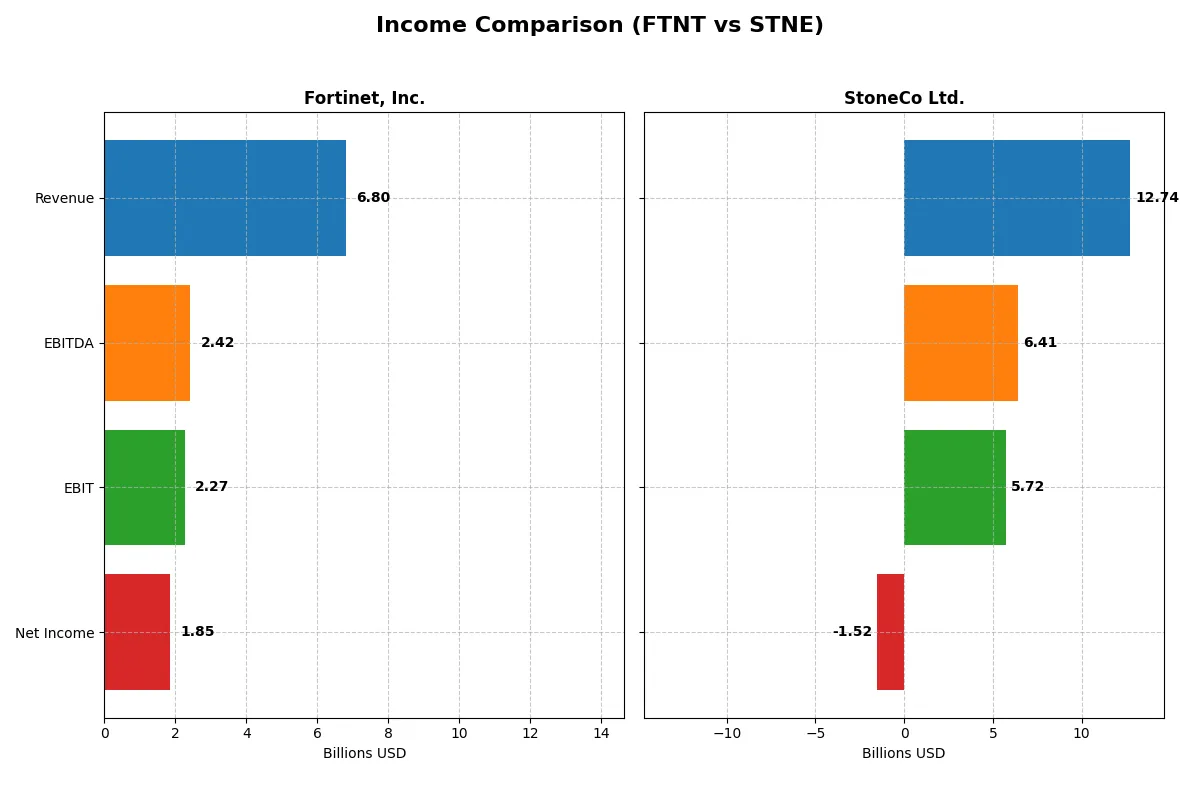
This data dissects the core profitability and scalability of both corporate engines to reveal who dominates the bottom line:
| Metric | Fortinet, Inc. (FTNT) | StoneCo Ltd. (STNE) |
|---|---|---|
| Revenue | 6.80B | 12.74B |
| Cost of Revenue | 1.30B | 3.39B |
| Operating Expenses | 3.42B | 3.47B |
| Gross Profit | 5.50B | 9.35B |
| EBITDA | 2.42B | 6.41B |
| EBIT | 2.27B | 5.72B |
| Interest Expense | 20M | 1.06B |
| Net Income | 1.85B | -1.52B |
| EPS | 2.44 | -5.02 |
| Fiscal Year | 2025 | 2024 |
Income Statement Analysis: The Bottom-Line Duel
This income statement comparison reveals which company operates with greater efficiency and profitability in their core business engines.
Fortinet, Inc. Analysis
Fortinet’s revenue doubled from 3.3B in 2021 to nearly 6.8B in 2025, with net income tripling to 1.85B. The company maintains robust margins, boasting an 80.8% gross margin and a 27.3% net margin in 2025. Despite a slight dip in net margin growth last year, Fortinet sustains strong operational momentum and disciplined cost control.
StoneCo Ltd. Analysis
StoneCo’s revenue surged over 300% from 3.2B BRL in 2020 to 12.7B BRL in 2024, reflecting rapid top-line expansion. However, profitability remains pressured, with a negative net margin of -11.9% in 2024 and a significant net income loss of -1.52B BRL. While gross and EBIT margins appear healthy, escalating interest expenses and net losses undermine overall efficiency.
Margin Discipline vs. Growth Ambition
Fortinet delivers consistent profitability with high margins and steady net income growth, establishing a clear fundamental edge. StoneCo impresses with explosive revenue growth but struggles to convert scale into profits, showing elevated risks. Investors seeking margin strength and bottom-line efficiency may favor Fortinet’s profile over StoneCo’s high-growth yet loss-making trajectory.
Financial Ratios Comparison
These vital ratios act as a diagnostic tool to expose the underlying fiscal health, valuation premiums, and capital efficiency of each company:
| Ratios | Fortinet, Inc. (FTNT) | StoneCo Ltd. (STNE) |
|---|---|---|
| ROE | 1.50 | -0.13 |
| ROIC | 0.29 | 0.22 |
| P/E | 32.48 | -9.84 |
| P/B | 48.64 | 1.27 |
| Current Ratio | 1.17 | 1.37 |
| Quick Ratio | 1.09 | 1.37 |
| D/E | 0.81 | 1.10 |
| Debt-to-Assets | 0.10 | 0.24 |
| Interest Coverage | 103.72 | 5.57 |
| Asset Turnover | 0.65 | 0.23 |
| Fixed Asset Turnover | 4.20 | 6.95 |
| Payout ratio | 0 | 0 |
| Dividend yield | 0 | 0 |
| Fiscal Year | 2025 | 2024 |
Efficiency & Valuation Duel: The Vital Signs
Financial ratios act as a company’s DNA, revealing hidden risks and operational excellence that raw numbers alone cannot convey.
Fortinet, Inc.
Fortinet’s core profitability impresses with a 150% ROE and a strong 27% net margin, signaling exceptional operational efficiency. The stock trades at a stretched 32.5 P/E and an elevated 48.6 P/B, reflecting high growth expectations. Without dividends, Fortinet reinvests heavily in R&D, fueling innovation and long-term value creation.
StoneCo Ltd.
StoneCo struggles with negative net margin and ROE at -12.9%, indicating profitability challenges despite a favorable 22.4% ROIC. The valuation appears attractive with a low 1.27 P/B and a negative P/E, suggesting market skepticism. StoneCo pays no dividends, likely prioritizing restructuring and growth to restore profitability.
Premium Profitability vs. Value Recovery
Fortinet commands a premium valuation justified by superior profitability and reinvestment in innovation. StoneCo offers a value play with operational headwinds but a solid capital return on invested capital. Investors seeking growth and operational strength may favor Fortinet, while those betting on turnaround potential might consider StoneCo’s discounted valuation.
Which one offers the Superior Shareholder Reward?
Fortinet and StoneCo both avoid dividends, prioritizing reinvestment and buybacks. Fortinet’s robust free cash flow (2.9B in 2025) funds steady buybacks, supporting shareholder value with zero payout risk. StoneCo’s negative free cash flow and net losses undermine buyback sustainability despite a lower valuation. I see Fortinet’s disciplined capital allocation and consistent cash generation as superior for long-term total returns in 2026.
Comparative Score Analysis: The Strategic Profile
The radar chart reveals the fundamental DNA and trade-offs of Fortinet, Inc. and StoneCo Ltd., highlighting their core financial strengths and weaknesses:
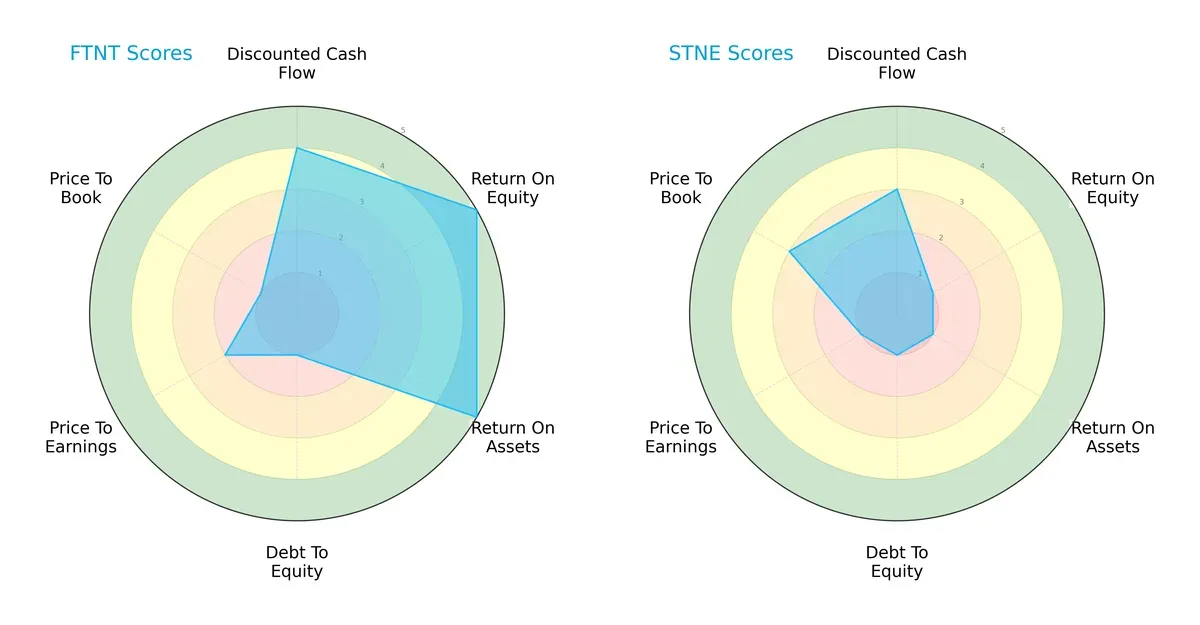
Fortinet exhibits strong profitability with high ROE (5) and ROA (5) scores, indicating efficient capital use. StoneCo lags significantly in these metrics (ROE 1, ROA 1), relying more on valuation metrics like Price-to-Book (3). Both firms share a weak debt-to-equity score (1), signaling high leverage risk. Fortinet offers a more balanced profile, leveraging operational efficiency, while StoneCo depends on selective valuation appeal.
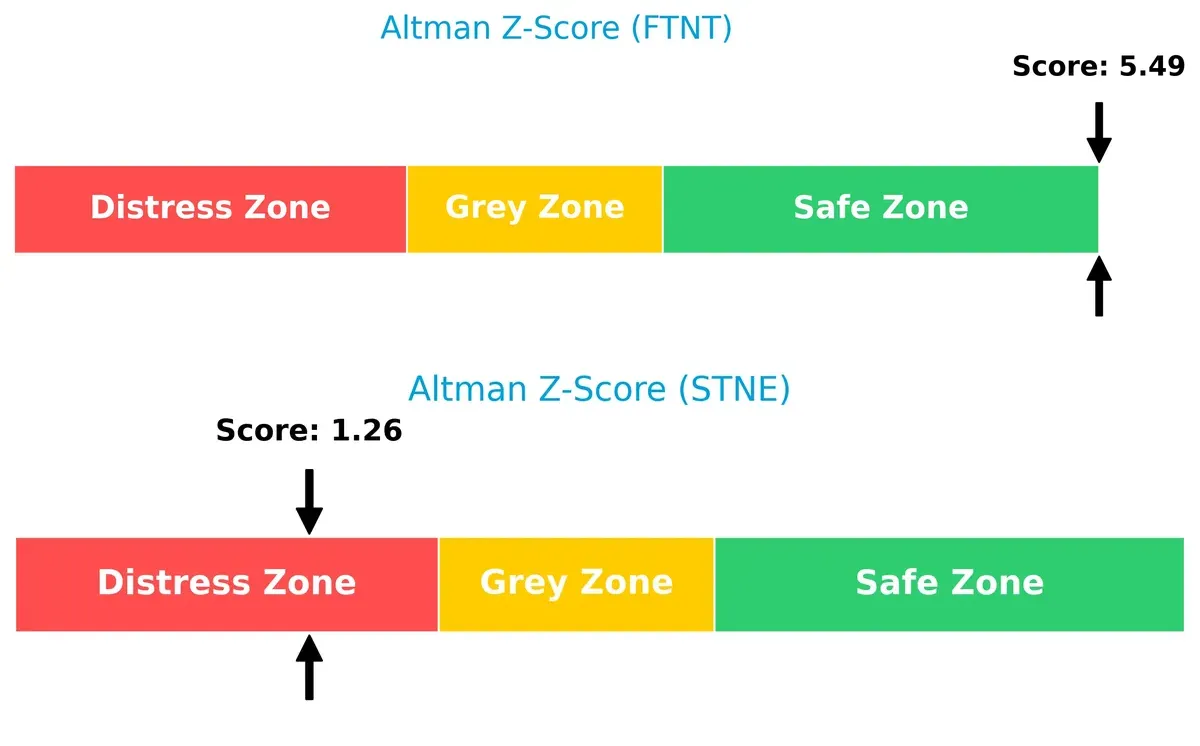
Bankruptcy Risk: Solvency Showdown
Fortinet’s Altman Z-Score of 5.49 places it comfortably in the safe zone, signaling robust long-term solvency. StoneCo’s 1.26 score flags a distress zone, implying elevated bankruptcy risk in this cycle:
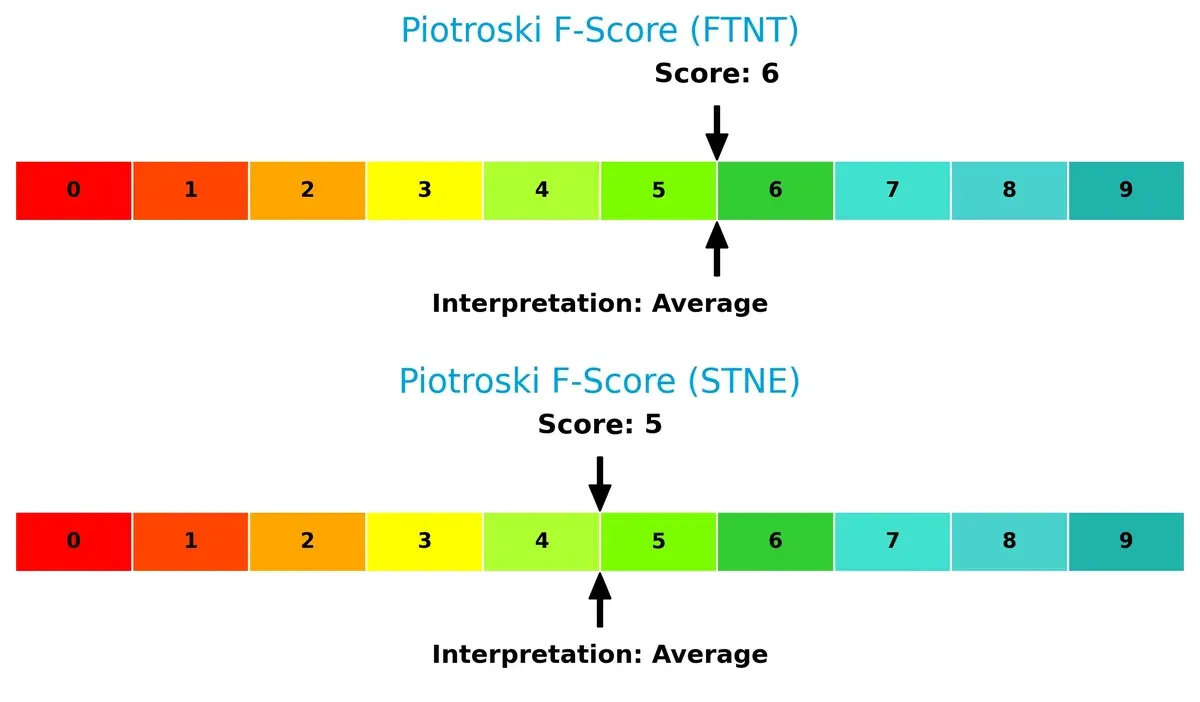
Financial Health: Quality of Operations
Both companies hold average Piotroski F-Scores, with Fortinet slightly ahead at 6 versus StoneCo’s 5. Neither shows alarming red flags, but Fortinet’s marginally better operational quality supports a stronger financial footing:
How are the two companies positioned?
This section dissects Fortinet and StoneCo’s operational DNA by comparing their revenue distribution and internal strengths and weaknesses. The goal is to confront their economic moats to reveal which model offers the most resilient, sustainable advantage today.
Revenue Segmentation: The Strategic Mix
The following visual comparison dissects how Fortinet, Inc. and StoneCo Ltd. diversify their income streams and where their primary sector bets lie:
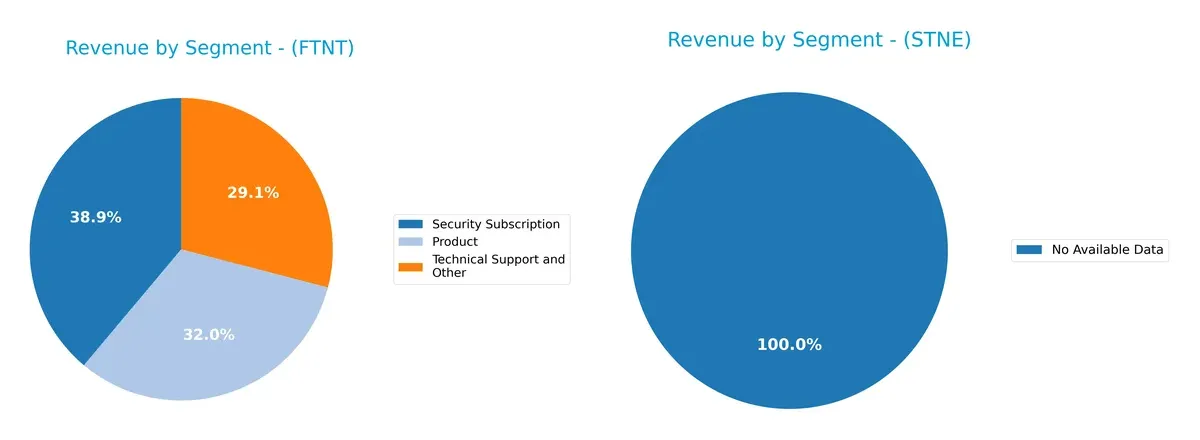
Fortinet, Inc. displays a balanced revenue mix with Security Subscription at $2.3B, Product at $1.9B, and Technical Support at $1.7B in 2024. This diversification reduces concentration risk and supports an ecosystem lock-in strategy. StoneCo Ltd. lacks available segment data, preventing direct comparison. Fortinet’s spread strengthens its infrastructure dominance, whereas reliance on a dominant segment would have indicated higher vulnerability.
Strengths and Weaknesses Comparison
This table compares the Strengths and Weaknesses of Fortinet, Inc. and StoneCo Ltd.:
Fortinet, Inc. Strengths
- Strong profitability with net margin 27.26% and ROE 149.77%
- Favorable ROIC of 28.76% above WACC 8.62%
- Low debt to assets at 9.59% with high interest coverage 113x
- Diversified revenue streams across products and services
- Solid global presence with significant revenues in Americas, EMEA, and Asia Pacific
StoneCo Ltd. Strengths
- Favorable ROIC of 22.41% indicating efficient capital allocation
- Low PB ratio at 1.27 supporting valuation attractiveness
- Favorable quick ratio 1.37 and interest coverage 5.41x
- Reasonable debt to assets at 23.53% with manageable leverage
- High fixed asset turnover 6.95 signals asset efficiency
Fortinet, Inc. Weaknesses
- High valuation multiples with PE 32.48 and PB 48.64 pose risk
- No dividend yield limits income investors
- Moderate current ratio 1.17 and asset turnover 0.65 indicate room for operational improvement
StoneCo Ltd. Weaknesses
- Negative net margin -11.89% and negative ROE -12.87% reflect unprofitability
- WACC 10.66% exceeds ROIC, signaling value destruction
- High debt to equity 1.1 raises financial risk
- Low asset turnover 0.23 suggests inefficiency
- Zero dividend yield reduces shareholder return
Fortinet’s strengths lie in profitability, low leverage, and global diversification, though stretched valuation is a caution. StoneCo shows efficient capital use but struggles with profitability and higher leverage, which could pressure its strategic options.
The Moat Duel: Analyzing Competitive Defensibility
A structural moat is the only true shield protecting long-term profits from relentless competitive erosion. Here’s how Fortinet and StoneCo stand:
Fortinet, Inc.: Integrated Cybersecurity Powerhouse
Fortinet’s moat stems from its broad, integrated cybersecurity platform, creating strong switching costs. This drives high ROIC above WACC by 20%, sustaining margin stability. Expansion into AI-driven security deepens this moat in 2026.
StoneCo Ltd.: Payment Ecosystem Lock-in
StoneCo’s moat relies on its payment ecosystem and hyper-local merchant relationships, generating network effects. Its ROIC also exceeds WACC by 12%, but negative net margins highlight profitability challenges. Growth in Brazil’s digital commerce offers expansion potential.
Integrated Security vs. Payment Network: The Moat Battle
Fortinet’s wider moat benefits from robust, diversified product lines and superior profitability metrics. StoneCo shows promise with its growing ROIC but faces margin headwinds. Fortinet remains better equipped to defend market share sustainably.
Which stock offers better returns?
The past year shows Fortinet’s stock rising 24%, with notable highs near 112 and a slowing upward momentum. StoneCo’s price declined slightly by 1.3%, despite recent acceleration and a rebound since late 2025.
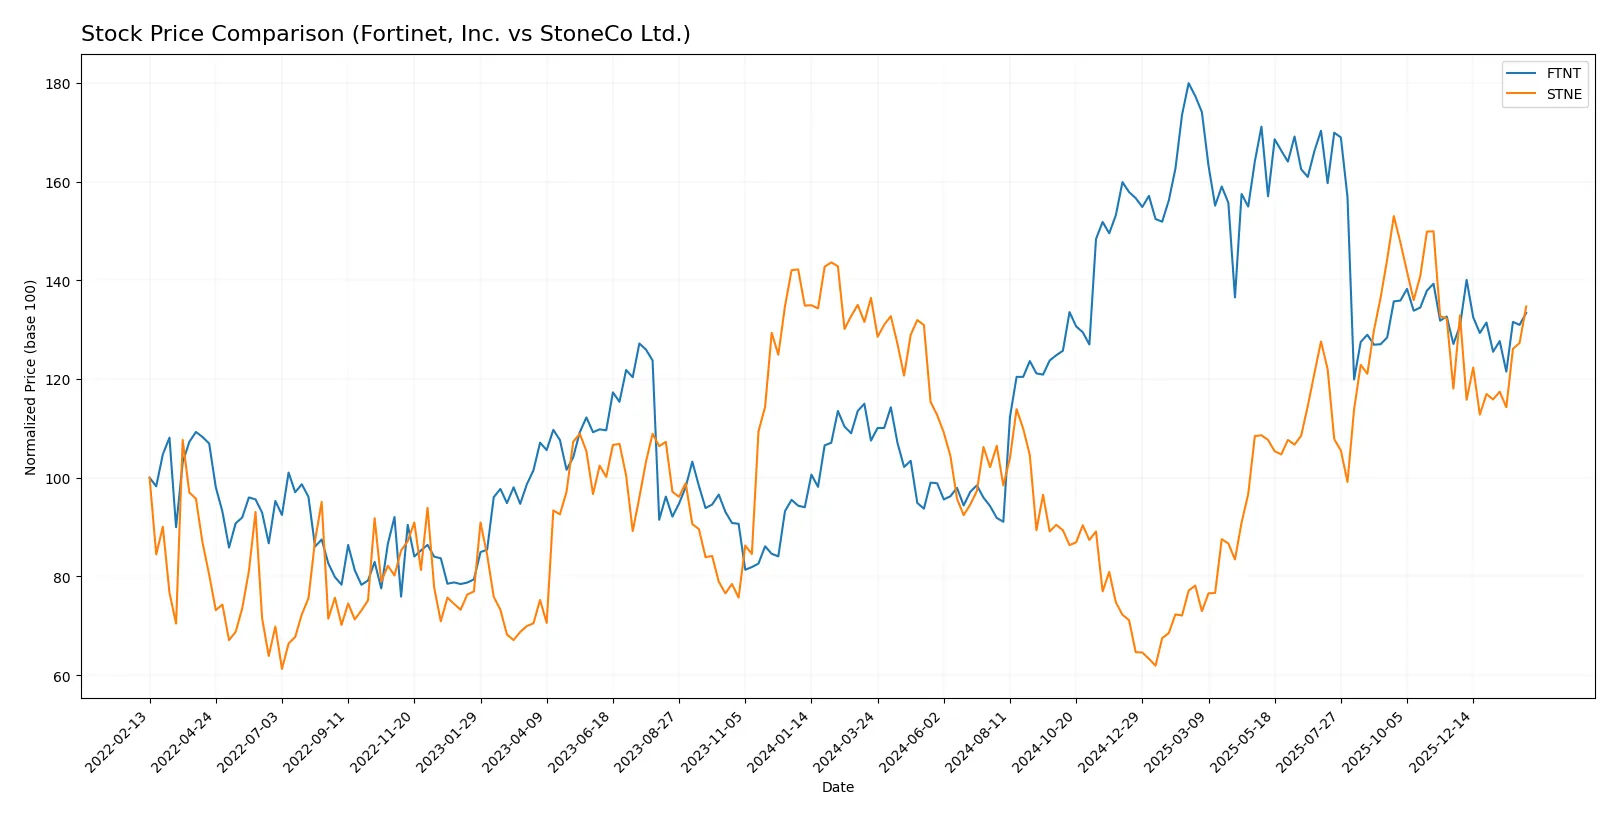
Trend Comparison
Fortinet’s stock gained 24.04% over the past 12 months, marking a bullish trend with decelerating momentum and high volatility (std dev 15.07). It peaked at 111.64 and bottomed at 56.51.
StoneCo’s stock fell 1.27% over the same period, indicating a bearish trend with accelerating momentum. The price ranged between 7.85 and 19.4, and volatility remained low (std dev 2.91).
Fortinet outperformed StoneCo with a strong bullish trend over 12 months, while StoneCo’s overall performance was slightly negative despite recent gains.
Target Prices
Analysts present a cautiously optimistic consensus for Fortinet, Inc. and StoneCo Ltd.
| Company | Target Low | Target High | Consensus |
|---|---|---|---|
| Fortinet, Inc. | 70 | 90 | 85 |
| StoneCo Ltd. | 19 | 21 | 19.83 |
Fortinet’s target consensus at 85 slightly exceeds its current 82.76 price, signaling moderate upside potential. StoneCo’s consensus near 19.83 suggests limited but positive gains above its 17.08 price.

Don’t Let Luck Decide Your Entry Point
Optimize your entry points with our advanced ProRealTime indicators. You’ll get efficient buy signals with precise price targets for maximum performance. Start outperforming now!
How do institutions grade them?
Fortinet, Inc. Grades
The following table lists recent grades from reliable financial institutions for Fortinet, Inc.:
| Grading Company | Action | New Grade | Date |
|---|---|---|---|
| Rosenblatt | Maintain | Buy | 2026-02-06 |
| Mizuho | Maintain | Underperform | 2026-02-06 |
| JP Morgan | Maintain | Underweight | 2026-02-06 |
| RBC Capital | Maintain | Sector Perform | 2026-02-06 |
| Wedbush | Maintain | Outperform | 2026-02-06 |
| Scotiabank | Downgrade | Sector Perform | 2026-02-02 |
| JP Morgan | Maintain | Underweight | 2026-01-30 |
| Rosenblatt | Upgrade | Buy | 2026-01-29 |
| TD Cowen | Upgrade | Buy | 2026-01-23 |
| Citigroup | Maintain | Neutral | 2026-01-13 |
StoneCo Ltd. Grades
Below is a summary of recent grades from established grading companies for StoneCo Ltd.:
| Grading Company | Action | New Grade | Date |
|---|---|---|---|
| UBS | Maintain | Buy | 2026-01-28 |
| Goldman Sachs | Maintain | Buy | 2026-01-28 |
| Goldman Sachs | Maintain | Buy | 2025-10-14 |
| B of A Securities | Maintain | Buy | 2025-09-09 |
| UBS | Maintain | Buy | 2025-08-29 |
| JP Morgan | Maintain | Overweight | 2025-07-16 |
| Barclays | Maintain | Equal Weight | 2025-05-12 |
| Barclays | Maintain | Equal Weight | 2025-04-23 |
| Citigroup | Upgrade | Buy | 2025-04-22 |
| Morgan Stanley | Maintain | Underweight | 2025-03-21 |
Which company has the best grades?
StoneCo Ltd. has consistently received Buy ratings from multiple top-tier firms, reflecting stronger institutional confidence. Fortinet’s ratings vary widely, from Buy to Underperform. Investors may interpret StoneCo’s more uniform Buy consensus as a sign of clearer market endorsement.
Risks specific to each company
The following categories identify critical pressure points and systemic threats facing Fortinet, Inc. and StoneCo Ltd. in the 2026 market environment:
1. Market & Competition
Fortinet, Inc.
- Strong cybersecurity market position but faces intensifying competition from peers and evolving cyber threats.
StoneCo Ltd.
- Operates in competitive Brazilian fintech with pressure from global players and local startups disrupting payment ecosystems.
2. Capital Structure & Debt
Fortinet, Inc.
- Moderate debt-to-equity (0.81) with strong interest coverage (113x), indicating sound debt management.
StoneCo Ltd.
- Higher leverage (D/E 1.1) increases financial risk despite adequate interest coverage (5.4x).
3. Stock Volatility
Fortinet, Inc.
- Beta near 1.05 signals average market volatility; relatively stable for tech sector standards.
StoneCo Ltd.
- Elevated beta at 1.79 implies higher stock volatility and sensitivity to market swings.
4. Regulatory & Legal
Fortinet, Inc.
- Subject to global cybersecurity regulations; compliance complexity grows with international operations.
StoneCo Ltd.
- Faces evolving Brazilian financial regulations and legal scrutiny in fintech sector, increasing compliance costs.
5. Supply Chain & Operations
Fortinet, Inc.
- Reliance on hardware and software supply chains could face disruption amid geopolitical tensions.
StoneCo Ltd.
- Operational risks tied to local infrastructure and technology adoption in emerging markets.
6. ESG & Climate Transition
Fortinet, Inc.
- Moderate ESG pressure; technology sector scrutiny on data privacy and energy consumption.
StoneCo Ltd.
- Increasing investor focus on ESG in Brazil; faces challenges in sustainable fintech growth and transparency.
7. Geopolitical Exposure
Fortinet, Inc.
- Broad global footprint exposes it to geopolitical risks, but diversification mitigates impact.
StoneCo Ltd.
- Concentrated exposure in Brazil and Latin America makes it vulnerable to regional instability and policy shifts.
Which company shows a better risk-adjusted profile?
Fortinet’s strongest risk lies in intensifying global competition and supply chain vulnerabilities but benefits from robust financial health and lower volatility. StoneCo faces significant challenges from high financial leverage, regional geopolitical risks, and operational dependencies. Its negative net margin and distress-level Altman Z-score amplify concerns. Fortinet’s safer balance sheet and moderate volatility give it a superior risk-adjusted profile in 2026. The sharp contrast in Altman Z-scores—5.49 safe zone for Fortinet versus 1.26 distress zone for StoneCo—justifies heightened caution on StoneCo’s financial stability.
Final Verdict: Which stock to choose?
Fortinet’s superpower lies in its robust economic moat, demonstrated by a high and growing ROIC that far exceeds its cost of capital. It efficiently converts invested capital into profits, making it a cash-generating machine with strong operational discipline. A point of vigilance remains its lofty valuation multiples, which could temper near-term upside. Fortinet fits well in an aggressive growth portfolio seeking durable competitive advantages.
StoneCo’s strategic moat is built on its niche in digital payments, offering recurring revenue streams that anchor its business model. While it shows promising ROIC growth, its profitability metrics and financial stability lag behind Fortinet’s, reflecting higher operational risks. StoneCo could appeal to GARP investors who tolerate volatility for potential value creation in emerging market fintech.
If you prioritize strong, sustainable profitability with a proven track record of value creation, Fortinet outshines StoneCo due to its superior capital efficiency and market position. However, if you seek exposure to emerging fintech growth and can weather volatility, StoneCo offers a differentiated opportunity with improving operational metrics. Each scenario aligns with distinct investor risk tolerance and growth expectations.
Disclaimer: Investment carries a risk of loss of initial capital. The past performance is not a reliable indicator of future results. Be sure to understand risks before making an investment decision.
Go Further
I encourage you to read the complete analyses of Fortinet, Inc. and StoneCo Ltd. to enhance your investment decisions: