Home > Comparison > Technology > PLTR vs FTNT
The strategic rivalry between Palantir Technologies Inc. and Fortinet, Inc. defines the current trajectory of the technology sector’s software infrastructure space. Palantir operates as a data analytics platform with a focus on intelligence and operational integration. Fortinet delivers broad cybersecurity solutions through hardware and software products. This analysis will assess which company’s operational model offers superior risk-adjusted returns for diversified portfolios amid evolving digital security demands.
Table of contents
Companies Overview
Palantir Technologies and Fortinet dominate the software infrastructure market with distinct strategic approaches and scale.
Palantir Technologies Inc.: Data-Driven Intelligence Platform
Palantir leads as a software platform provider focused on intelligence and data analytics. It generates revenue through its Gotham and Foundry platforms that integrate and analyze complex datasets. In 2026, Palantir emphasizes expanding its AI capabilities and deploying software virtually across diverse environments, reinforcing its position in government and enterprise sectors.
Fortinet, Inc.: Cybersecurity Infrastructure Powerhouse
Fortinet is a broad cybersecurity solutions provider offering hardware and software for network security and threat management. Its core revenue comes from FortiGate products and security subscriptions. In 2026, Fortinet concentrates on advancing integrated, automated cybersecurity services across multiple industries with an emphasis on scalable, centralized management solutions.
Strategic Collision: Similarities & Divergences
Palantir and Fortinet both operate in software infrastructure but diverge sharply in focus: Palantir centers on data intelligence and AI-driven insights, while Fortinet prioritizes network security and threat prevention. Their primary battleground lies in serving enterprise clients requiring secure, data-driven operations. These differences yield distinct investment profiles—Palantir bets on cutting-edge analytics, Fortinet on comprehensive cybersecurity defense.
Income Statement Comparison
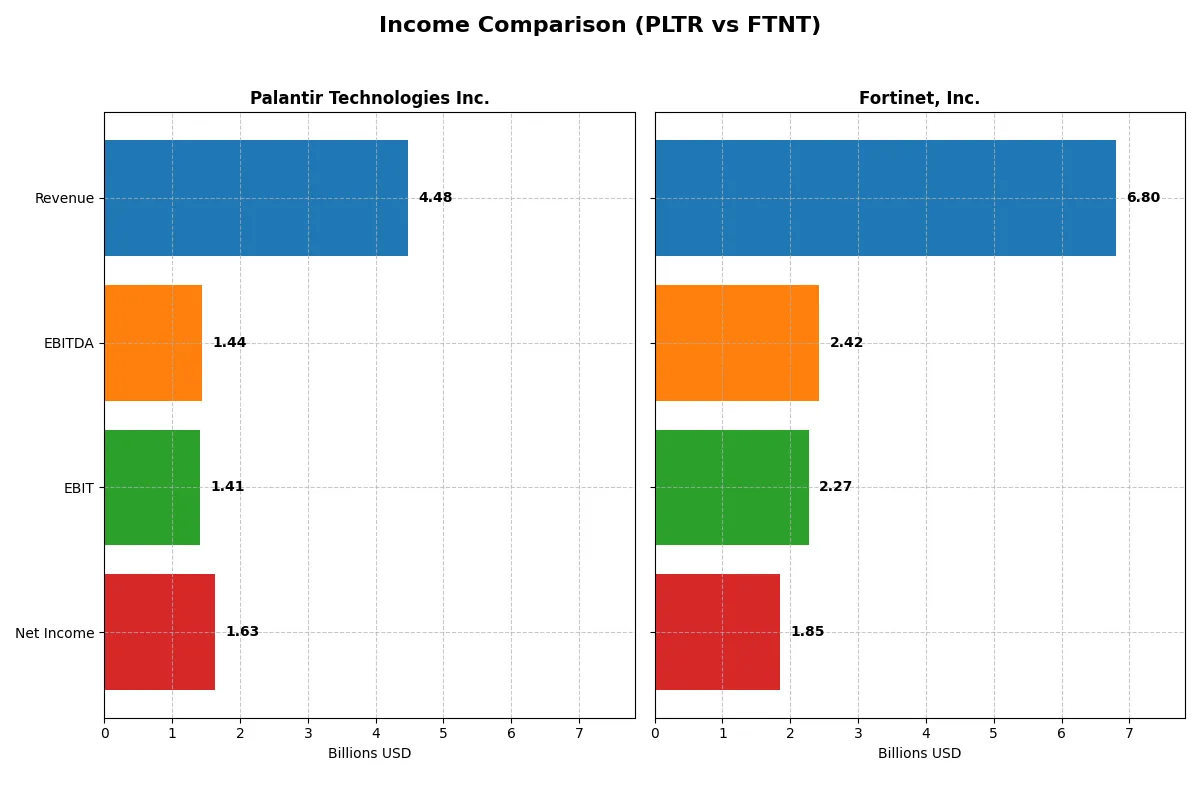
This data dissects the core profitability and scalability of both corporate engines to reveal who dominates the bottom line:
| Metric | Palantir Technologies Inc. (PLTR) | Fortinet, Inc. (FTNT) |
|---|---|---|
| Revenue | 4.48B | 6.80B |
| Cost of Revenue | 789M | 1.30B |
| Operating Expenses | 2.27B | 3.42B |
| Gross Profit | 3.69B | 5.50B |
| EBITDA | 1.44B | 2.42B |
| EBIT | 1.41B | 2.27B |
| Interest Expense | 0 | 20M |
| Net Income | 1.63B | 1.85B |
| EPS | 0.69 | 2.44 |
| Fiscal Year | 2025 | 2025 |
Income Statement Analysis: The Bottom-Line Duel
This income statement comparison reveals how efficiently each company converts revenue into sustainable profits and margin strength.
Palantir Technologies Inc. Analysis
Palantir’s revenue surged from 1.54B in 2021 to 4.48B in 2025, reflecting robust growth. Net income followed, rising sharply from a loss of 520M to a profit of 1.63B, signaling a clear turnaround. Palantir’s gross margin stands exceptionally high at 82.4%, with net margins expanding to 36.3%, showing impressive operational leverage and momentum in 2025.
Fortinet, Inc. Analysis
Fortinet grew revenue steadily from 3.34B in 2021 to nearly 6.8B in 2025, doubling over five years. Net income climbed from 607M to 1.85B, although net margin softened recently to 27.3%. Gross margin remains strong at 80.8%, while EBIT margin of 33.4% reflects solid expense control, but last year’s net margin decline signals some margin pressure.
Growth Surge vs. Margin Resilience
Palantir outpaces Fortinet in revenue and net income growth, with superior margin expansion driving profitability gains. Fortinet offers steadier revenue growth and higher EBIT margin but faces slight net margin erosion. Investors seeking rapid profit acceleration may prefer Palantir’s profile, while those valuing margin stability might favor Fortinet’s resilience.
Financial Ratios Comparison
These vital ratios act as a diagnostic tool to expose the underlying fiscal health, valuation premiums, and capital efficiency of these two technology firms:
| Ratios | Palantir Technologies Inc. (PLTR) | Fortinet, Inc. (FTNT) |
|---|---|---|
| ROE | 22.0% | 149.8% |
| ROIC | 17.9% | 28.8% |
| P/E | 259.2 | 32.5 |
| P/B | 57.0 | 48.6 |
| Current Ratio | 7.11 | 1.17 |
| Quick Ratio | 7.11 | 1.09 |
| D/E | 0.03 | 0.81 |
| Debt-to-Assets | 2.58% | 9.59% |
| Interest Coverage | 0 | 103.7 |
| Asset Turnover | 0.50 | 0.65 |
| Fixed Asset Turnover | 17.76 | 4.20 |
| Payout ratio | 0 | 0 |
| Dividend yield | 0 | 0 |
| Fiscal Year | 2025 | 2025 |
Efficiency & Valuation Duel: The Vital Signs
Ratios serve as a company’s financial DNA, uncovering hidden risks and highlighting operational strengths essential for investment insight.
Palantir Technologies Inc.
Palantir posts a strong 22% ROE and a robust 36.3% net margin, signaling solid profitability. Yet, its valuation is highly stretched, with a P/E of 259 and P/B above 57, reflecting significant market optimism. Palantir returns no dividends, instead reinvesting heavily in R&D to fuel growth initiatives.
Fortinet, Inc.
Fortinet exhibits exceptional profitability with a 150% ROE and a 27.3% net margin, demonstrating operational efficiency. Its valuation is more reasonable, with a P/E near 32 and P/B at 48.6, still elevated but far less extreme than Palantir. Like Palantir, it pays no dividend and focuses on growth through capital allocation to R&D.
Premium Valuation vs. Operational Safety
Palantir’s lofty valuation signals high growth expectations but carries valuation risk. Fortinet balances strong returns with a more moderate valuation and solid capital structure. Investors seeking growth with less valuation stretch may lean toward Fortinet’s profile, while Palantir fits those willing to accept premium pricing for innovation exposure.
Which one offers the Superior Shareholder Reward?
I observe Palantir Technologies Inc. (PLTR) and Fortinet, Inc. (FTNT) both skip dividends, focusing on reinvestment and buybacks. PLTR shows zero dividend yield and payout but generates robust free cash flow of $0.89 per share in 2025, fueling growth and buybacks. FTNT also pays no dividends but delivers strong free cash flow of $2.94 per share, supporting substantial buybacks. FTNT’s operating and free cash flow margins exceed PLTR’s, despite higher leverage and moderate liquidity. PLTR’s pristine balance sheet and sky-high valuation price-to-free-cash-flow (200x) raise sustainability concerns. I conclude FTNT offers a superior total shareholder reward in 2026, balancing cash flow, buybacks, and valuation prudence better than PLTR’s growth-at-any-cost model.
Comparative Score Analysis: The Strategic Profile
The radar chart reveals the fundamental DNA and trade-offs of Palantir Technologies Inc. and Fortinet, Inc., highlighting their strategic strengths and vulnerabilities:
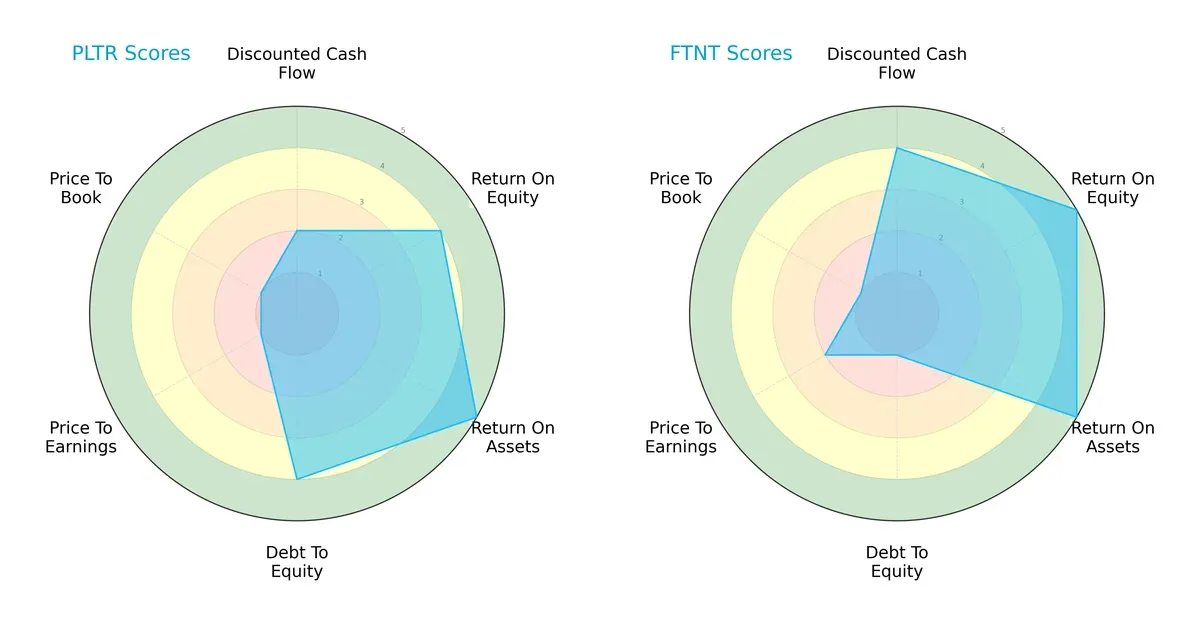
Palantir shows strength in ROA (5) and Debt/Equity (4), reflecting efficient asset use with moderate leverage. Fortinet excels with higher DCF (4) and ROE (5), signaling strong cash flow and profitability but carries heavier debt risk (Debt/Equity 1). Palantir’s profile is more balanced, while Fortinet relies heavily on profitability metrics despite financial risk.
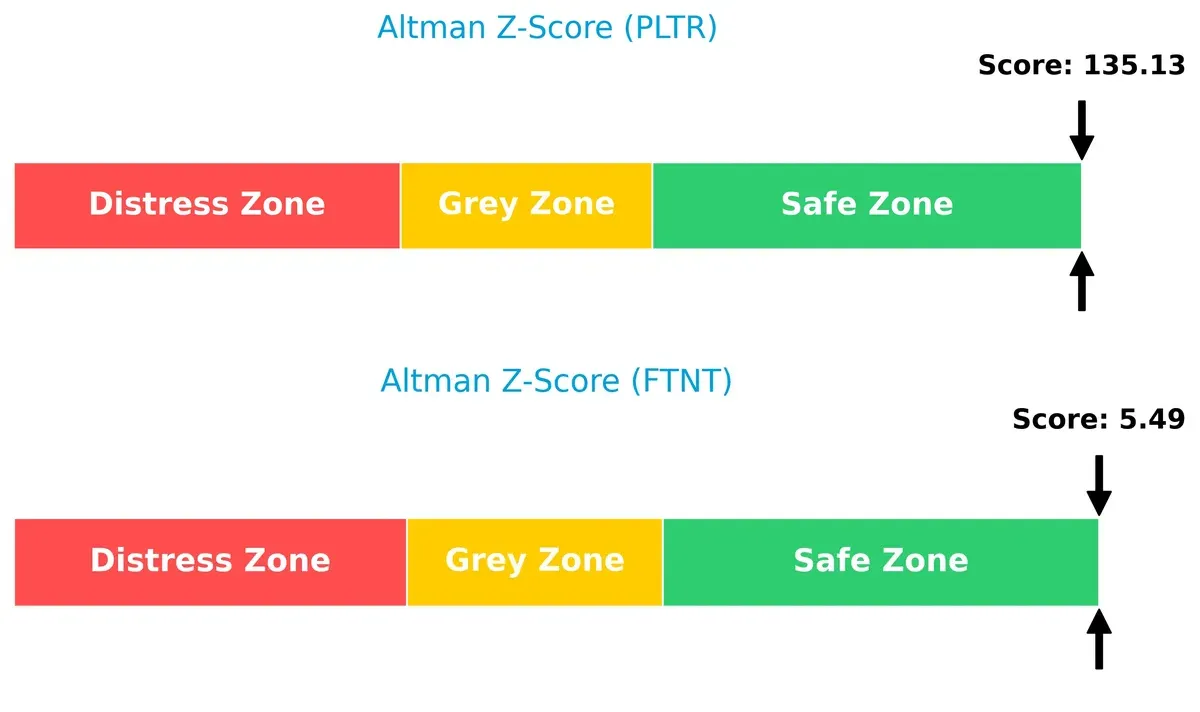
Bankruptcy Risk: Solvency Showdown
Palantir’s Altman Z-Score at 135.1 vastly exceeds Fortinet’s 5.5, indicating a superior long-term solvency cushion in this cycle:
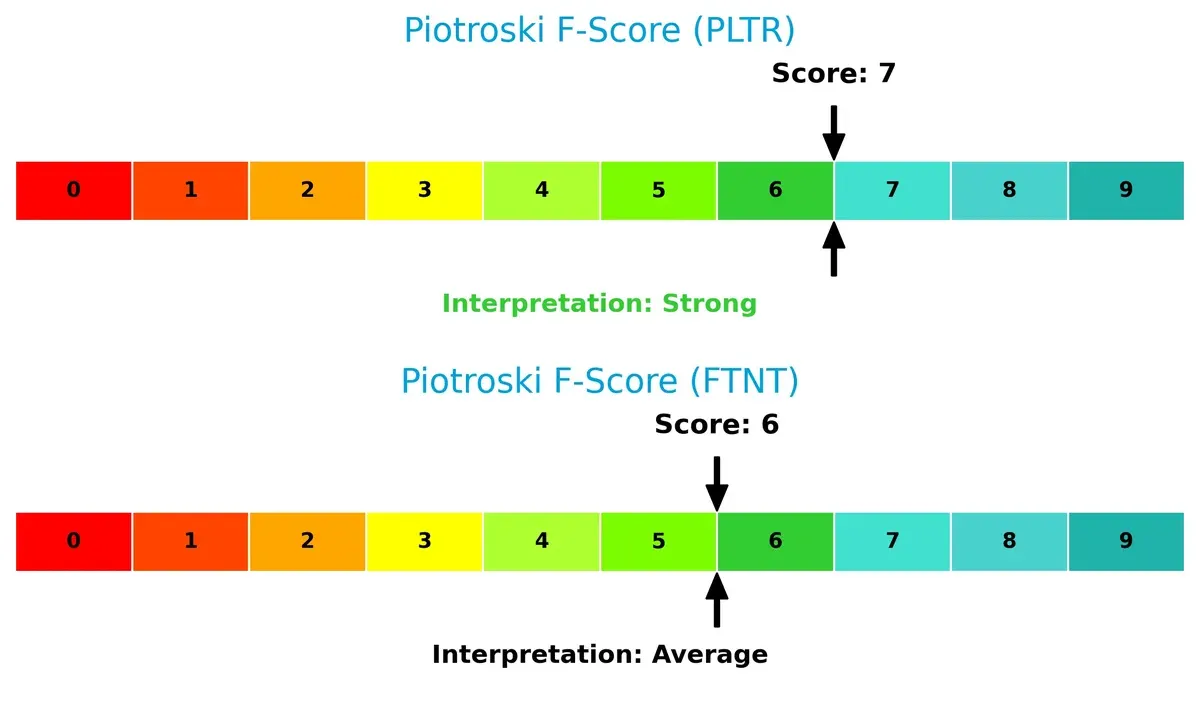
Financial Health: Quality of Operations
Palantir’s Piotroski F-Score of 7 beats Fortinet’s 6, suggesting stronger operational quality and fewer internal red flags for Palantir:
How are the two companies positioned?
This section dissects the operational DNA of Palantir and Fortinet by comparing their revenue distribution and internal strengths and weaknesses. The goal is to confront their economic moats and identify which model offers the most resilient, sustainable competitive advantage today.
Revenue Segmentation: The Strategic Mix
This visual comparison dissects how Palantir Technologies Inc. and Fortinet, Inc. diversify their income streams and where their primary sector bets lie:
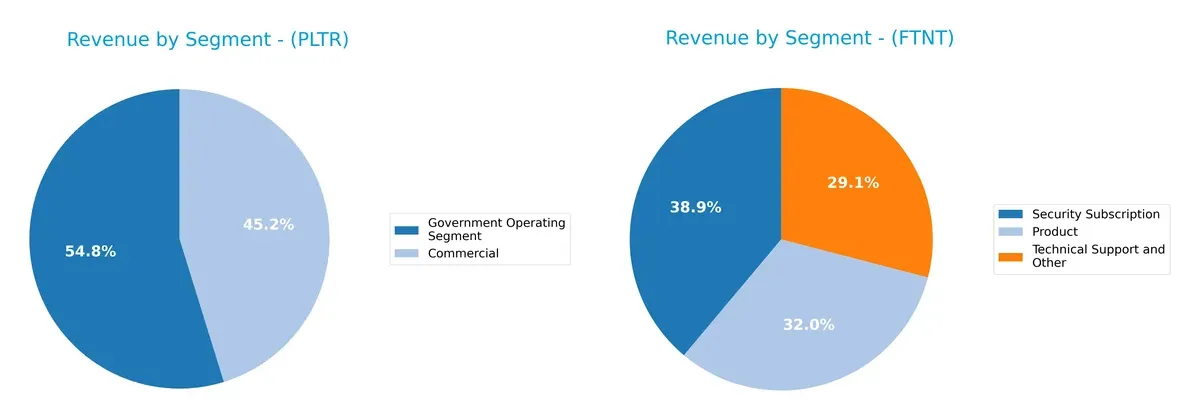
Palantir anchors its revenue in two segments: Government Operating ($1.57B) and Commercial ($1.30B) in 2024, showing moderate diversification. Fortinet dwarfs Palantir with a more balanced revenue mix across Security Subscription ($2.32B), Technical Support ($1.73B), and Product sales ($1.91B). Fortinet’s spread reduces concentration risk and signals a robust ecosystem lock-in. Palantir’s reliance on government contracts carries higher concentration risk but leverages infrastructure dominance in public sector analytics.
Strengths and Weaknesses Comparison
This table compares the Strengths and Weaknesses of Palantir Technologies Inc. and Fortinet, Inc.:
Palantir Strengths
- Strong net margin at 36.31%
- ROE of 22% shows efficient equity use
- ROIC (17.95%) exceeds WACC, indicating value creation
- Very low debt levels support financial stability
- High fixed asset turnover (17.76) signals asset efficiency
- Significant government and commercial revenue diversification
- Growing U.S., U.K., and Rest of World presence
Fortinet Strengths
- High net margin of 27.26%
- Exceptionally high ROE at 149.77%
- ROIC (28.76%) well above WACC, strong capital allocation
- Favorable debt-to-assets ratio at 9.59%
- Balanced geographic reach across Americas, EMEA, Asia Pacific
- Diverse revenue streams from products, subscriptions, and support
- Efficient fixed asset turnover (4.2)
Palantir Weaknesses
- Unfavorable WACC at 11.72% reduces capital efficiency
- Extremely high PE (259.19) and PB (57.02) ratios imply overvaluation risk
- Very high current ratio (7.11) may indicate inefficient asset use
- Zero dividend yield offers no income to investors
- Asset turnover moderate at 0.5 limits sales generation
- Heavy reliance on government segment could risk diversification
Fortinet Weaknesses
- PE ratio (32.48) and PB ratio (48.64) remain high
- Debt-to-equity ratio at 0.81 suggests moderate leverage risk
- Neutral current ratio (1.17) signals limited liquidity buffer
- Zero dividend yield like Palantir
- Asset turnover moderate at 0.65
Both companies demonstrate strong profitability and capital efficiency, but Palantir’s valuation and liquidity metrics raise caution. Fortinet shows broader geographic diversification and revenue streams, balanced by moderate leverage and valuation concerns. These profiles influence each company’s strategic focus on growth, risk management, and capital deployment.
The Moat Duel: Analyzing Competitive Defensibility
A structural moat is the only reliable shield protecting long-term profits from relentless competitive erosion. Let’s dissect the moats of Palantir and Fortinet:
Palantir Technologies Inc.: Data Integration & Switching Costs
Palantir’s moat stems from high switching costs tied to its complex data integration platforms. This manifests in soaring ROIC growth (215%) and margin expansion. New AI-powered offerings in 2026 could deepen its lock-in, but reliance on government contracts poses risk.
Fortinet, Inc.: Cost Leadership & Broad Security Ecosystem
Fortinet leverages cost advantage combined with a broad, integrated security platform, enabling consistent value creation. Its ROIC remains robust, expanding 63% over five years. Fortinet’s global reach and hardware-software synergy position it well for cybersecurity market growth in 2026.
Moat Strength Showdown: Switching Costs vs. Cost Leadership
Fortinet’s wider moat benefits from scale and cost efficiency, while Palantir’s deeper moat relies on entrenched switching costs and specialized AI tools. Fortinet appears better equipped to defend and expand market share amid intensifying competition.
Which stock offers better returns?
Over the past 12 months, Palantir Technologies surged over 470%, showing a strong bullish trend with decelerating momentum. Fortinet also gained, up 24%, maintaining a bullish but slowing advance.
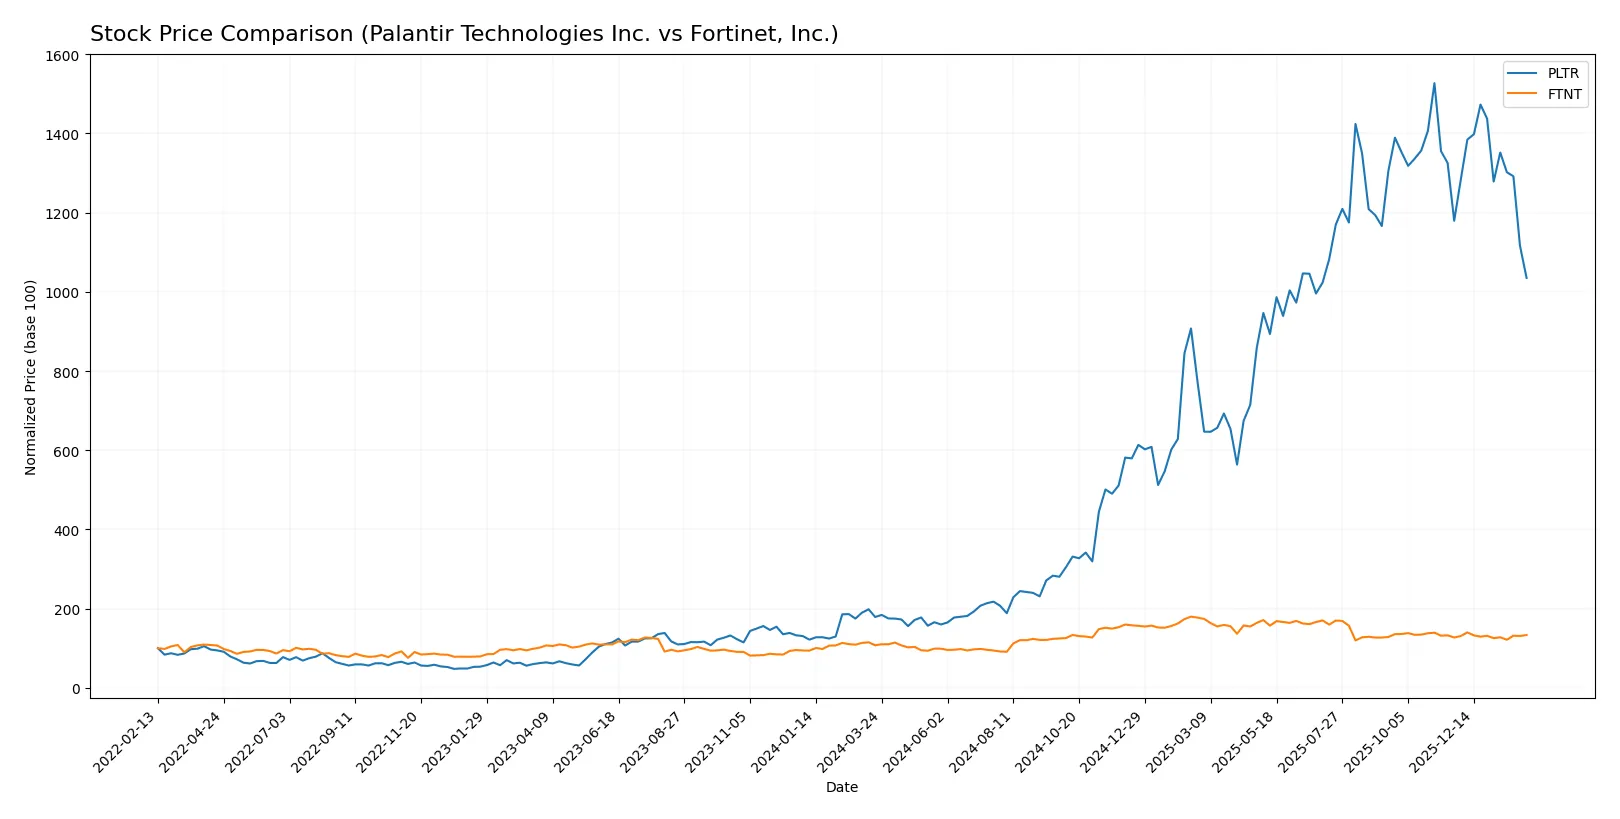
Trend Comparison
Palantir’s 478.54% price increase over the year reflects a bullish trend with deceleration. It reached a high of 200.47 and a low of 20.47, showing significant volatility.
Fortinet gained 24.04%, also bullish with decelerating momentum. Its price ranged between 56.51 and 111.64, with lower volatility compared to Palantir.
Palantir clearly outperformed Fortinet in market returns, delivering substantially stronger gains despite recent short-term weakness.
Target Prices
Analysts provide a clear target price consensus for Palantir Technologies and Fortinet, reflecting strong growth expectations.
| Company | Target Low | Target High | Consensus |
|---|---|---|---|
| Palantir Technologies Inc. | 180 | 230 | 200.15 |
| Fortinet, Inc. | 70 | 90 | 85 |
The consensus target for Palantir sits roughly 47% above its current price of $135.9, signaling bullish sentiment. Fortinet’s target consensus at $85 slightly exceeds its $82.76 trading price, indicating moderate upside potential.

Don’t Let Luck Decide Your Entry Point
Optimize your entry points with our advanced ProRealTime indicators. You’ll get efficient buy signals with precise price targets for maximum performance. Start outperforming now!
How do institutions grade them?
Palantir Technologies Inc. Grades
Here are recent grades provided by major financial institutions for Palantir Technologies Inc.:
| Grading Company | Action | New Grade | Date |
|---|---|---|---|
| Citigroup | Maintain | Buy | 2026-02-03 |
| UBS | Maintain | Neutral | 2026-02-03 |
| DA Davidson | Maintain | Neutral | 2026-02-03 |
| Citigroup | Upgrade | Buy | 2026-01-12 |
| Mizuho | Maintain | Neutral | 2025-11-04 |
| Baird | Maintain | Neutral | 2025-11-04 |
| RBC Capital | Maintain | Underperform | 2025-11-04 |
| Goldman Sachs | Maintain | Neutral | 2025-11-04 |
| DA Davidson | Maintain | Neutral | 2025-11-04 |
| Piper Sandler | Maintain | Overweight | 2025-11-04 |
Fortinet, Inc. Grades
Below are the latest institutional grades for Fortinet, Inc. from recognized grading companies:
| Grading Company | Action | New Grade | Date |
|---|---|---|---|
| Rosenblatt | Maintain | Buy | 2026-02-06 |
| Mizuho | Maintain | Underperform | 2026-02-06 |
| JP Morgan | Maintain | Underweight | 2026-02-06 |
| RBC Capital | Maintain | Sector Perform | 2026-02-06 |
| Wedbush | Maintain | Outperform | 2026-02-06 |
| Scotiabank | Downgrade | Sector Perform | 2026-02-02 |
| JP Morgan | Maintain | Underweight | 2026-01-30 |
| Rosenblatt | Upgrade | Buy | 2026-01-29 |
| TD Cowen | Upgrade | Buy | 2026-01-23 |
| Citigroup | Maintain | Neutral | 2026-01-13 |
Which company has the best grades?
Palantir holds a stronger consensus with multiple Buy and Overweight ratings and fewer Underperform marks. Fortinet shows more mixed views, including several Underweight and Underperform grades, despite some Buy upgrades. Investors may interpret Palantir’s more positive institutional sentiment as a sign of greater confidence in its near-term prospects.
Risks specific to each company
The following categories identify the critical pressure points and systemic threats facing both firms in the 2026 market environment:
1. Market & Competition
Palantir Technologies Inc.
- Faces intense competition in data analytics and AI-driven platforms, with high innovation demands.
Fortinet, Inc.
- Operates in a crowded cybersecurity space, requiring constant product evolution to maintain market share.
2. Capital Structure & Debt
Palantir Technologies Inc.
- Extremely low debt levels (D/E 0.03), signaling a conservative capital structure and low financial risk.
Fortinet, Inc.
- Higher leverage (D/E 0.81) increases financial risk despite favorable interest coverage.
3. Stock Volatility
Palantir Technologies Inc.
- High beta (1.687) points to significant stock price volatility, increasing investment risk.
Fortinet, Inc.
- Moderate beta (1.047) indicates relatively stable stock performance compared to the market.
4. Regulatory & Legal
Palantir Technologies Inc.
- Exposure to government regulation and data privacy laws in intelligence sectors worldwide.
Fortinet, Inc.
- Subject to global cybersecurity regulations and compliance challenges across multiple jurisdictions.
5. Supply Chain & Operations
Palantir Technologies Inc.
- Relies heavily on software development and cloud infrastructure, with operational risks in deployment.
Fortinet, Inc.
- Complex hardware and software supply chains pose risks from component shortages and logistics.
6. ESG & Climate Transition
Palantir Technologies Inc.
- Limited direct environmental impact but must address data security and ethical AI concerns.
Fortinet, Inc.
- Faces pressure to reduce carbon footprint in manufacturing and energy use in data centers.
7. Geopolitical Exposure
Palantir Technologies Inc.
- Significant geopolitical risks due to contracts with US and allied governments, sensitive data handling.
Fortinet, Inc.
- Operates globally with exposure to trade tensions and cybersecurity threats in volatile regions.
Which company shows a better risk-adjusted profile?
Palantir’s highest risk lies in market volatility and regulatory scrutiny. Fortinet’s biggest concern is its leveraged capital structure combined with complex supply chains. Despite Palantir’s elevated stock volatility, its ultra-low debt and strong liquidity underpin a more resilient risk-adjusted profile. Fortinet’s debt ratio near 0.8 raises caution amid geopolitical and operational risks. Palantir’s exceptional Altman Z-score and Piotroski score affirm financial stability, whereas Fortinet’s moderate Piotroski rating signals room for improvement.
Final Verdict: Which stock to choose?
Palantir’s superpower lies in its rapid growth and value creation, driven by a soaring ROIC that outpaces its cost of capital. Its exceptional operating leverage and expanding profitability mark it as a high-potential cash machine. The point of vigilance remains its lofty valuation multiples, signaling risk for value-sensitive portfolios. Palantir suits aggressive growth investors willing to ride volatility for outsized returns.
Fortinet commands a robust strategic moat with its entrenched position in cybersecurity and recurring revenue model. It offers a more balanced risk profile than Palantir, supported by strong cash flow yields and a solid, though less spectacular, ROIC trend. Its stability and consistent profitability make it a fit for investors seeking growth at a reasonable price (GARP) with an eye on capital preservation.
If you prioritize explosive growth and can tolerate valuation risk, Palantir outshines with superior capital efficiency and scaling potential. However, if you seek a blend of steady growth and financial resilience, Fortinet offers better stability and a durable competitive advantage, commanding a premium for its safer risk-return profile. Each company appeals to distinct investor avatars with differing appetites for growth versus stability.
Disclaimer: Investment carries a risk of loss of initial capital. The past performance is not a reliable indicator of future results. Be sure to understand risks before making an investment decision.
Go Further
I encourage you to read the complete analyses of Palantir Technologies Inc. and Fortinet, Inc. to enhance your investment decisions: