Home > Comparison > Technology > ORCL vs FTNT
The strategic rivalry between Oracle Corporation and Fortinet, Inc. defines the current trajectory of the technology sector’s software infrastructure industry. Oracle operates as a capital-intensive enterprise software and cloud services giant, while Fortinet specializes in integrated cybersecurity solutions with a leaner operational model. This analysis explores their contrasting strategies—scale and diversification versus focused innovation—to identify which offers superior risk-adjusted returns for a diversified portfolio in 2026.
Table of contents
Companies Overview
Oracle and Fortinet stand as pivotal players in the software infrastructure market, shaping enterprise technology landscapes globally.
Oracle Corporation: Enterprise Cloud Infrastructure Leader
Oracle dominates enterprise IT with its cloud software as a service offerings and comprehensive infrastructure technologies. It generates revenue through cloud applications like ERP, supply chain, and human capital management. In 2026, Oracle intensifies focus on expanding its autonomous database and industry-specific cloud solutions, reinforcing its position in hybrid cloud environments.
Fortinet, Inc.: Cybersecurity Innovator
Fortinet excels in delivering integrated cybersecurity solutions including firewalls, endpoint protection, and secure networking hardware. It drives revenue via FortiGate licenses and security subscriptions. Its 2026 strategy centers on broadening automated threat detection and response capabilities to secure complex digital ecosystems across industries worldwide.
Strategic Collision: Similarities & Divergences
Oracle pursues a broad enterprise cloud infrastructure approach, while Fortinet builds a specialized cybersecurity ecosystem. They clash primarily in securing enterprise data across cloud platforms. Oracle’s expansive portfolio contrasts with Fortinet’s focused security moat. Their distinct investment profiles reflect a choice between diversified cloud infrastructure and niche cybersecurity leadership.
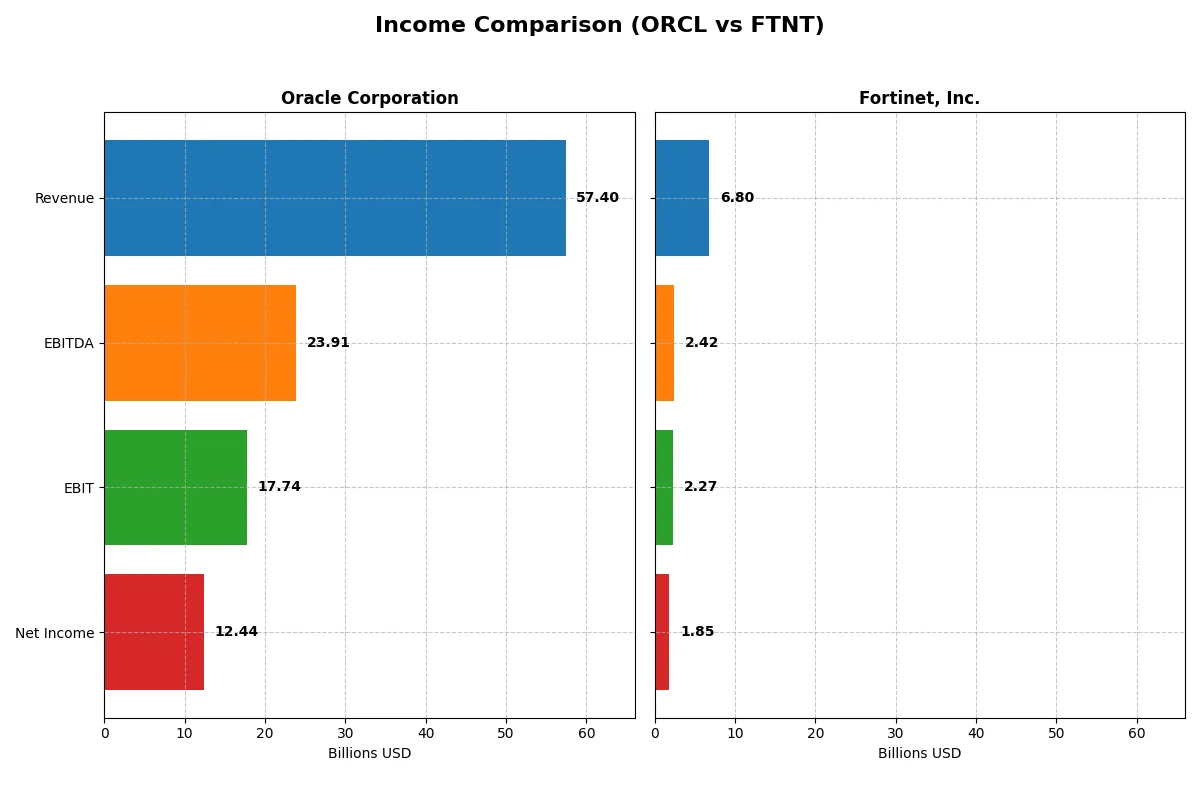
Income Statement Comparison
This data dissects the core profitability and scalability of both corporate engines to reveal who dominates the bottom line:
| Metric | Oracle Corporation (ORCL) | Fortinet, Inc. (FTNT) |
|---|---|---|
| Revenue | 57.4B | 6.8B |
| Cost of Revenue | 16.9B | 1.3B |
| Operating Expenses | 22.8B | 3.4B |
| Gross Profit | 40.5B | 5.5B |
| EBITDA | 23.9B | 2.4B |
| EBIT | 17.7B | 2.3B |
| Interest Expense | 3.6B | 20M |
| Net Income | 12.4B | 1.9B |
| EPS | 4.46 | 2.44 |
| Fiscal Year | 2025 | 2025 |
Income Statement Analysis: The Bottom-Line Duel
The upcoming income statement comparison will reveal which company converts revenue into profit with superior efficiency and sustainable momentum.
Oracle Corporation Analysis
Oracle’s revenue rose from 40.5B in 2021 to 57.4B in 2025, showing steady growth. Net income trended irregularly, peaking in 2021 before dipping and recovering to 12.4B in 2025. Gross margin remains strong at 70.5%, while net margin at 21.7% indicates healthy profitability. The latest year shows solid momentum with 8.4% revenue growth and a 9.7% net margin increase.
Fortinet, Inc. Analysis
Fortinet’s revenue doubled from 3.3B in 2021 to 6.8B in 2025, driven by robust expansion. Net income surged over 3x to 1.85B, supported by an 80.8% gross margin and a 27.3% net margin. Despite a slight net margin dip last year, Fortinet’s 14.2% revenue growth and strong EBIT margin of 33.4% reflect efficient cost control and accelerating profitability.
Margin Strength vs. Growth Velocity
Fortinet outpaces Oracle in revenue growth and net income expansion, doubling top-line and tripling bottom-line results since 2021. Oracle’s margins remain solid but show mixed net income trends. For investors prioritizing rapid growth and margin expansion, Fortinet’s dynamic profile stands out. Oracle appeals more to those valuing consistent profitability within mature scale.
Financial Ratios Comparison
These vital ratios act as a diagnostic tool to expose underlying fiscal health, valuation premiums, and capital efficiency for a clear comparative overview:
| Ratios | Oracle Corporation (ORCL) | Fortinet, Inc. (FTNT) |
|---|---|---|
| ROE | 60.8% | 149.8% |
| ROIC | 10.9% | 28.8% |
| P/E | 37.1 | 32.5 |
| P/B | 22.6 | 48.6 |
| Current Ratio | 0.75 | 1.17 |
| Quick Ratio | 0.75 | 1.09 |
| D/E (Debt-to-Equity) | 5.09 | 0.81 |
| Debt-to-Assets | 61.8% | 9.6% |
| Interest Coverage | 4.94 | 103.7 |
| Asset Turnover | 0.34 | 0.65 |
| Fixed Asset Turnover | 1.32 | 4.20 |
| Payout ratio | 38.1% | 0% |
| Dividend yield | 1.03% | 0% |
| Fiscal Year | 2025 | 2025 |
Efficiency & Valuation Duel: The Vital Signs
Financial ratios serve as a company’s DNA, exposing hidden risks and signaling operational excellence crucial for investment decisions.
Oracle Corporation
Oracle displays strong profitability with a 60.8% ROE and a 21.7% net margin, signaling efficient capital use. Its valuation appears stretched, with a high P/E of 37.1 and P/B of 22.6. Oracle returns value through a modest 1.03% dividend yield, balancing shareholder payouts with ongoing R&D investments.
Fortinet, Inc.
Fortinet boasts impressive profitability, marked by a 149.8% ROE and a 27.3% net margin, reflecting robust operational efficiency. The stock trades at a high P/E of 32.5 and an elevated P/B of 48.6, indicating premium valuation. It reinvests earnings aggressively, as it pays no dividend but sustains strong growth through R&D.
Premium Valuation vs. Operational Safety
Fortinet offers higher profitability and stronger balance sheet metrics, with fewer unfavorable ratios than Oracle. Oracle’s valuation is more stretched, coupled with weaker liquidity and debt ratios. Investors seeking growth and operational strength may prefer Fortinet, while those valuing steady dividends face a more cautious profile with Oracle.
Which one offers the Superior Shareholder Reward?
I find Oracle offers a consistent dividend yield near 1.3%, with a payout ratio around 40%, supported by solid free cash flow coverage. Oracle’s buybacks are modest but steady, enhancing shareholder value. Fortinet pays no dividends but aggressively repurchases shares, fueling capital returns amid strong free cash flow. While Fortinet reinvests heavily in growth, Oracle’s balanced distribution model presents a more sustainable total return profile in 2026. I conclude Oracle offers the superior shareholder reward for income-focused investors, blending yield with prudent buybacks and cash flow reliability.
Comparative Score Analysis: The Strategic Profile
The radar chart reveals the fundamental DNA and trade-offs of Oracle Corporation and Fortinet, Inc., spotlighting their financial strengths and vulnerabilities:
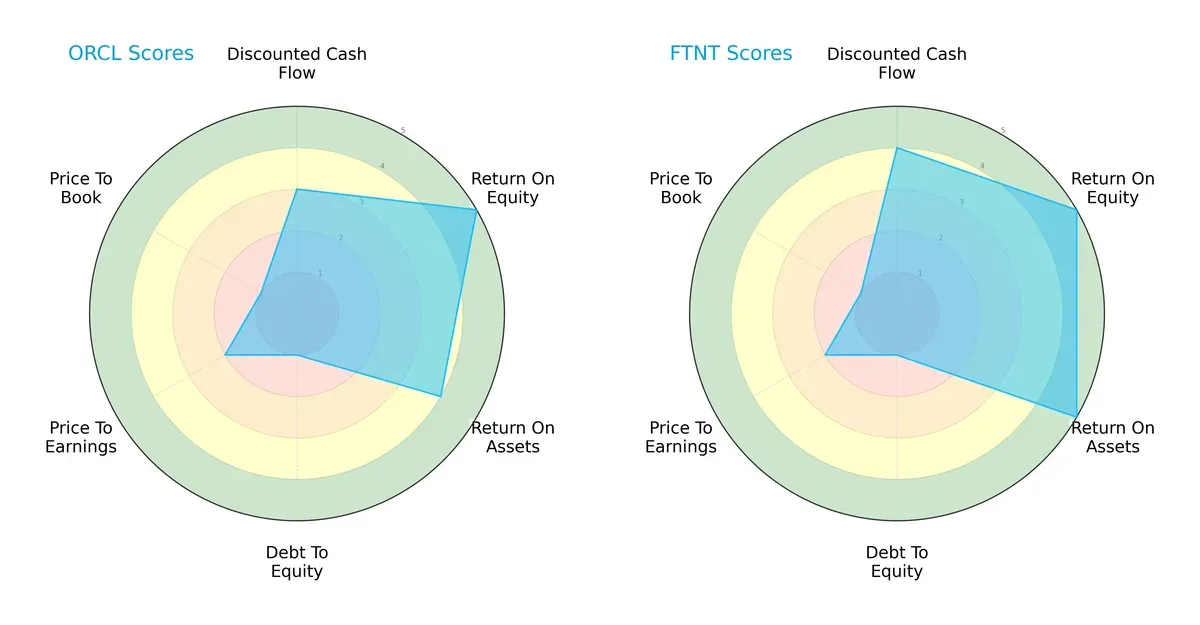
Fortinet edges out Oracle in discounted cash flow (4 vs. 3) and return on assets (5 vs. 4), showing superior asset utilization and valuation appeal. Both firms share top-tier return on equity (5) but suffer from weak debt-to-equity (1) and price-to-book (1) scores, signaling leverage risks and potential overvaluation by book metrics. Oracle presents a more balanced profile in valuation metrics, though Fortinet’s operational efficiency offers a sharper competitive advantage.
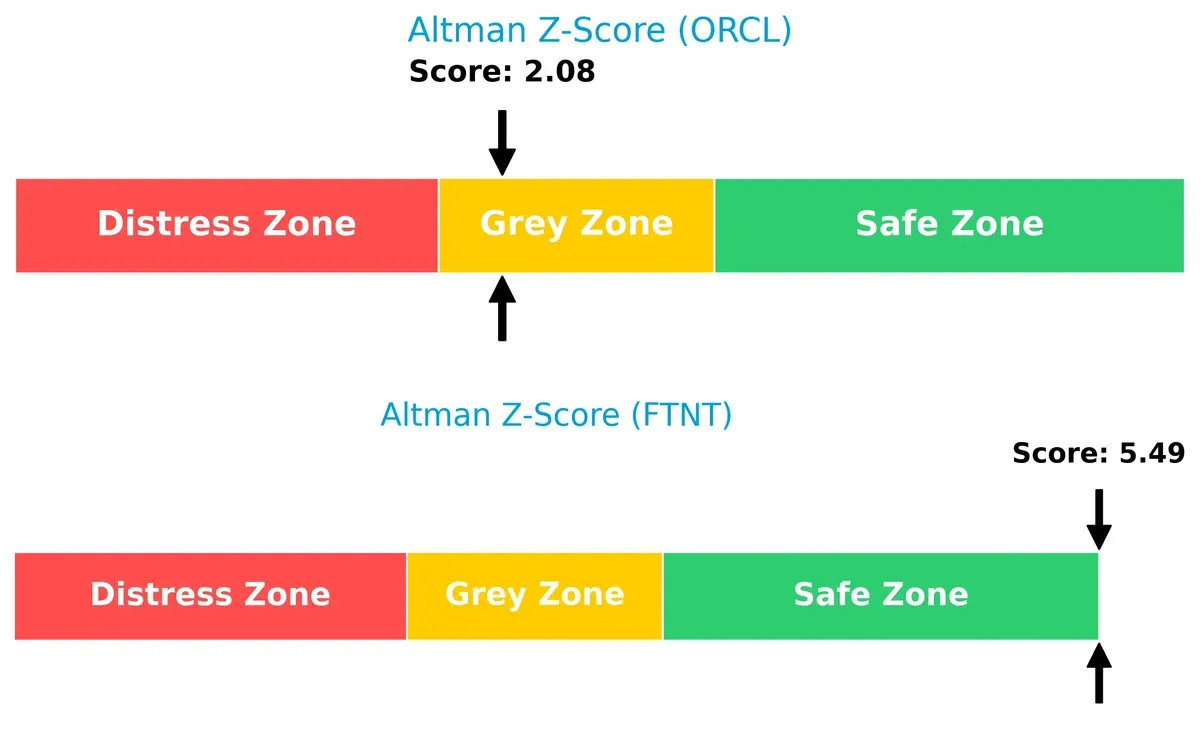
Bankruptcy Risk: Solvency Showdown
Fortinet’s Altman Z-Score (5.49) far exceeds Oracle’s (2.08), positioning Fortinet securely in the safe zone and Oracle in the grey zone, implying a higher bankruptcy risk for Oracle in volatile market cycles:
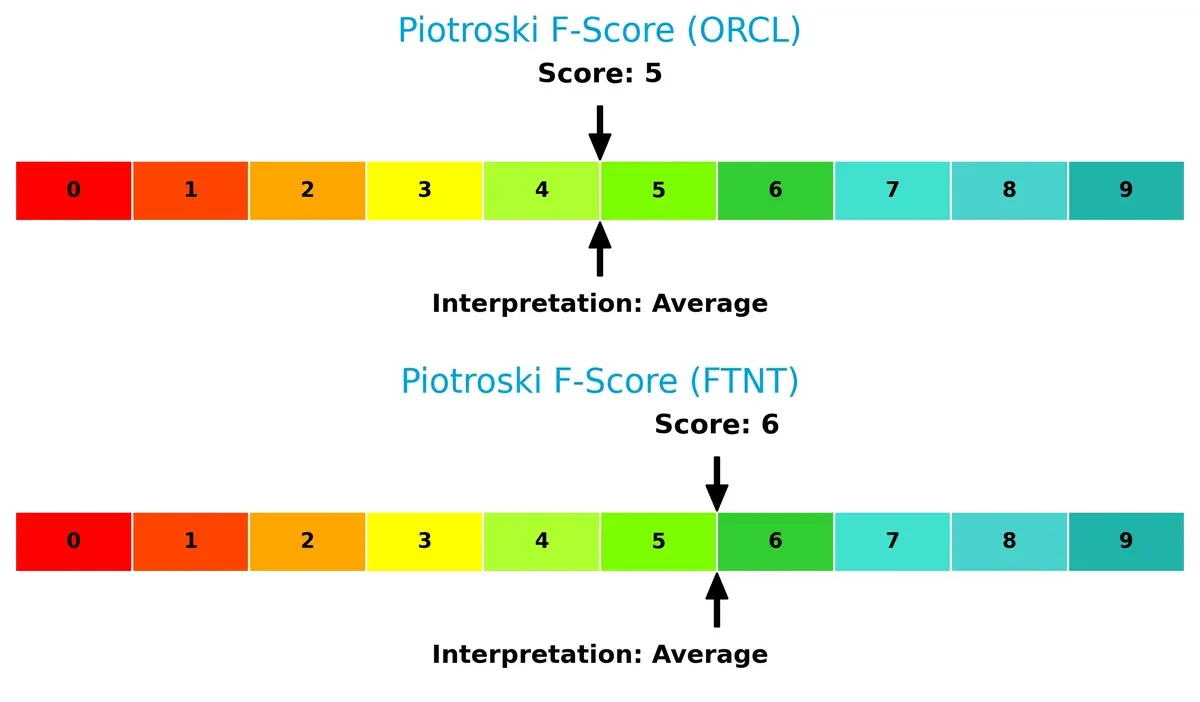
Financial Health: Quality of Operations
Fortinet’s Piotroski F-Score of 6 slightly outperforms Oracle’s 5, suggesting marginally stronger internal financial health. Neither company exhibits red flags, but Fortinet’s operational metrics reflect steadier financial quality:
How are the two companies positioned?
This section dissects the operational DNA of Oracle and Fortinet by comparing their revenue distribution and internal strengths and weaknesses. The objective is to confront their economic moats and identify which model offers the most resilient competitive advantage today.
Revenue Segmentation: The Strategic Mix
This comparison dissects how Oracle Corporation and Fortinet, Inc. diversify their income streams and where their primary sector bets lie:
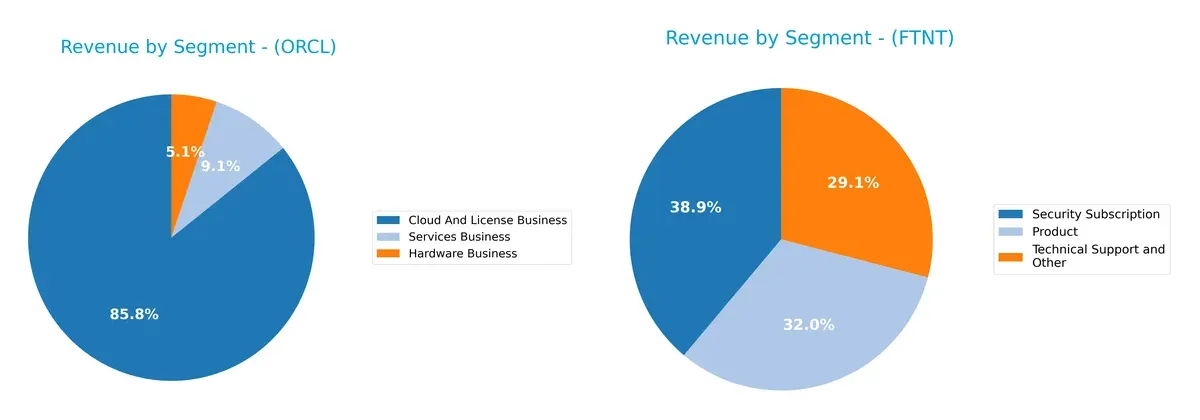
Oracle’s revenue anchors on Cloud And License Business at $49.2B, dwarfing Hardware ($2.9B) and Services ($5.2B). Fortinet boasts a more balanced mix: Security Subscription leads with $2.3B, followed by Product at $1.9B and Technical Support at $1.7B. Oracle’s concentration signals ecosystem lock-in with high switching costs, while Fortinet’s diversified streams reduce concentration risk, supporting stability amid evolving cybersecurity demands.
Strengths and Weaknesses Comparison
This table compares the strengths and weaknesses of Oracle Corporation and Fortinet, Inc. based on diversification, profitability, financial statements, innovation, global presence, and market share:
Oracle Corporation Strengths
- Diversified revenue with strong Cloud and License segment at $49.2B
- Favorable net margin at 21.7% and ROE at 60.8%
- Large global footprint, especially Americas at $36.3B
- Consistent services revenue near $5.2B
- Established market presence with hardware and services
Fortinet, Inc. Strengths
- High profitability with net margin at 27.3% and ROE at 149.8%
- Strong innovation evident in high ROIC at 28.8%
- Balanced revenue from Products and Security Subscriptions
- Favorable liquidity ratios with current ratio 1.17 and quick ratio 1.09
- Low debt-to-assets at 9.6% and strong interest coverage of 113
Oracle Corporation Weaknesses
- Unfavorable liquidity with current and quick ratios at 0.75
- High leverage with debt-to-assets at 61.8% and D/E at 5.09
- Elevated valuation multiples: P/E 37.1 and P/B 22.6
- Weak asset turnover at 0.34 indicating lower operational efficiency
- Dividend yield modest at 1.03%
- Debt interest coverage only neutral at 4.96
Fortinet, Inc. Weaknesses
- No dividend yield, potentially limiting income investors
- High valuation metrics with P/B at 48.6 and P/E at 32.5
- Neutral asset turnover at 0.65 lower than ideal for growth
- Smaller absolute scale in revenue compared to Oracle
- Less diversification with focus on security subscriptions and products
Both companies show strong profitability and global reach but differ in capital structure and operational scale. Oracle’s high leverage and lower liquidity present risks despite its size and diversification. Fortinet excels in profitability and financial health but faces valuation and scale challenges. Strategic focus on improving operational efficiency and managing valuation appears critical for both.
The Moat Duel: Analyzing Competitive Defensibility
A structural moat alone protects long-term profits from relentless competition and market pressures. Here’s how Oracle and Fortinet defend their turf:
Oracle Corporation: Intangible Assets Powerhouse
Oracle’s competitive edge stems from its vast portfolio of proprietary software and cloud platforms. This moat yields stable margins around 30% EBIT and steady revenue growth, though declining ROIC signals caution. Expansion in cloud ERP and autonomous database services may deepen its moat if innovation accelerates in 2026.
Fortinet, Inc.: Network Effects and Integration Leader
Fortinet leverages integrated cybersecurity solutions that create strong network effects among enterprise users. Its ROIC exceeds WACC by 20%, accompanied by 60% ROIC growth, showcasing superior capital efficiency. Fortinet’s broadening product suite positions it to disrupt new markets aggressively in 2026.
The Battle of Efficiency vs. Integration: Oracle’s Intangible Assets vs. Fortinet’s Network Effects
Fortinet’s rapidly growing ROIC and value creation reveal a deeper, more sustainable moat than Oracle’s eroding profitability. Fortinet is better equipped to defend and expand its market share through innovation and customer lock-in.
Which stock offers better returns?
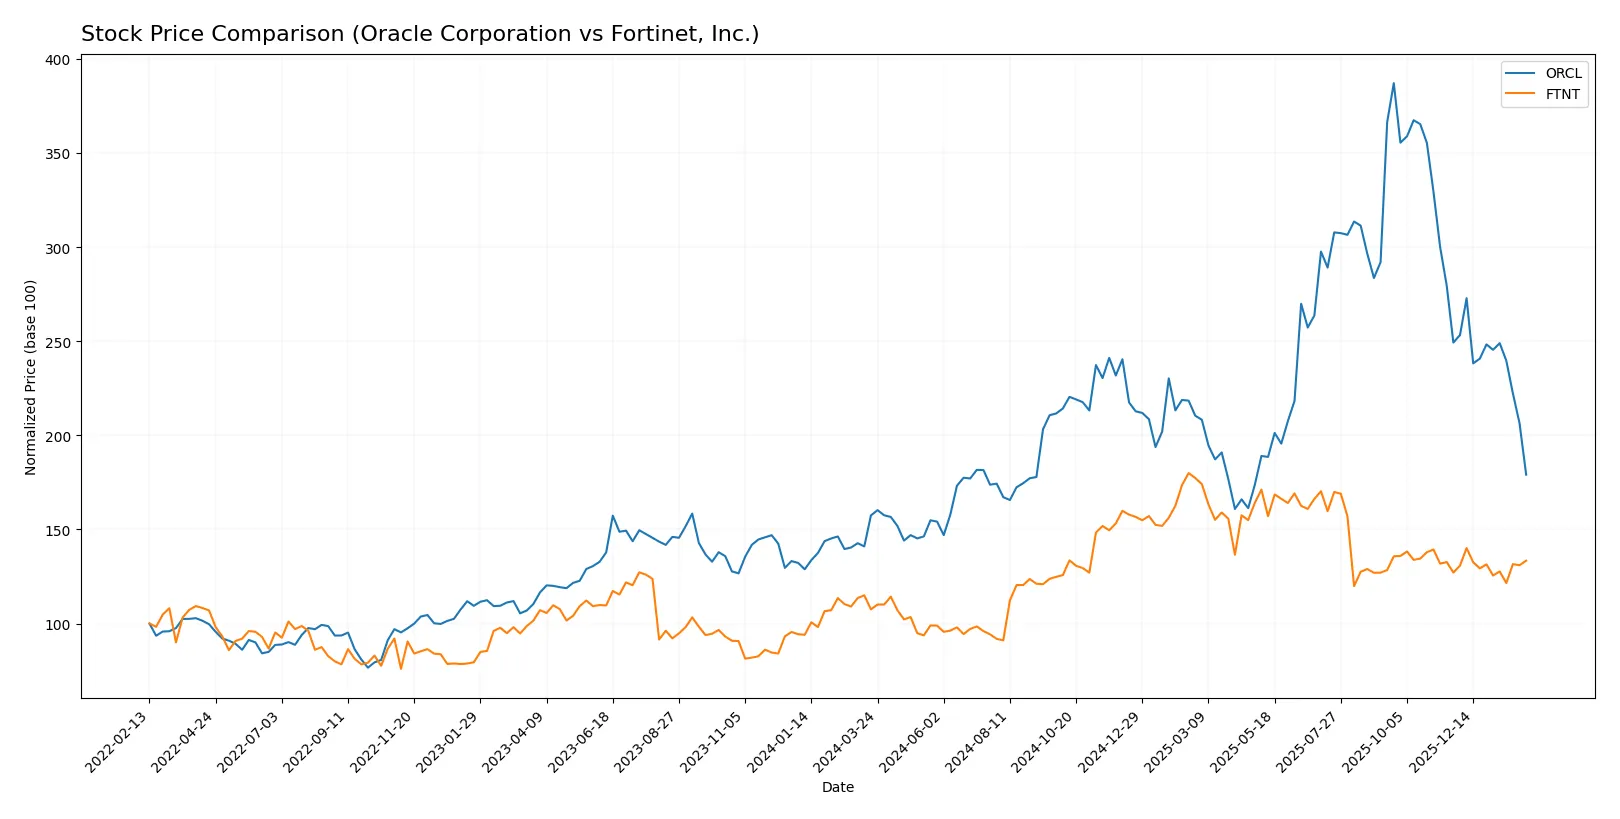
The past year shows Oracle’s price rising 13.76% with decelerating momentum, while Fortinet gained 24.04% but also with slowing acceleration. Both exhibit distinct volume trends and recent shifts.
Trend Comparison
Oracle’s stock rose 13.76% over the past 12 months, signaling a bullish trend despite deceleration. It peaked at 308.66 and bottomed at 114.88, showing notable volatility (std dev 47.83).
Fortinet’s stock climbed 24.04% over the same period, maintaining a bullish but decelerating trend. The price ranged between 56.51 and 111.64 with lower volatility (std dev 15.07).
Fortinet outperformed Oracle with a higher overall gain of 24.04% versus 13.76%, delivering superior market returns over the past year.
Target Prices
Analysts present a bullish consensus for Oracle Corporation and Fortinet, Inc.
| Company | Target Low | Target High | Consensus |
|---|---|---|---|
| Oracle Corporation | 175 | 400 | 304.59 |
| Fortinet, Inc. | 70 | 90 | 85 |
The consensus target for Oracle at $304.59 suggests substantial upside from its current $142.79 price. Fortinet’s $85 target slightly exceeds its $82.76 trading price, indicating modest growth expectations.

Don’t Let Luck Decide Your Entry Point
Optimize your entry points with our advanced ProRealTime indicators. You’ll get efficient buy signals with precise price targets for maximum performance. Start outperforming now!
How do institutions grade them?
This section compares recent institutional grades for Oracle Corporation and Fortinet, Inc.:
Oracle Corporation Grades
The table below shows Oracle’s latest grades from reputable institutions.
| Grading Company | Action | New Grade | Date |
|---|---|---|---|
| Citizens | Maintain | Market Outperform | 2026-02-05 |
| Scotiabank | Maintain | Sector Outperform | 2026-02-03 |
| Piper Sandler | Maintain | Overweight | 2026-02-03 |
| Morgan Stanley | Maintain | Equal Weight | 2026-01-23 |
| UBS | Maintain | Buy | 2026-01-05 |
| Jefferies | Maintain | Buy | 2026-01-05 |
| RBC Capital | Maintain | Sector Perform | 2026-01-05 |
| Goldman Sachs | Maintain | Neutral | 2025-12-12 |
| RBC Capital | Maintain | Sector Perform | 2025-12-11 |
| Stifel | Maintain | Buy | 2025-12-11 |
Fortinet, Inc. Grades
The table below presents Fortinet’s latest grades from credible grading firms.
| Grading Company | Action | New Grade | Date |
|---|---|---|---|
| Rosenblatt | Maintain | Buy | 2026-02-06 |
| Mizuho | Maintain | Underperform | 2026-02-06 |
| JP Morgan | Maintain | Underweight | 2026-02-06 |
| RBC Capital | Maintain | Sector Perform | 2026-02-06 |
| Wedbush | Maintain | Outperform | 2026-02-06 |
| Scotiabank | Downgrade | Sector Perform | 2026-02-02 |
| JP Morgan | Maintain | Underweight | 2026-01-30 |
| Rosenblatt | Upgrade | Buy | 2026-01-29 |
| TD Cowen | Upgrade | Buy | 2026-01-23 |
| Citigroup | Maintain | Neutral | 2026-01-13 |
Which company has the best grades?
Oracle consistently receives stronger grades, including multiple Buy and Market Outperform ratings. Fortinet’s grades are mixed, with notable Underperform and Underweight ratings. This contrast could influence investor confidence and portfolio positioning.
Risks specific to each company
The following categories identify critical pressure points and systemic threats facing Oracle Corporation and Fortinet, Inc. in the 2026 market environment:
1. Market & Competition
Oracle Corporation
- Faces intense competition from cloud giants and legacy software firms; market saturation pressures margin growth.
Fortinet, Inc.
- Operates in a rapidly evolving cybersecurity market with strong innovation demand and aggressive rivals.
2. Capital Structure & Debt
Oracle Corporation
- High debt-to-assets ratio (62%) signals elevated leverage risk; interest coverage moderate at 4.96x.
Fortinet, Inc.
- Low leverage with debt-to-assets at 9.6%; exceptional interest coverage at 113x reduces financial distress risk.
3. Stock Volatility
Oracle Corporation
- Beta at 1.63 indicates higher stock price volatility relative to the market.
Fortinet, Inc.
- Beta at 1.05 suggests moderate stock volatility, closer to market average.
4. Regulatory & Legal
Oracle Corporation
- Faces scrutiny over data privacy and antitrust in cloud and software licensing sectors.
Fortinet, Inc.
- Subject to cybersecurity regulations and potential liabilities from breaches or software vulnerabilities.
5. Supply Chain & Operations
Oracle Corporation
- Complex hardware and software supply chains vulnerable to semiconductor shortages and global logistics issues.
Fortinet, Inc.
- Relies on integrated hardware-software delivery; supply disruptions could affect product availability.
6. ESG & Climate Transition
Oracle Corporation
- Under pressure to reduce carbon footprint of data centers and hardware manufacturing.
Fortinet, Inc.
- Faces demands to enhance sustainable cybersecurity solutions and reduce operational emissions.
7. Geopolitical Exposure
Oracle Corporation
- Significant US and global exposure; trade tensions and export controls pose risks.
Fortinet, Inc.
- Global sales concentrated in sensitive regions; geopolitical instability could disrupt operations and sales.
Which company shows a better risk-adjusted profile?
Fortinet’s low leverage, superior interest coverage, and safer Altman Z-Score reflect a stronger risk-adjusted profile. Oracle’s high debt and weaker liquidity metrics amplify financial risks. Oracle’s intense market competition and regulatory pressures contrast with Fortinet’s operational agility in cybersecurity. Fortinet’s moderate stock volatility further supports a more balanced risk stance.
Final Verdict: Which stock to choose?
Oracle Corporation’s superpower lies in its entrenched enterprise software ecosystem and consistent revenue growth. However, its weakening ROIC and high leverage present a point of vigilance. Oracle suits portfolios seeking steady exposure to a large-cap tech stalwart with moderate growth ambitions.
Fortinet, Inc. commands a robust moat from its cybersecurity innovation and expanding margins. Its strong capital efficiency and low debt offer a safer profile relative to Oracle’s financial leverage. Fortinet fits well in growth-at-a-reasonable-price portfolios aiming for durable profitability in a high-demand sector.
If you prioritize stable cash flow and market dominance, Oracle is compelling despite some financial headwinds. However, if you seek superior capital returns and a resilient growth trajectory, Fortinet outshines with a cleaner balance sheet and expanding economic moat. Both present distinct scenarios depending on your risk tolerance and growth expectations.
Disclaimer: Investment carries a risk of loss of initial capital. The past performance is not a reliable indicator of future results. Be sure to understand risks before making an investment decision.
Go Further
I encourage you to read the complete analyses of Oracle Corporation and Fortinet, Inc. to enhance your investment decisions: