Home > Comparison > Technology > FTNT vs OKTA
The strategic rivalry between Fortinet, Inc. and Okta, Inc. shapes the future of the technology sector. Fortinet operates as a capital-intensive cybersecurity powerhouse with broad hardware and software solutions. Okta focuses on high-margin identity management software, emphasizing cloud-based security. This head-to-head captures the battle between comprehensive infrastructure and specialized cloud identity services. This analysis aims to identify which company offers the superior risk-adjusted return for a diversified portfolio in 2026.
Table of contents
Companies Overview
Fortinet and Okta stand as pivotal players in the software infrastructure sector, shaping the cybersecurity landscape.
Fortinet, Inc.: Integrated Cybersecurity Powerhouse
Fortinet dominates as a cybersecurity provider with a broad portfolio of hardware and software solutions. Its revenue stems chiefly from FortiGate security appliances and licenses, supplemented by subscription services. In 2026, Fortinet sharpens its strategic focus on integrated, automated security platforms that serve diverse industries globally, reinforcing its competitive advantage through comprehensive threat protection.
Okta, Inc.: Identity Management Innovator
Okta leads in identity and access management, delivering cloud-based identity solutions. Its core revenue engine revolves around the Okta Identity Cloud and Auth0 products, enabling secure and seamless user authentication. The company’s 2026 strategy emphasizes expanding adaptive multi-factor authentication and passwordless access, strengthening its market position in identity security across enterprises and institutions.
Strategic Collision: Similarities & Divergences
Both companies operate within software infrastructure but diverge sharply in approach—Fortinet pursues a hardware-software integrated ecosystem, while Okta champions cloud-native, identity-centric services. Their primary battleground is enterprise security, with Fortinet focusing on network defense and Okta on user identity. This contrast defines distinct investment profiles: Fortinet as a cybersecurity platform stalwart, Okta as a specialist in identity innovation.
Income Statement Comparison
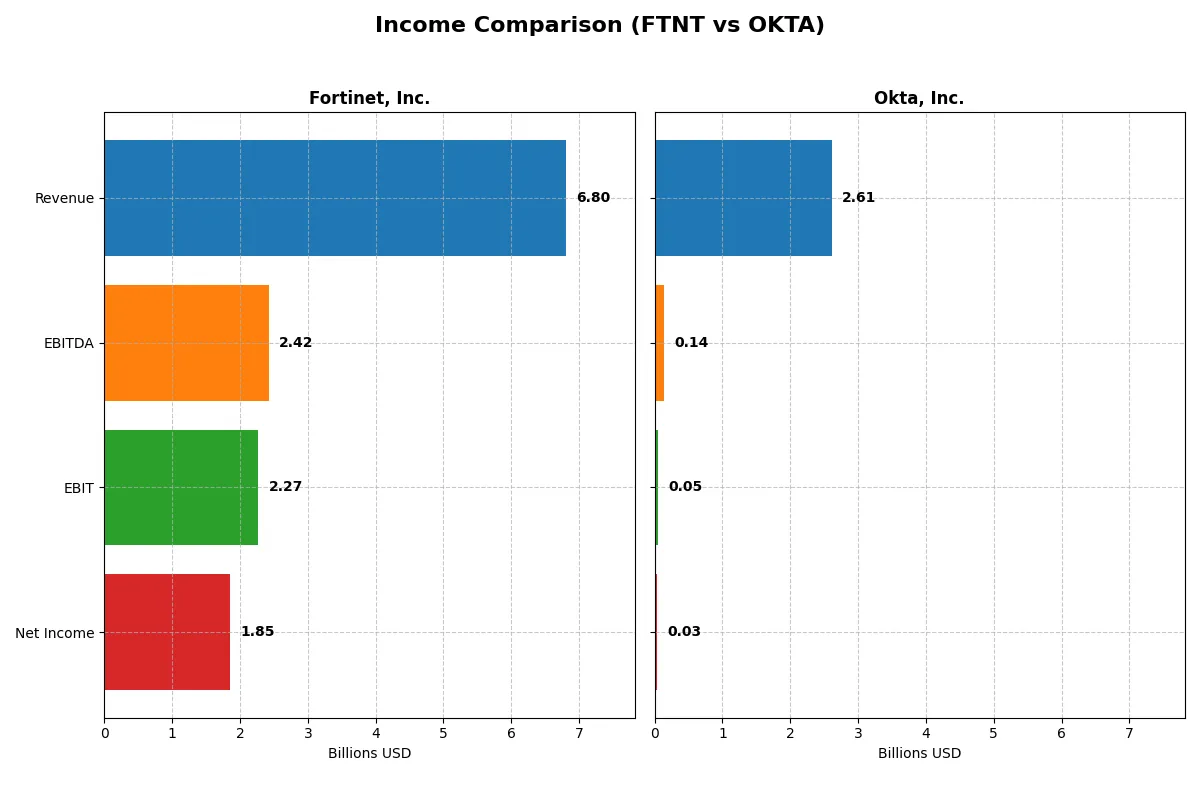
This data dissects the core profitability and scalability of both corporate engines to reveal who dominates the bottom line:
| Metric | Fortinet, Inc. (FTNT) | Okta, Inc. (OKTA) |
|---|---|---|
| Revenue | 6.8B | 2.6B |
| Cost of Revenue | 1.3B | 618M |
| Operating Expenses | 3.4B | 2.1B |
| Gross Profit | 5.5B | 2.0B |
| EBITDA | 2.4B | 139M |
| EBIT | 2.3B | 51M |
| Interest Expense | 20M | 5M |
| Net Income | 1.9B | 28M |
| EPS | 2.44 | 0.17 |
| Fiscal Year | 2025 | 2025 |
Income Statement Analysis: The Bottom-Line Duel
This income statement comparison reveals which company runs a more efficient and profitable corporate engine through their revenue and margin trends.
Fortinet, Inc. Analysis
Fortinet’s revenue surged from 3.3B in 2021 to nearly 6.8B in 2025, with net income tripling to 1.85B. The company maintains robust gross margins above 80% and a strong net margin near 27%. In 2025, Fortinet sustained momentum with 14% revenue growth and improved operating efficiency, signaling a high-margin, scalable business model.
Okta, Inc. Analysis
Okta’s revenue grew impressively from 835M in 2021 to 2.61B in 2025, doubling over five years. However, net income only turned positive recently, reaching 28M in 2025. Gross margin stands at a respectable 76%, but net margin remains slim at just over 1%. The latest year shows improved profitability but highlights ongoing margin pressure amid heavy operating expenses.
Margin Strength vs. Revenue Expansion
Fortinet clearly leads with superior net margins and consistent profit growth, reflecting operational efficiency and pricing power. Okta’s rapid revenue growth is notable but comes with low profitability and narrower margins. For investors prioritizing solid profits and margin durability, Fortinet’s profile offers greater fundamental strength.
Financial Ratios Comparison
These vital ratios act as a diagnostic tool to expose the underlying fiscal health, valuation premiums, and capital efficiency of the companies compared below:
| Ratios | Fortinet, Inc. (FTNT) | Okta, Inc. (OKTA) |
|---|---|---|
| ROE | 1.50 | 0.44 |
| ROIC | 0.29 | -0.61 |
| P/E | 32.48 | 570.60 |
| P/B | 48.64 | 2.49 |
| Current Ratio | 1.17 | 1.35 |
| Quick Ratio | 1.09 | 1.35 |
| D/E | 0.81 | 0.15 |
| Debt-to-Assets | 0.10 | 0.10 |
| Interest Coverage | 103.72 | -14.80 |
| Asset Turnover | 0.65 | 0.28 |
| Fixed Asset Turnover | 4.20 | 22.31 |
| Payout ratio | 0 | 0 |
| Dividend yield | 0 | 0 |
| Fiscal Year | 2025 | 2025 |
Efficiency & Valuation Duel: The Vital Signs
Ratios act as a company’s DNA, exposing hidden risks and highlighting operational excellence to guide informed investment decisions.
Fortinet, Inc.
Fortinet displays robust profitability with a 150% ROE and a strong 27% net margin, signaling operational efficiency. However, its P/E of 32.5 and P/B of 48.6 suggest a stretched valuation. The firm reinvests earnings aggressively in R&D instead of paying dividends, aiming for long-term growth and shareholder value.
Okta, Inc.
Okta suffers weak profitability with a 0.44% ROE and slim 1.07% net margin, reflecting operational struggles. Its P/E ratio exceeds 570, marking it as highly expensive relative to earnings. Okta does not pay dividends, instead allocating capital to R&D to fuel growth, though returns remain underwhelming.
Premium Valuation vs. Operational Safety
Fortinet balances strong returns and growth reinvestment despite a high valuation, offering a relatively safer risk-reward profile. Okta’s expensive multiples and poor profitability heighten risk without immediate payoff. Investors seeking operational resilience may prefer Fortinet’s profile, while Okta suits those betting on turnaround potential.
Which one offers the Superior Shareholder Reward?
I see Fortinet and Okta both forgo dividends, emphasizing growth reinvestment. Fortinet posts sturdy free cash flow of 2.9B and modest debt (D/E 0.8), enabling consistent buybacks. Okta generates 4.3B free cash flow but struggles with profitability and higher leverage, limiting buybacks. Fortinet’s distribution via buybacks is more sustainable and likely to reward shareholders more attractively in 2026.
Comparative Score Analysis: The Strategic Profile
The radar chart reveals the fundamental DNA and trade-offs of Fortinet, Inc. and Okta, Inc., illustrating their core financial strengths and vulnerabilities:
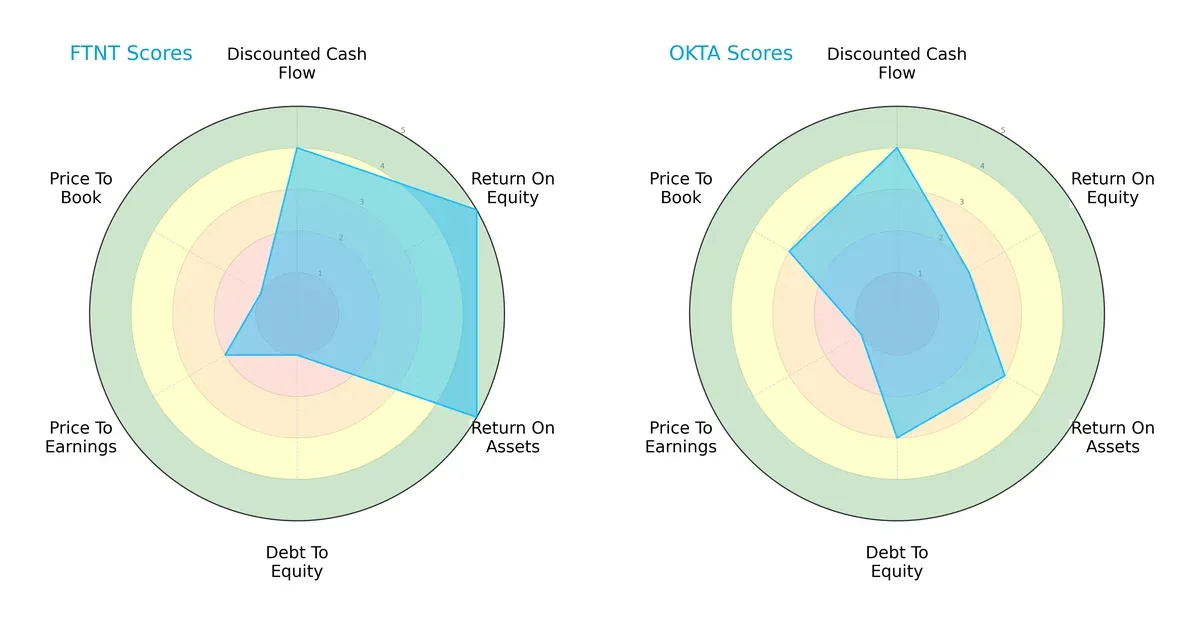
Fortinet scores higher on profitability metrics like ROE (5 vs. 2) and ROA (5 vs. 3), reflecting superior asset and equity efficiency. However, its debt-to-equity score (1) flags significant leverage risk, contrasting with Okta’s moderate score (3). Valuation scores favor Okta on price-to-book (3 vs. 1), but both show weaknesses in P/E, with Fortinet slightly better (2 vs. 1). Overall, Fortinet’s profile is profitability-driven but unbalanced, while Okta offers a steadier financial structure with less operational efficiency.
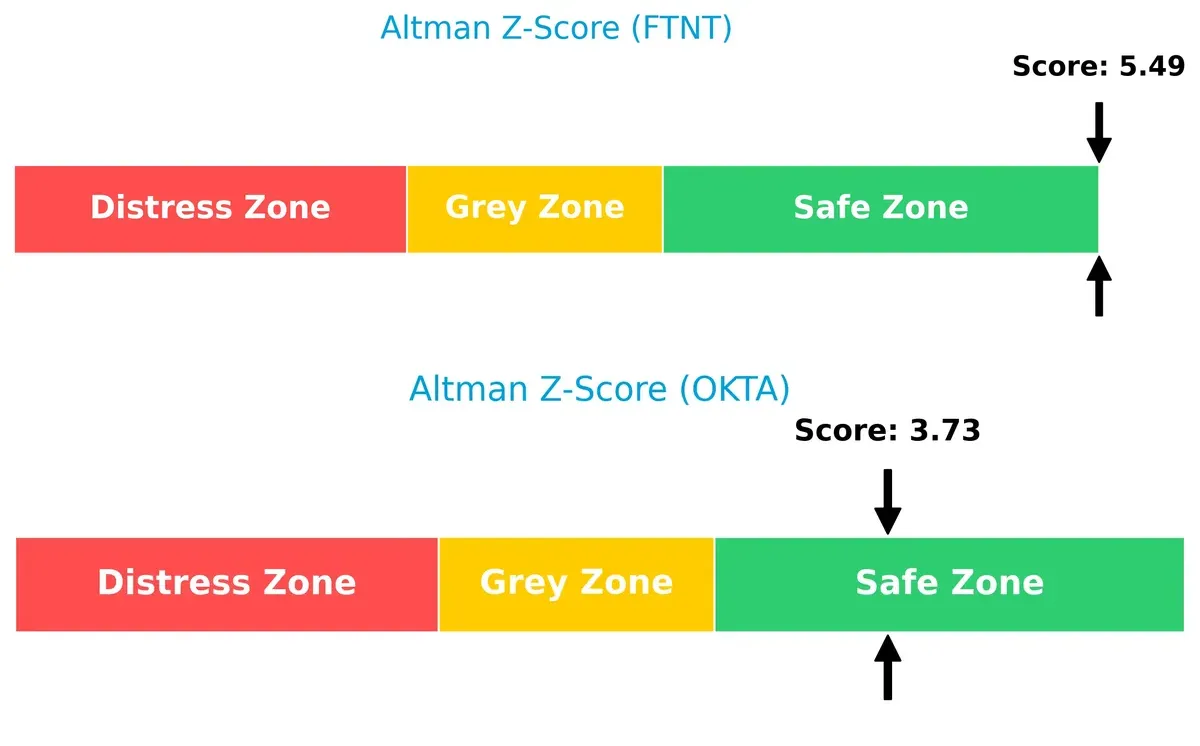
Bankruptcy Risk: Solvency Showdown
Fortinet’s Altman Z-Score of 5.49 outperforms Okta’s 3.73, both safely above the distress threshold, signaling robust long-term solvency in this cycle:
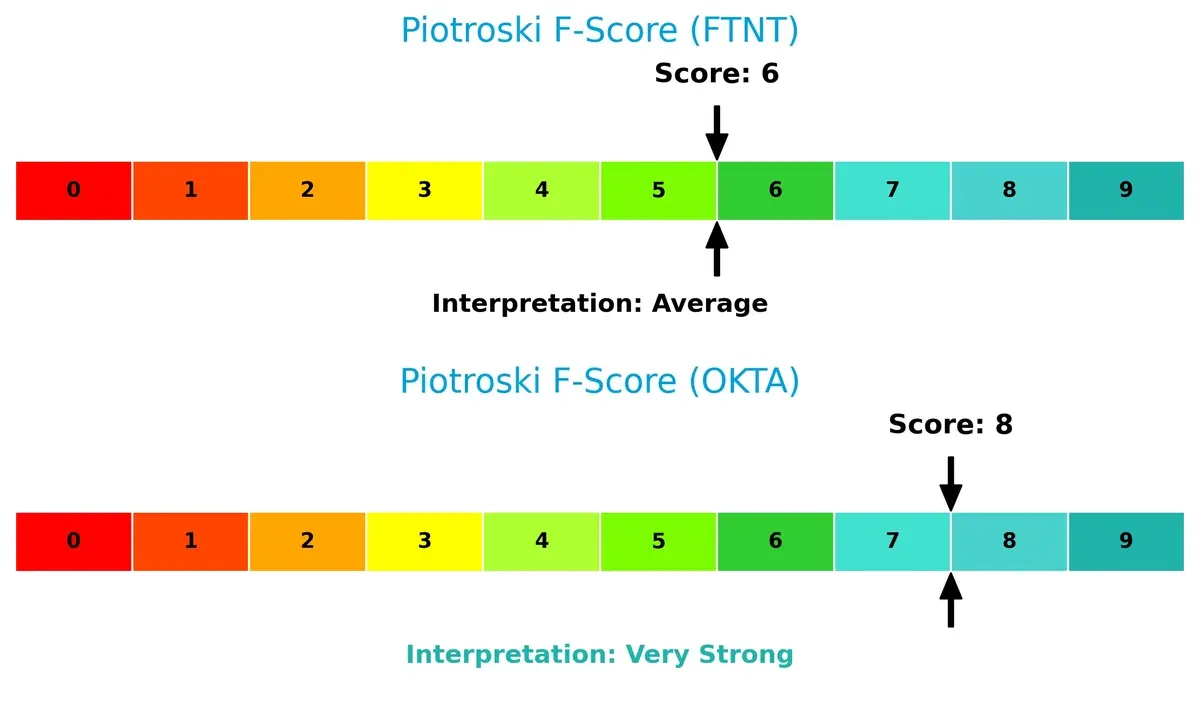
Financial Health: Quality of Operations
Okta’s Piotroski F-Score of 8 surpasses Fortinet’s 6, indicating stronger internal financial controls and fewer red flags in operational efficiency and liquidity:
How are the two companies positioned?
This section dissects the operational DNA of Fortinet and Okta by comparing their revenue distribution and internal dynamics. The goal is to confront their economic moats to reveal the most resilient and sustainable advantage today.
Revenue Segmentation: The Strategic Mix
This visual comparison dissects how Fortinet, Inc. and Okta, Inc. diversify their income streams and where their primary sector bets lie:
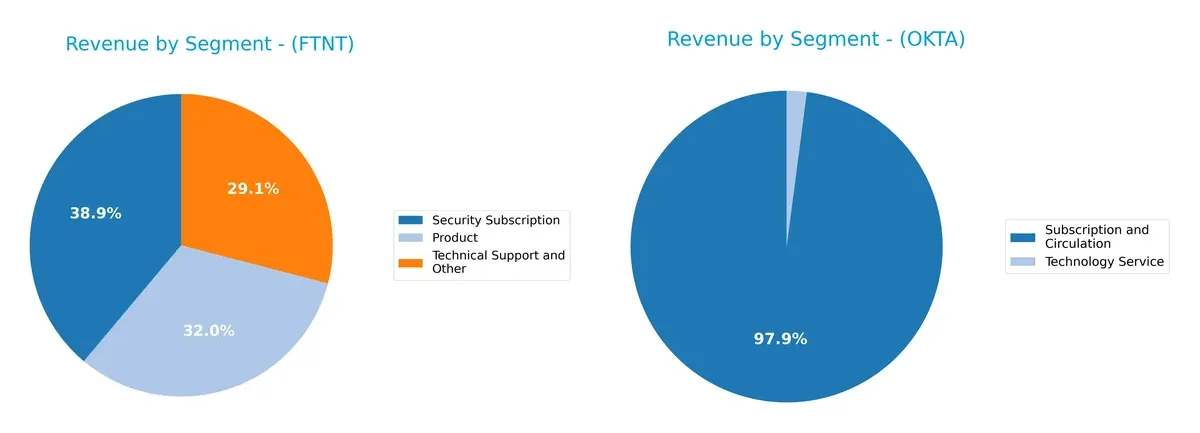
Fortinet anchors its revenue across three sizable segments: Security Subscription at $2.3B, Product at $1.9B, and Technical Support at $1.7B, showing a balanced ecosystem approach. Okta, conversely, pivots heavily on Subscription and Circulation with $2.56B, dwarfing its minor Technology Service revenue of $54M. Fortinet’s diversified mix mitigates concentration risk, while Okta’s reliance on a single segment exposes it to sector-specific volatility.
Strengths and Weaknesses Comparison
This table compares the strengths and weaknesses of Fortinet, Inc. and Okta, Inc.:
Fortinet Strengths
- Strong profitability with net margin 27.26%
- High ROE at 149.77%
- Favorable ROIC of 28.76%
- Diversified revenue streams across products, subscriptions, and services
- Broad global presence with significant sales in Americas, EMEA, and Asia Pacific
Okta Strengths
- Favorable WACC at 7.15% supports capital efficiency
- Low debt-to-equity ratio at 0.15
- Strong fixed asset turnover at 22.31
- Favorable debt-to-assets and interest coverage ratios
- Focused subscription revenue growth with large U.S. market share
Fortinet Weaknesses
- Unfavorable valuation multiples with PE 32.48 and PB 48.64
- No dividend yield
- Moderate current ratio at 1.17 signals limited liquidity buffer
- Neutral asset turnover at 0.65 limits asset efficiency
Okta Weaknesses
- Very low profitability with net margin 1.07% and ROE 0.44%
- Negative ROIC at -0.61% indicates value destruction
- High PE ratio at 570.6 suggests overvaluation
- Low asset turnover at 0.28 signals operational inefficiency
- No dividend yield
Fortinet’s strengths lie in robust profitability and diversified global sales, although valuation remains stretched. Okta shows financial prudence in capital structure but struggles with profitability and operational efficiency. These factors will influence each company’s strategic focus on growth and value creation.
The Moat Duel: Analyzing Competitive Defensibility
A structural moat is the only true shield preserving long-term profits from relentless competitive erosion. Let’s dissect how Fortinet and Okta defend their turf:
Fortinet, Inc.: Integrated Security Fortress
Fortinet’s moat stems from its broad, integrated cybersecurity platform combining hardware and software, reflected in a robust 20%+ ROIC above WACC. Its 33% EBIT margin and 80% gross margin reveal margin stability and capital efficiency. Expansion into emerging markets and evolving threat landscapes in 2026 should deepen this moat.
Okta, Inc.: Identity Management Network Effect
Okta leverages network effects in identity solutions, locking in customers with cloud-based access management. Despite a growing ROIC, it remains below WACC, signaling value destruction but improving profitability. Okta’s rapid revenue growth and multi-factor authentication innovations could expand its moat if profitability sustains.
Integrated Security vs. Identity Network: The Moat Battle
Fortinet’s wider moat manifests through superior capital returns and stable margins, while Okta’s moat is narrower but gaining strength via rapid innovation. Fortinet is better equipped to defend market share with its proven value creation and diversified product ecosystem.
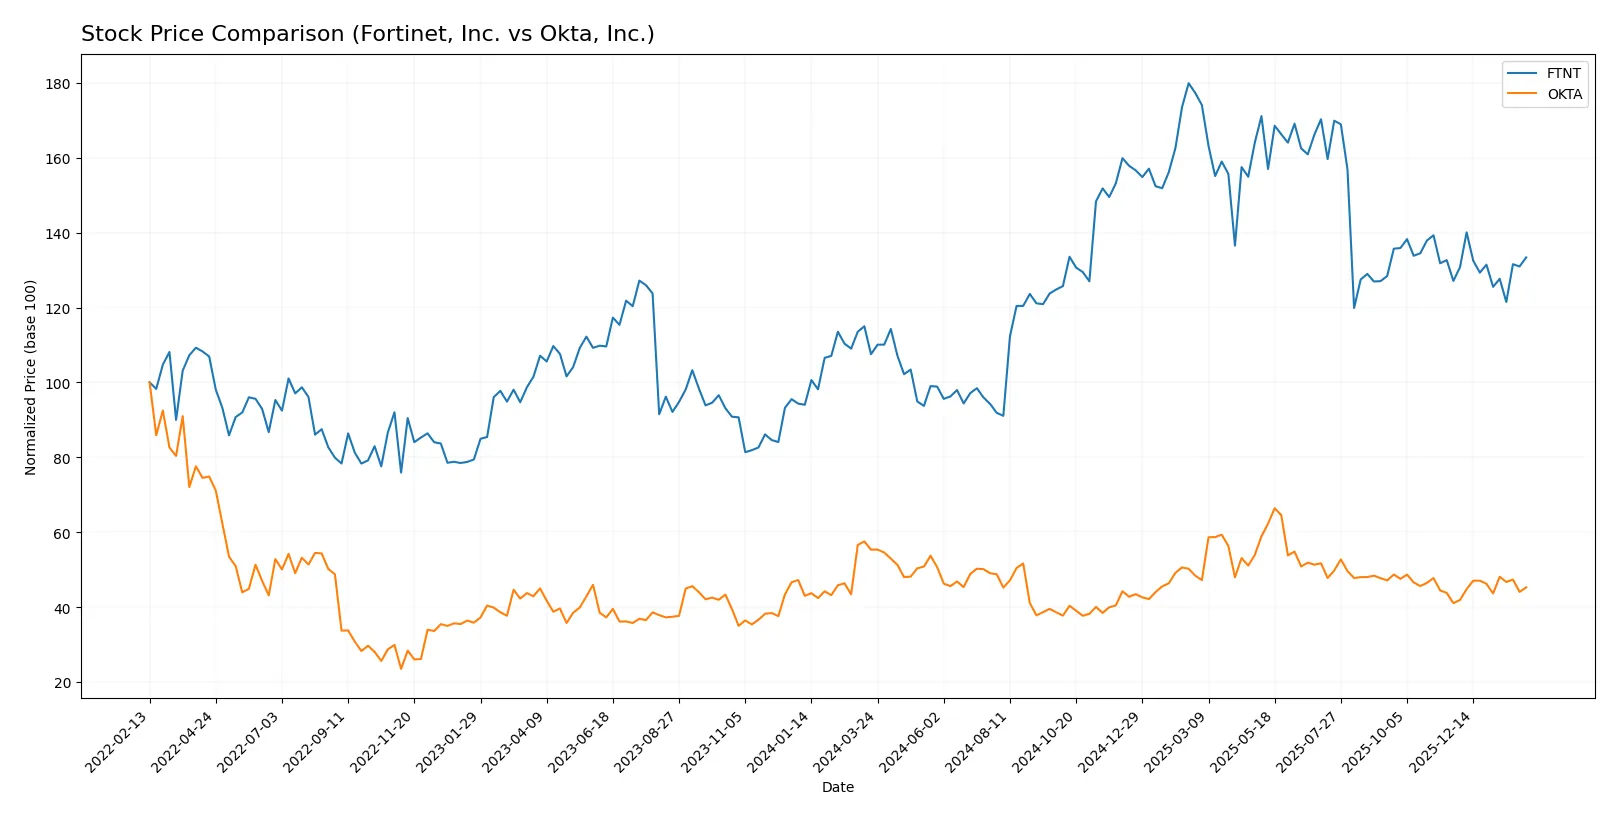
Which stock offers better returns?
Over the past 12 months, Fortinet, Inc. and Okta, Inc. exhibited contrasting stock price trends, marked by Fortinet’s sustained gains and Okta’s significant decline with recent recovery signals.
Trend Comparison
Fortinet, Inc. recorded a 24.04% price increase over the past year, indicating a bullish trend with decelerating momentum. The stock fluctuated between 56.51 and 111.64, reflecting moderate volatility (15.07 std dev).
Okta, Inc. showed an 18.25% price decline over the same period, representing a bearish trend despite accelerating downward momentum. Its price ranged from 72.24 to 127.3, with 11.12 volatility.
Comparing both stocks, Fortinet outperformed Okta with a positive 24.04% return versus Okta’s negative 18.25%, delivering the highest market performance in the last 12 months.
Target Prices
Analysts present a cautiously optimistic consensus for Fortinet, Inc. and Okta, Inc.
| Company | Target Low | Target High | Consensus |
|---|---|---|---|
| Fortinet, Inc. | 70 | 90 | 85 |
| Okta, Inc. | 60 | 140 | 110.67 |
Fortinet’s consensus target of $85 sits just above its current $82.76 price, signaling modest upside. Okta’s $110.67 consensus target implies a significant premium to its $86.74 price, reflecting stronger growth expectations.

Don’t Let Luck Decide Your Entry Point
Optimize your entry points with our advanced ProRealTime indicators. You’ll get efficient buy signals with precise price targets for maximum performance. Start outperforming now!
How do institutions grade them?
Fortinet, Inc. Grades
The latest institutional grades for Fortinet, Inc. are summarized below:
| Grading Company | Action | New Grade | Date |
|---|---|---|---|
| Rosenblatt | Maintain | Buy | 2026-02-06 |
| Mizuho | Maintain | Underperform | 2026-02-06 |
| JP Morgan | Maintain | Underweight | 2026-02-06 |
| RBC Capital | Maintain | Sector Perform | 2026-02-06 |
| Wedbush | Maintain | Outperform | 2026-02-06 |
| Scotiabank | Downgrade | Sector Perform | 2026-02-02 |
| JP Morgan | Maintain | Underweight | 2026-01-30 |
| Rosenblatt | Upgrade | Buy | 2026-01-29 |
| TD Cowen | Upgrade | Buy | 2026-01-23 |
| Citigroup | Maintain | Neutral | 2026-01-13 |
Okta, Inc. Grades
The latest institutional grades for Okta, Inc. are summarized below:
| Grading Company | Action | New Grade | Date |
|---|---|---|---|
| Stephens & Co. | Upgrade | Overweight | 2026-01-14 |
| Piper Sandler | Maintain | Neutral | 2026-01-05 |
| RBC Capital | Maintain | Outperform | 2026-01-05 |
| Jefferies | Upgrade | Buy | 2025-12-16 |
| Needham | Maintain | Buy | 2025-12-12 |
| BTIG | Maintain | Buy | 2025-12-04 |
| JP Morgan | Maintain | Overweight | 2025-12-03 |
| Cantor Fitzgerald | Maintain | Overweight | 2025-12-03 |
| Scotiabank | Maintain | Sector Perform | 2025-12-03 |
| Canaccord Genuity | Maintain | Buy | 2025-12-03 |
Which company has the best grades?
Okta, Inc. generally holds stronger grades, with multiple Buy and Overweight ratings. Fortinet shows a mix, including Underperform and Underweight. Investors may view Okta’s grades as reflecting more positive institutional sentiment.
Risks specific to each company
The following categories identify the critical pressure points and systemic threats facing both firms in the 2026 market environment:
1. Market & Competition
Fortinet, Inc.
- Strong cybersecurity presence; faces intense sector rivalry and innovation pressure.
Okta, Inc.
- Focused on identity solutions; operates in a highly competitive SaaS market with rapid innovation.
2. Capital Structure & Debt
Fortinet, Inc.
- Moderate leverage (D/E 0.81) with excellent interest coverage (113x) but weak debt-to-equity rating.
Okta, Inc.
- Low leverage (D/E 0.15) and solid interest coverage (10x) indicate conservative capital structure.
3. Stock Volatility
Fortinet, Inc.
- Beta near 1.05 suggests typical market volatility exposure.
Okta, Inc.
- Lower beta at 0.77 indicates less sensitivity to market swings.
4. Regulatory & Legal
Fortinet, Inc.
- Cybersecurity regulations evolving; compliance costs could rise.
Okta, Inc.
- Identity and data privacy regulations intensify risk of fines and operational adjustments.
5. Supply Chain & Operations
Fortinet, Inc.
- Hardware components may face supply constraints; global operations add complexity.
Okta, Inc.
- Cloud-based service model reduces supply chain risks but depends heavily on data center reliability.
6. ESG & Climate Transition
Fortinet, Inc.
- Energy-intensive hardware production challenges carbon footprint targets.
Okta, Inc.
- Cloud infrastructure focus may offer better ESG adaptability and lower emissions.
7. Geopolitical Exposure
Fortinet, Inc.
- Global footprint exposes firm to trade tensions and regional security risks.
Okta, Inc.
- Primarily US-based with international clients; moderate exposure to geopolitical disruptions.
Which company shows a better risk-adjusted profile?
Fortinet’s primary risk lies in market competition and its stretched valuation metrics despite strong profitability. Okta struggles with profitability and valuation concerns but benefits from a conservative capital structure and lower volatility. Recent ratio data shows Fortinet’s exceptional return on equity (150%) contrasts with Okta’s near breakeven margins. I conclude Fortinet carries more operational and valuation risk, while Okta offers a more balanced risk-adjusted profile amid growth challenges.
Final Verdict: Which stock to choose?
Fortinet’s superpower lies in its robust economic moat, demonstrated by a consistently high ROIC well above its cost of capital. This efficiency fuels strong profitability and cash generation. A point of vigilance is its valuation premium, which could pressure future returns. Fortinet suits portfolios targeting aggressive growth with sustainable competitive advantages.
Okta’s strategic moat is built on its cloud identity platform and recurring revenue streams, offering resilience in subscription-based models. It carries a safer balance sheet risk profile than Fortinet but currently struggles to convert growth into profitability. Okta fits Growth at a Reasonable Price (GARP) portfolios seeking high revenue expansion paired with improving operational metrics.
If you prioritize durable profitability and value creation, Fortinet is the compelling choice due to its efficient capital use and strong margins. However, if you seek rapid top-line growth with a focus on future profitability potential, Okta offers better stability in cash flow and a more conservative financial structure. Each represents a distinct investment scenario aligned with different risk and return appetites.
Disclaimer: Investment carries a risk of loss of initial capital. The past performance is not a reliable indicator of future results. Be sure to understand risks before making an investment decision.
Go Further
I encourage you to read the complete analyses of Fortinet, Inc. and Okta, Inc. to enhance your investment decisions: