Home > Comparison > Technology > FTNT vs ODD
The strategic rivalry between Fortinet, Inc. and Oddity Tech Ltd. shapes the future of the software infrastructure sector. Fortinet operates as a capital-intensive cybersecurity powerhouse with broad, integrated solutions. Oddity Tech, by contrast, is a nimble, digitally native consumer-tech company disrupting beauty and wellness industries. This analysis will assess which business model offers a superior risk-adjusted return, guiding investors seeking durable growth within a dynamic technology landscape.
Table of contents
Companies Overview
Fortinet and Oddity Tech are pivotal players in distinct niches within the technology sector.
Fortinet, Inc.: Cybersecurity Infrastructure Powerhouse
Fortinet dominates the cybersecurity landscape, generating revenue primarily through its integrated security hardware and software solutions. Its core offerings include FortiGate firewalls and FortiAnalyzer management tools, central to protecting enterprise networks. In 2026, Fortinet focuses on expanding automated cybersecurity and scalable network management to meet evolving global threats. This sharp focus reinforces its broad competitive moat in infrastructure security.
Oddity Tech Ltd.: Consumer-Tech Innovator in Beauty and Wellness
Oddity Tech operates at the intersection of technology and consumer beauty products, leveraging its PowerMatch technology to disrupt traditional beauty markets. Revenue flows from digital-first brand sales in skincare and cosmetics under its IL MAKIAGE and SpoiledChild lines. The company’s 2026 strategy prioritizes scaling digital brands to challenge offline incumbents, reflecting a nimble, innovation-driven growth model in consumer tech.
Strategic Collision: Similarities & Divergences
Both companies embed technology deeply but diverge sharply: Fortinet builds a closed ecosystem around cybersecurity hardware/software, while Oddity embraces an open, digital brand-building approach. Their competitive battle exists more in market influence than direct product overlap. Fortinet commands enterprise security budgets; Oddity targets consumer discretionary spend. These differences shape distinct risk-return profiles for investors focused on infrastructure resilience versus digital consumer disruption.
Income Statement Comparison
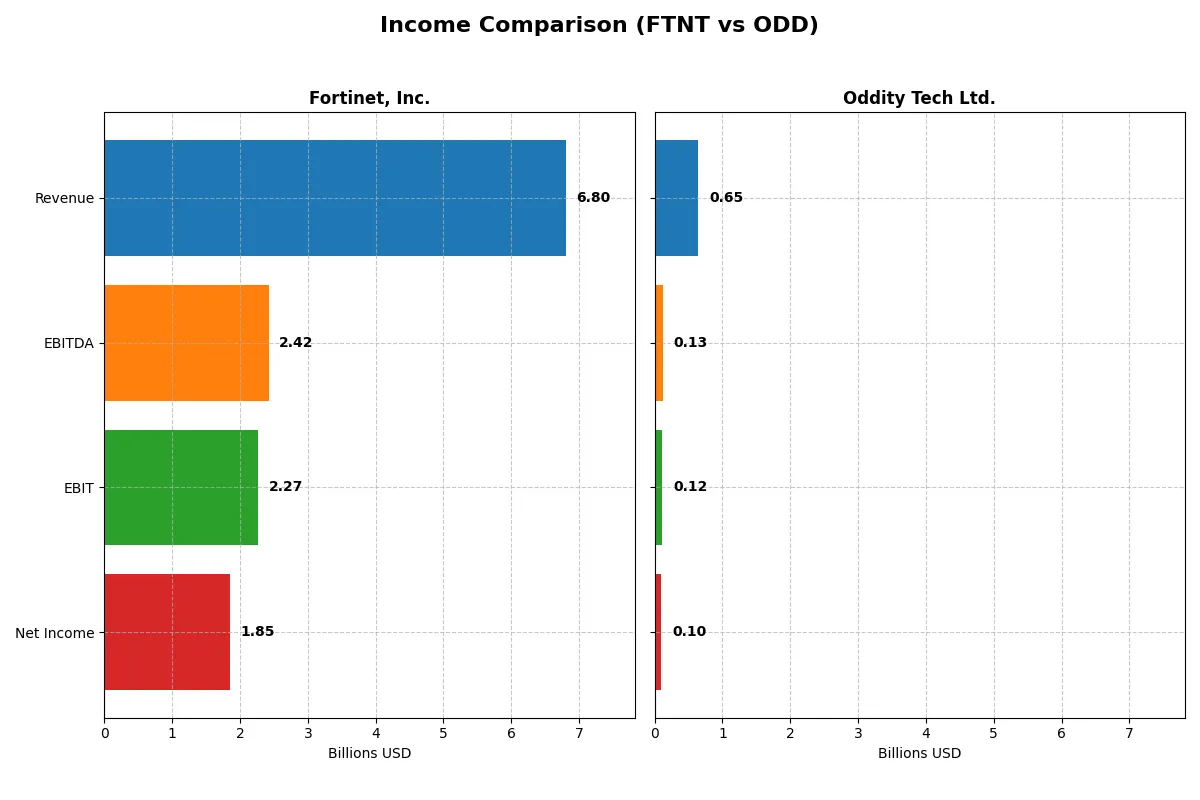
The following data dissects the core profitability and scalability of both corporate engines to reveal who dominates the bottom line:
| Metric | Fortinet, Inc. (FTNT) | Oddity Tech Ltd. (ODD) |
|---|---|---|
| Revenue | 6.8B | 647M |
| Cost of Revenue | 1.3B | 179M |
| Operating Expenses | 3.4B | 353M |
| Gross Profit | 5.5B | 468M |
| EBITDA | 2.4B | 125M |
| EBIT | 2.3B | 116M |
| Interest Expense | 20M | 76K |
| Net Income | 1.9B | 101M |
| EPS | 2.44 | 1.78 |
| Fiscal Year | 2025 | 2024 |
Income Statement Analysis: The Bottom-Line Duel
This income statement comparison reveals which company converts revenue into profit with superior efficiency and sustained momentum.
Fortinet, Inc. Analysis
Fortinet’s revenue climbed from 3.3B in 2021 to nearly 6.8B in 2025, more than doubling over five years. Its net income surged 205% to 1.85B in 2025, supported by a strong gross margin above 80% and a robust net margin near 27%. Despite a slight net margin dip in 2025, Fortinet maintains impressive operating leverage and steady EPS growth.
Oddity Tech Ltd. Analysis
Oddity Tech grew revenue fivefold from 110M in 2020 to 647M in 2024, demonstrating remarkable top-line expansion. Net income expanded over 760% to 101M, with a gross margin of 72% and a net margin of 15.7%, both solid for its scale. Oddity’s EBIT and net margin growth rates outpace Fortinet’s, reflecting aggressive operational scaling and margin improvement.
Growth Scale vs. Margin Strength
Fortinet dominates with superior margins and absolute profit scale, delivering consistent margin expansion and strong cash flow generation. Oddity impresses with explosive revenue and earnings growth but operates at lower overall profitability levels. Investors seeking mature margin power may favor Fortinet, while those prioritizing rapid growth and margin improvement might watch Oddity closely.
Financial Ratios Comparison
These vital ratios act as a diagnostic tool to expose the underlying fiscal health, valuation premiums, and capital efficiency of the companies compared below:
| Ratios | Fortinet, Inc. (FTNT) | Oddity Tech Ltd. (ODD) |
|---|---|---|
| ROE | 1.50 | 0.36 |
| ROIC | 0.29 | 0.29 |
| P/E | 32.48 | 23.75 |
| P/B | 48.64 | 8.54 |
| Current Ratio | 1.17 | 1.79 |
| Quick Ratio | 1.09 | 0.99 |
| D/E | 0.81 | 0.08 |
| Debt-to-Assets | 0.10 | 0.05 |
| Interest Coverage | 104.0 | 1521.1 |
| Asset Turnover | 0.65 | 1.47 |
| Fixed Asset Turnover | 4.20 | 19.38 |
| Payout Ratio | 0 | 0 |
| Dividend Yield | 0 | 0 |
| Fiscal Year | 2025 | 2024 |
Efficiency & Valuation Duel: The Vital Signs
Ratios serve as a company’s financial DNA, exposing hidden risks and operational strengths critical to investment decisions.
Fortinet, Inc.
Fortinet delivers exceptional profitability with a 150% ROE and 27% net margin, signaling operational excellence. However, its valuation is stretched, reflected in a high P/E of 32.5 and a steep P/B of 48.6. The company reinvests earnings heavily into R&D instead of dividends, fueling growth but requiring investor patience.
Oddity Tech Ltd.
Oddity Tech shows solid profitability, with a 36% ROE and a 16% net margin, underpinned by efficient asset use. Its valuation appears more reasonable at a P/E of 23.8 but suffers from a weak P/B of 8.5. The firm retains earnings for growth rather than paying dividends, emphasizing capital reinvestment and operational scaling.
Premium Valuation vs. Operational Safety
Fortinet’s ratios signal high profitability but come at a premium valuation, increasing risk. Oddity Tech balances profitability with more moderate pricing, offering a safer risk-reward profile. Investors seeking robust returns with lower valuation pressure may favor Oddity’s profile, while growth-focused investors might tolerate Fortinet’s stretched multiples.
Which one offers the Superior Shareholder Reward?
I compare Fortinet, Inc. (FTNT) and Oddity Tech Ltd. (ODD) on their shareholder reward strategies. Neither pays dividends, so reinvestment and buybacks drive returns. FTNT’s payout ratio is zero, with no dividends, relying heavily on share repurchases for returns. ODD also pays no dividends but shows a stronger focus on reinvestment, evident from higher free cash flow relative to capex. FTNT’s price-to-free-cash-flow ratio is elevated around 27-38x, signaling premium valuation, while ODD trades at a more modest 18.6x, implying better value. Both companies maintain strong free cash flow coverage, but ODD’s lower debt and higher asset turnover suggest more operational efficiency and sustainable capital allocation. I find ODD’s balanced reinvestment and moderate valuation offer a more attractive total return profile for 2026 investors.
Comparative Score Analysis: The Strategic Profile
The radar chart below reveals the fundamental DNA and trade-offs of Fortinet, Inc. and Oddity Tech Ltd., highlighting their core financial strengths and weaknesses:
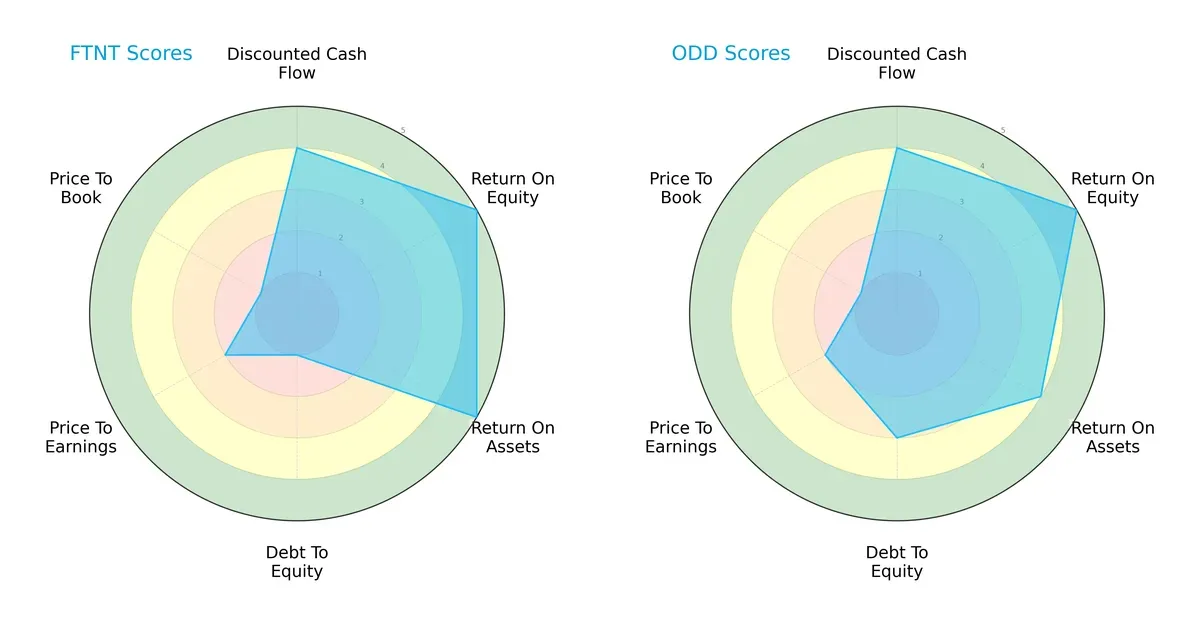
Fortinet and Oddity Tech share equally favorable overall scores and strong ROE (5) and DCF (4) metrics. Fortinet leads in asset efficiency (ROA 5 vs. 4) but carries heavy financial risk with a very unfavorable debt-to-equity score (1 vs. Oddity’s 3). Both struggle on valuation metrics (PE and PB scores low), yet Oddity Tech offers a more balanced financial profile while Fortinet relies on operational efficiency despite leverage concerns.
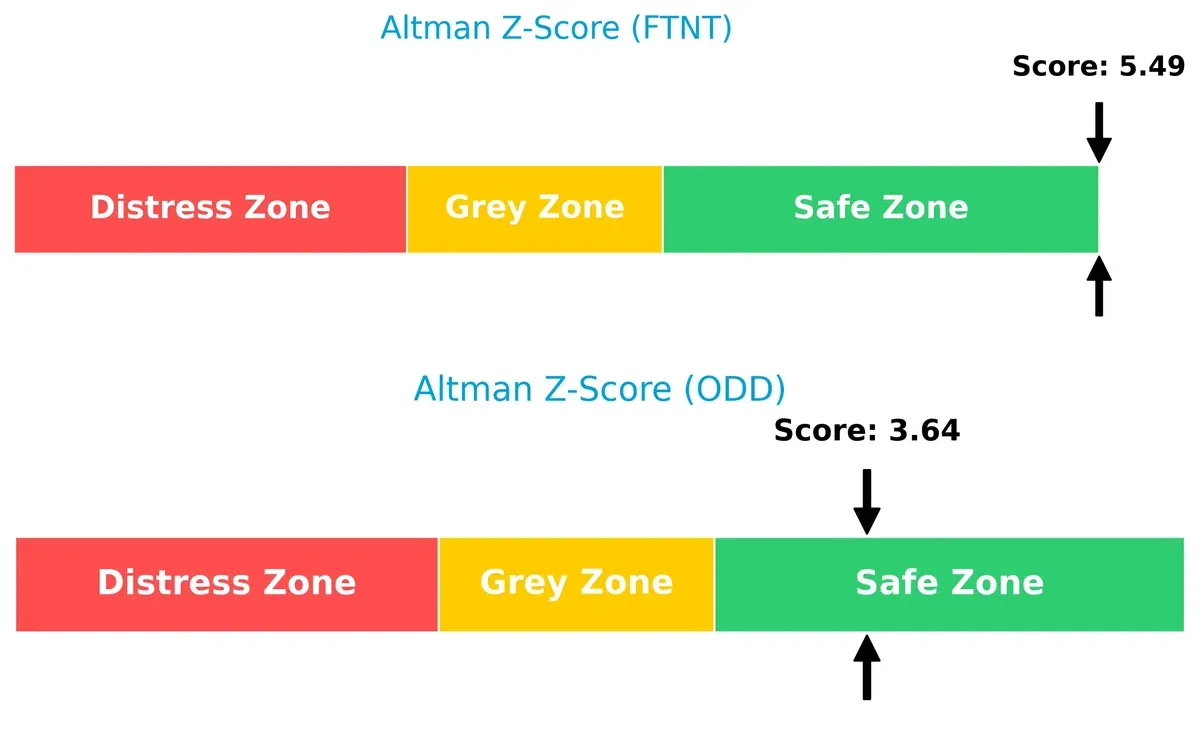
Bankruptcy Risk: Solvency Showdown
Fortinet’s Altman Z-Score at 5.49 surpasses Oddity Tech’s 3.64, both safely above distress thresholds, indicating robust solvency and lower bankruptcy risk in this cycle:
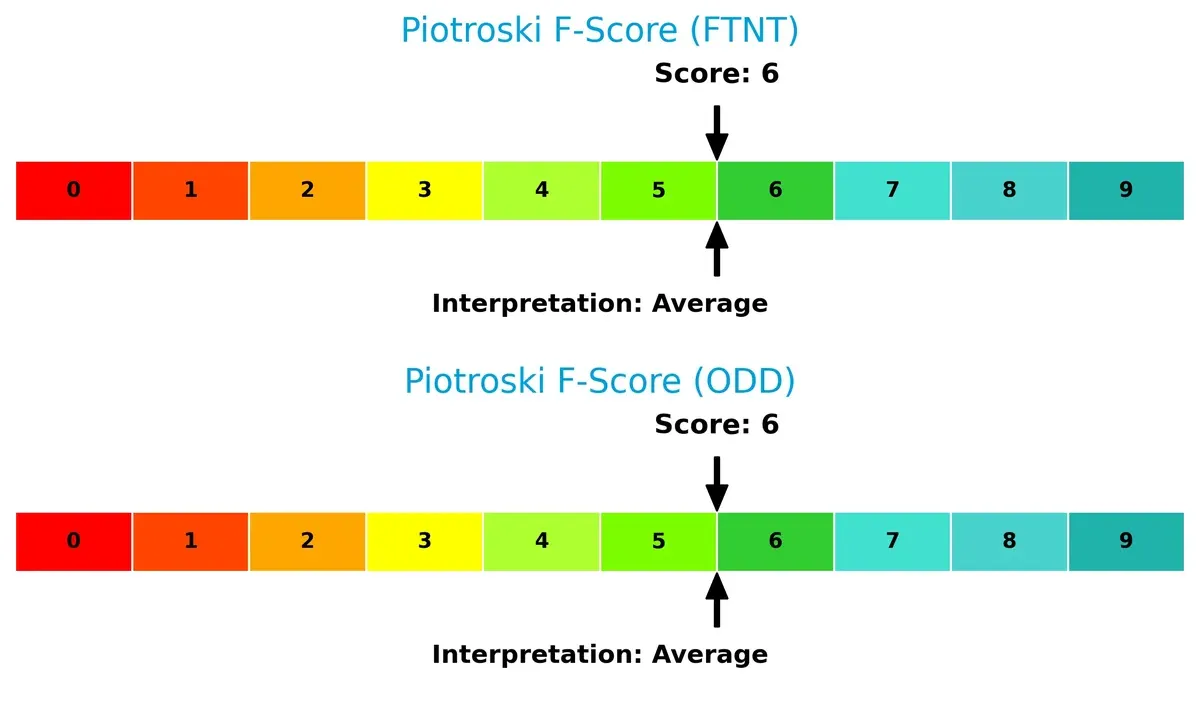
Financial Health: Quality of Operations
Both companies share an average Piotroski F-Score of 6, indicating moderate financial health. Neither firm shows glaring operational red flags, but there remains room for improvement in internal metrics:
How are the two companies positioned?
This section dissects the operational DNA of Fortinet and Oddity Tech by comparing their revenue distribution and internal strengths and weaknesses. The goal is to confront their economic moats to identify which model offers the most resilient, sustainable competitive advantage today.
Revenue Segmentation: The Strategic Mix
This visual comparison dissects how Fortinet, Inc. and Oddity Tech Ltd. diversify their income streams and highlights their primary sector bets:
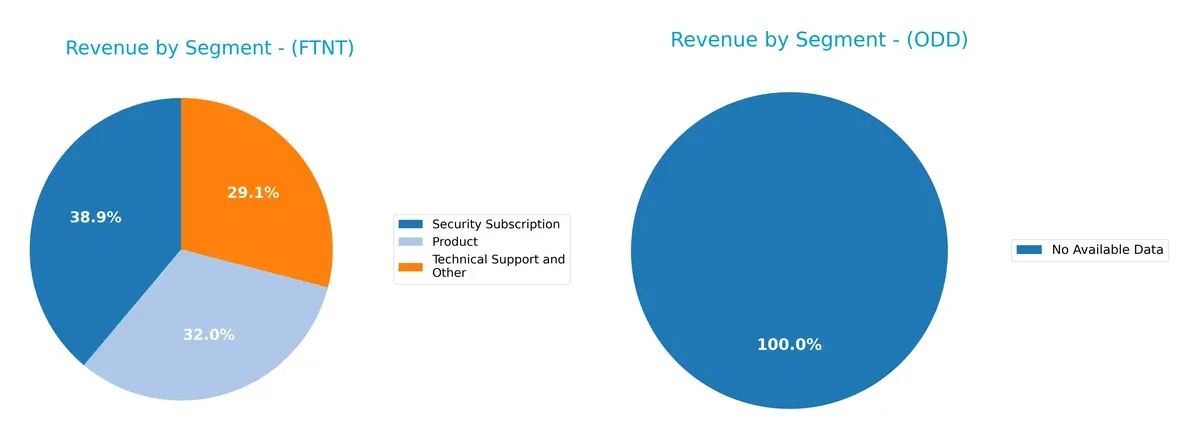
Fortinet anchors its revenue with a balanced mix: $2.3B from Security Subscription, $1.9B from Product sales, and $1.7B from Technical Support in 2024. This diversification reduces concentration risk and strengthens its ecosystem lock-in. Oddity Tech Ltd. lacks available data, preventing a direct comparison. Fortinet’s broad segmentation signals robust infrastructure dominance, positioning it well against sector volatility.
Strengths and Weaknesses Comparison
This table compares the strengths and weaknesses of Fortinet, Inc. and Oddity Tech Ltd.:
Fortinet Strengths
- Diverse revenue from products, subscriptions, and support
- Strong profitability with 27% net margin and 150% ROE
- Global presence across Americas, EMEA, and Asia Pacific
- Favorable financial leverage and interest coverage
- Solid asset turnover and capital efficiency
Oddity Tech Strengths
- Favorable profitability with 16% net margin and 36% ROE
- Very high interest coverage and low debt ratios
- Efficient asset turnover and fixed asset use
- Strong liquidity with current ratio 1.79
- Concentrated presence in North America
Fortinet Weaknesses
- High valuation multiples with PE 32.5 and PB 48.6
- Neutral liquidity ratios may limit short-term flexibility
- No dividend yield
- Moderate debt level (D/E 0.81)
- Limited recent data on geographic revenue growth
Oddity Tech Weaknesses
- High weighted average cost of capital at 18.6%
- Unfavorable PB ratio despite low debt
- Quick ratio below 1 signals potential liquidity risks
- No dividend yield
- Smaller geographic footprint limits global diversification
Fortinet’s strengths lie in its diversified revenue streams and global footprint coupled with strong profitability. Oddity Tech shows excellent capital efficiency and liquidity but faces challenges from high capital costs and limited geographic reach. Both companies lack dividend payouts, which may influence income-focused investors.
The Moat Duel: Analyzing Competitive Defensibility
A structural moat alone shields long-term profits from relentless competitive pressures. Let’s dissect how these firms defend their turf:
Fortinet, Inc.: Integrated Security Network Moat
Fortinet’s moat stems from its comprehensive cybersecurity platform with high switching costs. Its 80.8% gross margin and 33.4% EBIT margin confirm durable pricing power. Expansion into AI-driven threat prevention in 2026 should deepen this advantage.
Oddity Tech Ltd.: Digital Brand & Consumer Network Moat
Oddity leverages digital-first brand power and network effects in beauty tech, contrasting Fortinet’s infrastructure focus. Its 72.4% gross margin and rapid 484% revenue growth showcase scalable consumer loyalty. New product launches could disrupt offline incumbents further.
Defensive Strengths: Infrastructure Dominance vs. Consumer Network Expansion
Fortinet’s wider moat lies in its entrenched infrastructure and high ROIC premium (20.1% above WACC), surpassing Oddity’s 9.9%. Fortinet’s robust profitability better equips it to defend market share amid intensifying cybersecurity threats.
Which stock offers better returns?
The past year shows Fortinet’s stock up 24%, marking a strong but decelerating bull run. Oddity Tech’s shares fell 32%, reflecting a steady bearish trend.
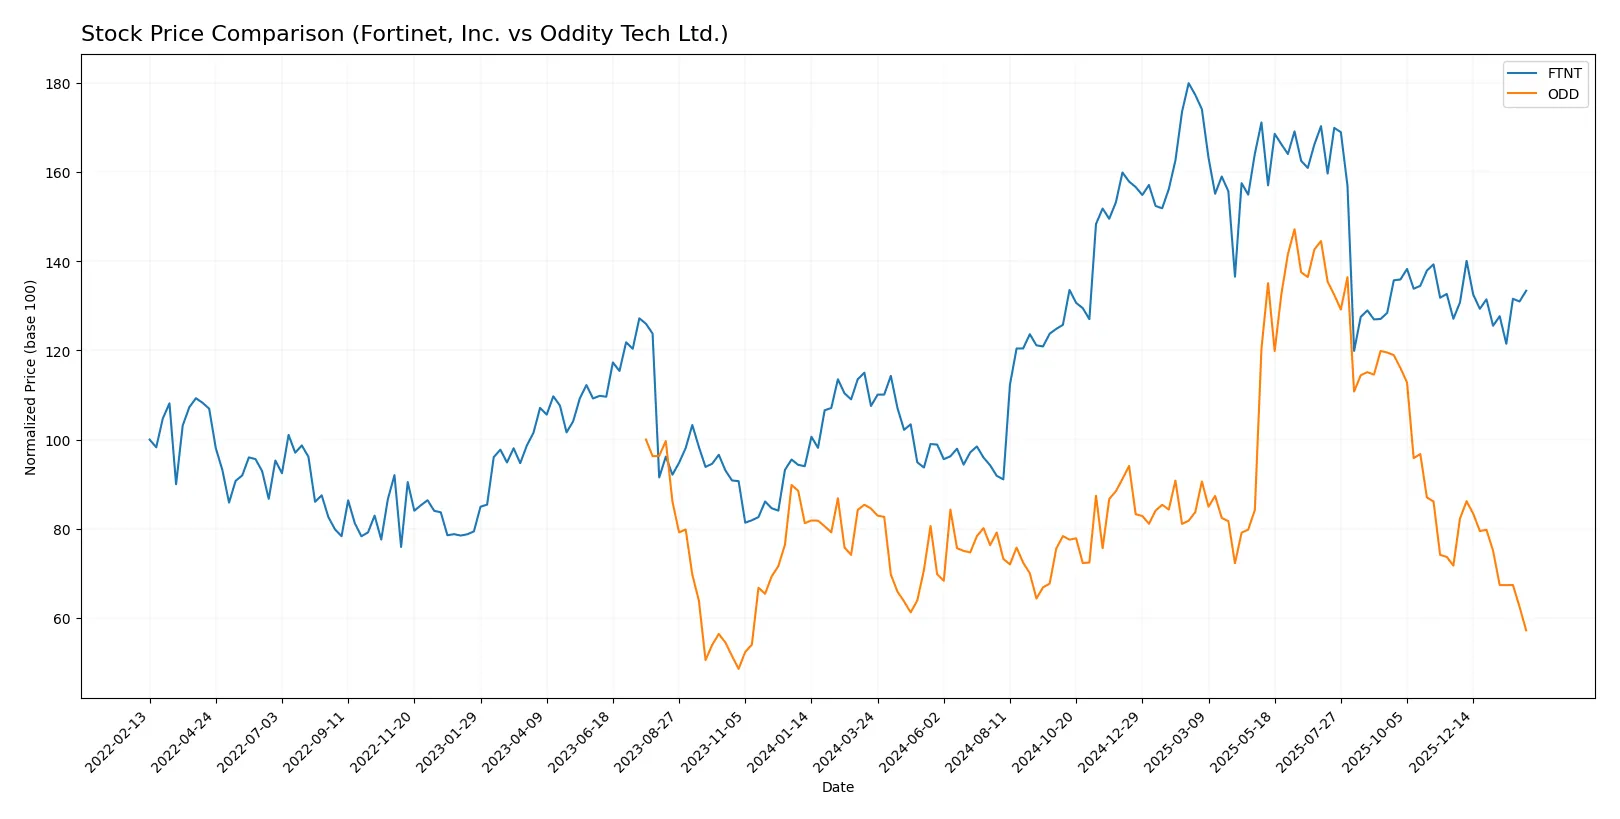
Trend Comparison
Fortinet’s stock rose 24.04% over 12 months, confirming a bullish trend with decelerating momentum. It hit a high of 111.64 and a low of 56.51, with notable volatility at 15.07%.
Oddity Tech’s shares declined 32.32% over the same period, indicating a bearish trend with slowing acceleration. Its price ranged between 30.07 and 77.35, showing a volatility of 11.98%.
Fortinet’s positive 24% gain sharply contrasts with Oddity Tech’s 32% loss, making Fortinet the stronger performer over the past year.
Target Prices
Analysts present a cautiously optimistic consensus for Fortinet and Oddity Tech, reflecting growth potential balanced with sector volatility.
| Company | Target Low | Target High | Consensus |
|---|---|---|---|
| Fortinet, Inc. | 70 | 90 | 85 |
| Oddity Tech Ltd. | 40 | 80 | 63.6 |
Fortinet’s target consensus at 85 suggests upside from the current 82.76 price, signaling steady confidence in its cybersecurity moat. Oddity Tech’s consensus at 63.6 implies significant growth potential versus its 30.07 price, though higher beta signals elevated risk.

Don’t Let Luck Decide Your Entry Point
Optimize your entry points with our advanced ProRealTime indicators. You’ll get efficient buy signals with precise price targets for maximum performance. Start outperforming now!
How do institutions grade them?
Here are the latest institutional grades for Fortinet, Inc. and Oddity Tech Ltd.:
Fortinet, Inc. Grades
This table summarizes recent grades and actions from key grading companies for Fortinet, Inc.
| Grading Company | Action | New Grade | Date |
|---|---|---|---|
| Rosenblatt | Maintain | Buy | 2026-02-06 |
| Mizuho | Maintain | Underperform | 2026-02-06 |
| JP Morgan | Maintain | Underweight | 2026-02-06 |
| RBC Capital | Maintain | Sector Perform | 2026-02-06 |
| Wedbush | Maintain | Outperform | 2026-02-06 |
| Scotiabank | Downgrade | Sector Perform | 2026-02-02 |
| JP Morgan | Maintain | Underweight | 2026-01-30 |
| Rosenblatt | Upgrade | Buy | 2026-01-29 |
| TD Cowen | Upgrade | Buy | 2026-01-23 |
| Citigroup | Maintain | Neutral | 2026-01-13 |
Oddity Tech Ltd. Grades
This table shows recent grades and actions by reputable institutions on Oddity Tech Ltd.
| Grading Company | Action | New Grade | Date |
|---|---|---|---|
| Keybanc | Maintain | Overweight | 2026-01-08 |
| JP Morgan | Maintain | Overweight | 2025-12-12 |
| Barclays | Maintain | Equal Weight | 2025-11-21 |
| JP Morgan | Maintain | Overweight | 2025-11-21 |
| Morgan Stanley | Maintain | Equal Weight | 2025-11-21 |
| Needham | Maintain | Buy | 2025-11-20 |
| Keybanc | Maintain | Overweight | 2025-10-08 |
| JMP Securities | Maintain | Market Outperform | 2025-09-23 |
| Morgan Stanley | Maintain | Equal Weight | 2025-08-06 |
| JMP Securities | Maintain | Market Outperform | 2025-08-05 |
Which company has the best grades?
Fortinet’s grades vary widely, from Buy to Underperform, reflecting mixed institutional views. Oddity Tech consistently receives Overweight and Market Outperform ratings, indicating stronger consensus. Investors may interpret Oddity Tech’s steadier grades as a positive signal for confidence and potential stability.
Risks specific to each company
The following categories identify the critical pressure points and systemic threats facing both firms in the 2026 market environment:
1. Market & Competition
Fortinet, Inc.
- Established cybersecurity leader with broad integrated solutions; faces intense competition in a mature market.
Oddity Tech Ltd.
- Consumer-tech disruptor in beauty and wellness; highly volatile market with aggressive digital-first competitors.
2. Capital Structure & Debt
Fortinet, Inc.
- Moderate debt-to-equity at 0.81; interest coverage very strong at 113x; balanced leverage but debt score unfavorable.
Oddity Tech Ltd.
- Very low debt-to-equity at 0.08 and excellent interest coverage over 1500x; financially conservative structure.
3. Stock Volatility
Fortinet, Inc.
- Beta near market average at 1.05; moderate volatility reflecting steady growth profile.
Oddity Tech Ltd.
- High beta at 3.19; stock highly sensitive to market swings and investor sentiment.
4. Regulatory & Legal
Fortinet, Inc.
- Operates globally in cybersecurity, facing rigorous data privacy and export control regulations.
Oddity Tech Ltd.
- Consumer products company exposed to complex international regulations and compliance risks.
5. Supply Chain & Operations
Fortinet, Inc.
- Complex hardware/software supply chain; potential disruptions could impact product delivery and innovation cadence.
Oddity Tech Ltd.
- Reliant on global sourcing for beauty products; supply chain susceptible to cost inflation and delays.
6. ESG & Climate Transition
Fortinet, Inc.
- Technology sector pressure to improve energy efficiency and data center sustainability.
Oddity Tech Ltd.
- Increasing demand for ESG-compliant beauty products; climate transition impacts material sourcing.
7. Geopolitical Exposure
Fortinet, Inc.
- Global footprint includes sensitive regions; geopolitical tensions could disrupt sales and partnerships.
Oddity Tech Ltd.
- Headquarters in Israel with global operations; geopolitical risks may affect supply chains and market access.
Which company shows a better risk-adjusted profile?
Fortinet’s moderate leverage and stable market position mitigate risks despite competitive pressures. Oddity’s high volatility and regulatory complexity increase risk, but its low debt and strong coverage support resilience. I see Fortinet as having a slightly better risk-adjusted profile for 2026. The primary risk for Fortinet lies in market competition and regulatory compliance, while Oddity faces significant stock volatility and geopolitical uncertainties. Oddity’s beta of 3.19 versus Fortinet’s 1.05 justifies my caution on Oddity’s risk exposure.
Final Verdict: Which stock to choose?
Fortinet, Inc. excels as a cash-generating powerhouse with a robust moat driven by superior capital efficiency and an expanding ROIC well above its cost of capital. Its main point of vigilance lies in a stretched valuation, which demands careful timing. It fits a portfolio seeking aggressive growth with tolerance for premium pricing.
Oddity Tech Ltd. offers a strategic moat anchored in operational agility and solid asset turnover, delivering impressive growth metrics and a favorable safety profile relative to Fortinet. It suits investors focused on GARP strategies who value steady revenue expansion combined with better balance sheet stability.
If you prioritize aggressive growth underpinned by a proven value creator with strong profitability, Fortinet outshines due to its sustainable competitive advantage and cash flow dominance. However, if you seek a growth-at-a-reasonable-price profile emphasizing operational efficiency and balance sheet strength, Oddity Tech provides better stability despite recent price weakness.
Disclaimer: Investment carries a risk of loss of initial capital. The past performance is not a reliable indicator of future results. Be sure to understand risks before making an investment decision.
Go Further
I encourage you to read the complete analyses of Fortinet, Inc. and Oddity Tech Ltd. to enhance your investment decisions: