Home > Comparison > Technology > FTNT vs NTNX
The strategic rivalry between Fortinet, Inc. and Nutanix, Inc. shapes the evolving landscape of technology infrastructure software. Fortinet, a cybersecurity powerhouse, focuses on integrated security hardware and software solutions. Nutanix, by contrast, operates as an enterprise cloud platform innovator emphasizing virtualization and cloud orchestration. This analysis pits Fortinet’s security resilience against Nutanix’s hybrid cloud agility to identify which offers a superior risk-adjusted return in a diversified portfolio.
Table of contents
Companies Overview
Fortinet and Nutanix stand as pivotal players in the software infrastructure sector, shaping enterprise technology landscapes globally.
Fortinet, Inc.: Cybersecurity Infrastructure Leader
Fortinet dominates the cybersecurity market with a broad suite of integrated and automated security solutions. Its revenue flows primarily from hardware and software licenses, including firewalls, endpoint protection, and multi-factor authentication products. In 2026, Fortinet’s strategic focus centers on expanding its security subscription services and scaling enterprise adoption across diverse industries.
Nutanix, Inc.: Enterprise Cloud Platform Innovator
Nutanix leads in enterprise cloud infrastructure by providing a software-driven cloud platform that integrates virtualization, storage, and hybrid cloud orchestration. Revenue comes from software licenses and support services tailored to streamline cloud-native environment management. The company’s 2026 strategy emphasizes automation and hybrid cloud solutions to enhance operational efficiency for large enterprises.
Strategic Collision: Similarities & Divergences
Both companies compete in software infrastructure but differ sharply in approach: Fortinet secures networks with a closed and comprehensive cybersecurity ecosystem, while Nutanix pushes an open, flexible cloud infrastructure platform. Their battleground lies in enterprise IT modernization, with Fortinet defending data integrity and Nutanix enabling cloud agility. These distinct models create contrasting investment profiles—security resilience versus cloud innovation.
Income Statement Comparison
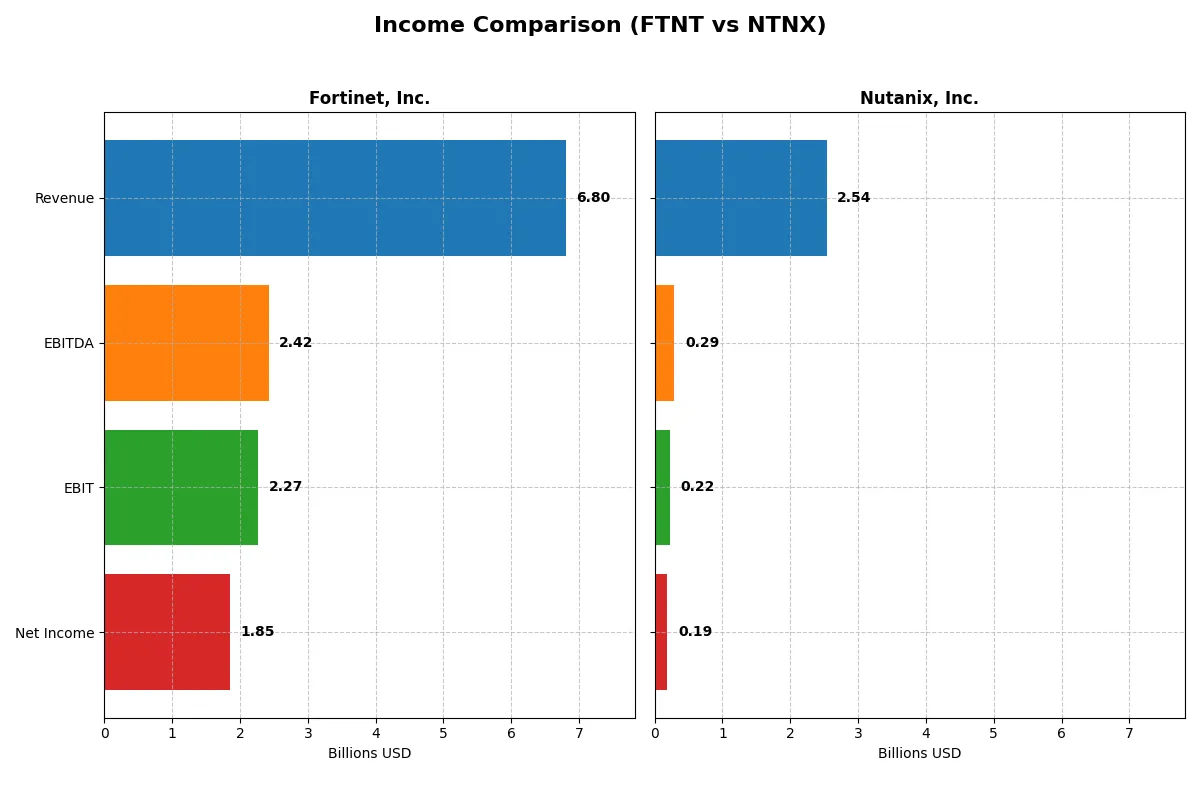
This data dissects the core profitability and scalability of both corporate engines to reveal who dominates the bottom line:
| Metric | Fortinet, Inc. (FTNT) | Nutanix, Inc. (NTNX) |
|---|---|---|
| Revenue | 6.8B | 2.5B |
| Cost of Revenue | 1.3B | 335M |
| Operating Expenses | 3.4B | 2.0B |
| Gross Profit | 5.5B | 2.2B |
| EBITDA | 2.4B | 293M |
| EBIT | 2.3B | 220M |
| Interest Expense | 20M | 20M |
| Net Income | 1.9B | 188M |
| EPS | 2.44 | 0.70 |
| Fiscal Year | 2025 | 2025 |
Income Statement Analysis: The Bottom-Line Duel
This income statement comparison reveals how efficiently each company converts sales into profit, highlighting operational strengths and weaknesses.
Fortinet, Inc. Analysis
Fortinet’s revenue has more than doubled from 3.3B in 2021 to nearly 6.8B in 2025, with net income tripling to 1.85B. Its gross margin consistently exceeds 80%, and the net margin remains robust around 27%, signaling strong cost control. In 2025, Fortinet maintains momentum with a 14% revenue growth and solid operating efficiency, despite a slight dip in net margin.
Nutanix, Inc. Analysis
Nutanix shows steady revenue growth from 1.39B in 2021 to 2.54B in 2025, improving net income from heavy losses to 188M. The company operates with a higher gross margin near 87%, but its EBIT margin lags at 8.7%, reflecting ongoing operating cost challenges. The sharp turnaround in 2025 margins and earnings shows improving efficiency and a positive earnings trajectory.
Margin Power vs. Profit Turnaround
Fortinet dominates with superior net margins and consistent profit expansion, reflecting a mature and efficient business model. Nutanix impresses with rapid margin and earnings improvement from losses but remains behind on absolute profitability. Investors seeking stable, high-margin growth may favor Fortinet, while those targeting a growth rebound profile might watch Nutanix’s continued recovery closely.
Financial Ratios Comparison
These vital ratios act as a diagnostic tool to expose the underlying fiscal health, valuation premiums, and capital efficiency of the companies compared below:
| Ratios | Fortinet, Inc. (FTNT) | Nutanix, Inc. (NTNX) |
|---|---|---|
| ROE | 150% | -27% |
| ROIC | 29% | 8% |
| P/E | 32.5 | 107 |
| P/B | 48.6 | -29 |
| Current Ratio | 1.17 | 1.72 |
| Quick Ratio | 1.09 | 1.72 |
| D/E (Debt/Equity) | 0.81 | -2.14 |
| Debt-to-Assets | 9.6% | 45.2% |
| Interest Coverage | 104 | 8.7 |
| Asset Turnover | 0.65 | 0.77 |
| Fixed Asset Turnover | 4.20 | 9.15 |
| Payout Ratio | 0 | 0 |
| Dividend Yield | 0 | 0 |
| Fiscal Year | 2025 | 2025 |
Efficiency & Valuation Duel: The Vital Signs
Financial ratios serve as a company’s DNA, uncovering hidden risks and operational strengths crucial for investment decisions.
Fortinet, Inc.
Fortinet displays exceptional profitability with a ROE of 150% and a strong net margin of 27.3%. However, its valuation is stretched, reflected in a high P/E of 32.5 and a P/B of 48.6. The company does not pay dividends but efficiently reinvests in R&D, fueling growth and sustaining high returns on invested capital.
Nutanix, Inc.
Nutanix shows modest profitability, with a negative ROE of -27.1% and a low net margin of 7.4%. Its valuation appears expensive, featuring a P/E of 106.7 despite a favorable P/B ratio. Nutanix also refrains from dividends, focusing heavily on R&D investments to support future innovation and operational improvements amid financial challenges.
Premium Valuation vs. Operational Safety
Fortinet offers superior profitability and reinvestment efficiency but trades at a premium valuation. Nutanix presents a riskier profile with weaker returns and a high P/E, balanced by strong liquidity and favorable capital structure. Investors seeking operational strength might prefer Fortinet’s profile, while those tolerating risk may watch Nutanix’s growth potential.
Which one offers the Superior Shareholder Reward?
Fortinet and Nutanix both forgo dividends, focusing on reinvestment and buybacks for shareholder returns. Fortinet’s free cash flow (FCF) coverage is robust at 86%, supporting steady buybacks. Nutanix shows stronger buyback intensity but weaker margins and volatile profitability. I find Fortinet’s distribution model more sustainable and attractive for long-term total returns in 2026.
Comparative Score Analysis: The Strategic Profile
The radar chart reveals the fundamental DNA and trade-offs of Fortinet, Inc. and Nutanix, Inc., highlighting their financial strengths and vulnerabilities:
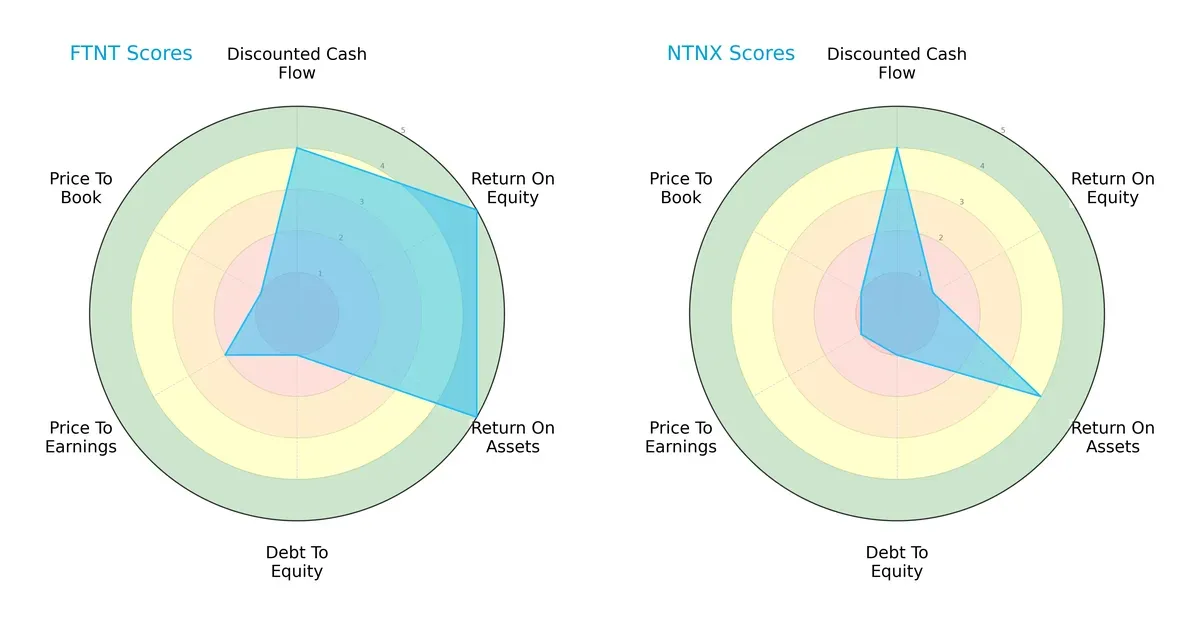
Fortinet shows a balanced profile with strong ROE (5) and ROA (5), indicating efficient profit generation and asset use. Nutanix lags with a weak ROE (1), signaling struggles in shareholder returns. Both face significant leverage risk, scoring poorly on debt-to-equity (1). Valuation metrics (P/E and P/B) are unfavorable for both, but Fortinet’s overall score (3) outperforms Nutanix (2), reflecting a more resilient financial structure.
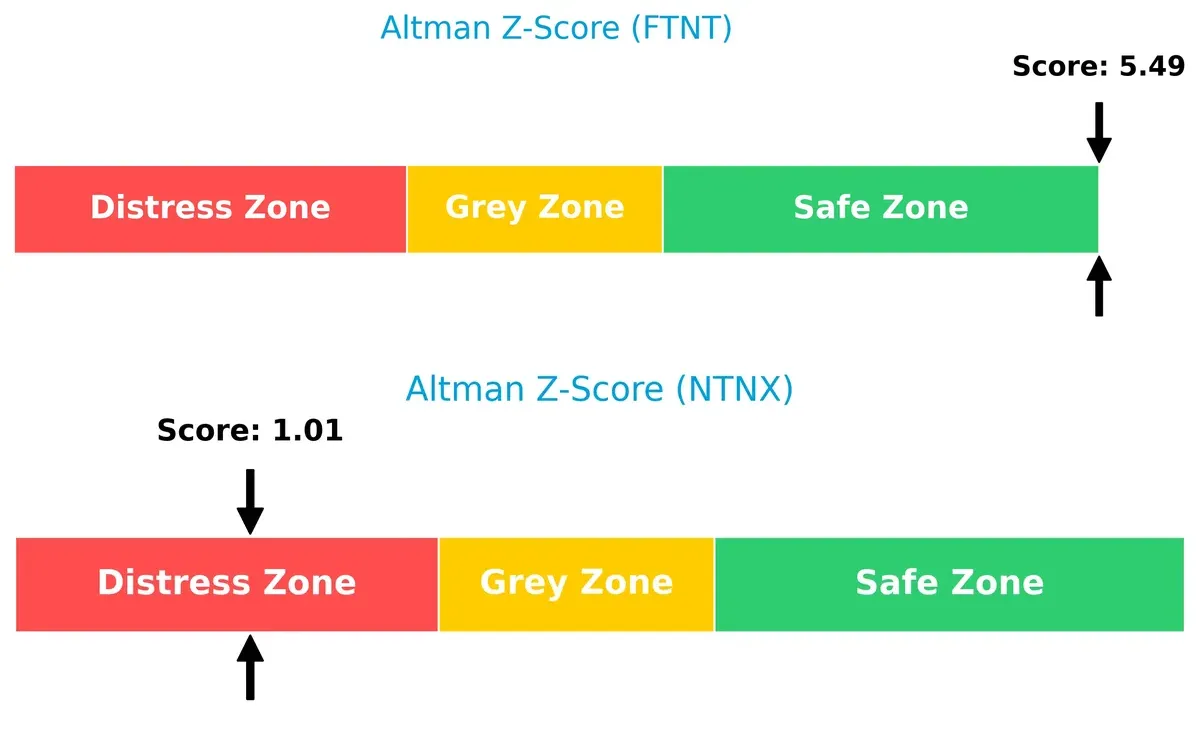
Bankruptcy Risk: Solvency Showdown
Fortinet’s Altman Z-Score of 5.49 places it firmly in the safe zone, while Nutanix’s 1.01 signals distress; this gap highlights Fortinet’s superior long-term survival prospects in volatile markets:
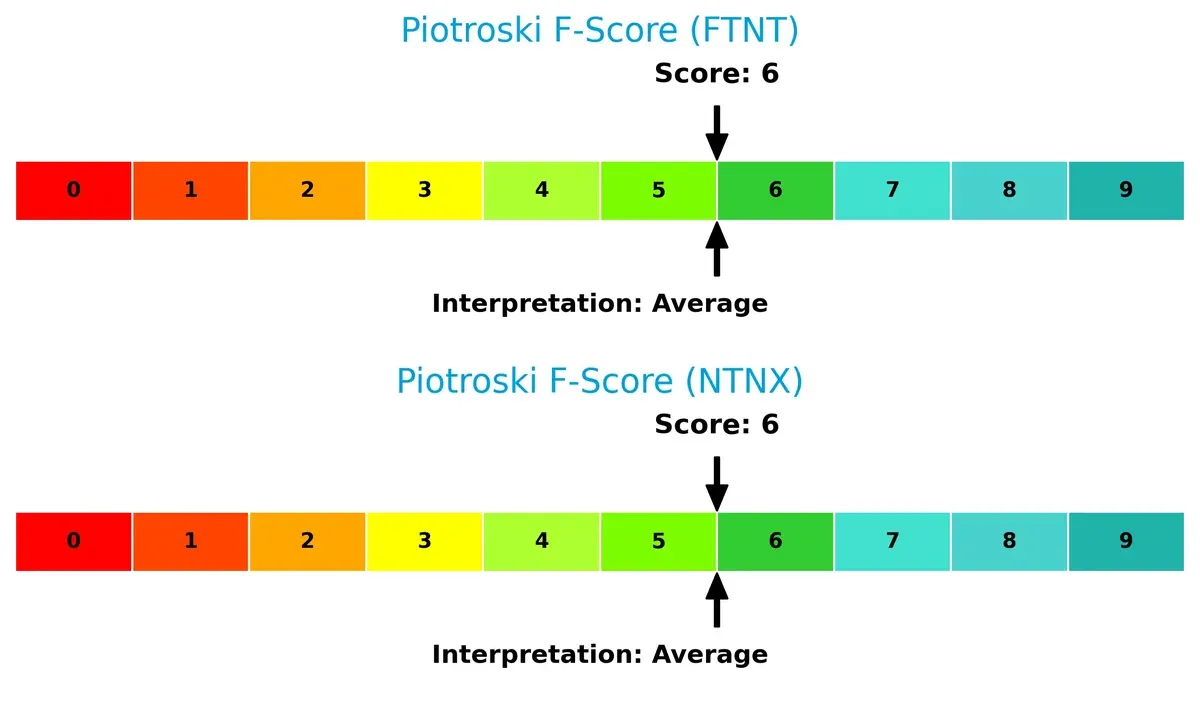
Financial Health: Quality of Operations
Both companies share a Piotroski F-Score of 6, indicating average financial health. Neither shows critical red flags, but neither stands out as a peak performer either:
How are the two companies positioned?
This section dissects Fortinet and Nutanix’s operational DNA by comparing their revenue distribution and internal strengths and weaknesses. The goal is to confront their economic moats to reveal which model offers the most resilient competitive advantage.
Revenue Segmentation: The Strategic Mix
This visual comparison dissects how Fortinet, Inc. and Nutanix, Inc. diversify their income streams and where their primary sector bets lie:
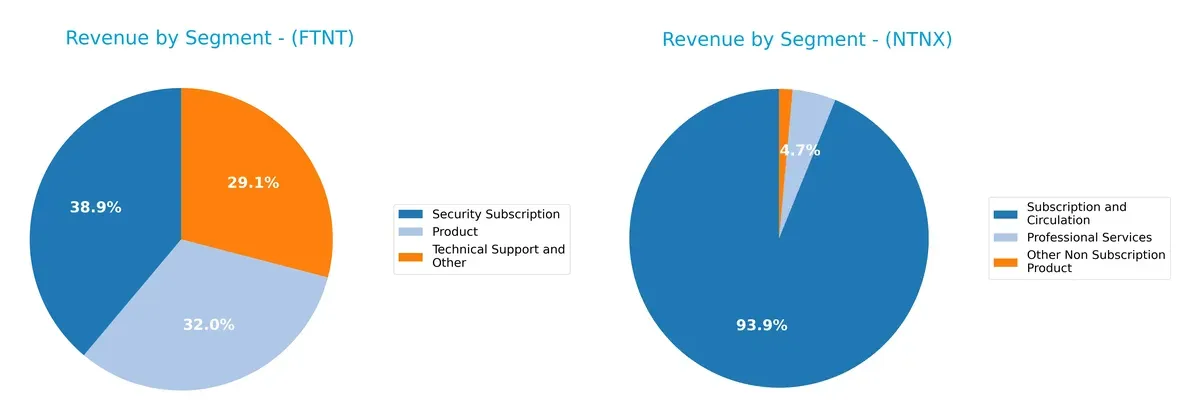
Fortinet anchors its revenue with Security Subscription at $2.3B in 2024, closely matched by Product at $1.9B and Technical Support at $1.7B, showcasing a balanced mix. Nutanix, by contrast, pivots heavily on Subscription and Circulation at $2.0B, dwarfing Professional Services ($101M) and Other Non-Subscription Products ($31M). Fortinet’s diverse streams reduce concentration risk, while Nutanix relies on ecosystem lock-in through subscription dominance.
Strengths and Weaknesses Comparison
This table compares the Strengths and Weaknesses of Fortinet, Inc. and Nutanix, Inc.:
Fortinet Strengths
- Strong profitability with 27.26% net margin
- Very high ROE at 149.77%
- Favorable ROIC at 28.76%
- Well-diversified revenue streams including products and subscriptions
- Global presence with balanced Americas, EMEA, Asia revenue
- Favorable interest coverage at 112.99
Nutanix Strengths
- Favorable capital costs with 5.76% WACC
- Strong liquidity with 1.72 current and quick ratios
- Favorable debt to equity ratio at -2.14
- High fixed asset turnover at 9.15
- Diverse revenue from subscriptions and professional services
- Significant U.S. market share with 1.19B revenue
Fortinet Weaknesses
- High valuation metrics with PE 32.48 and PB 48.64
- No dividend yield
- Moderate current ratio at 1.17
- Debt to equity at 0.81 could imply leverage risks
- Asset turnover neutral at 0.65
Nutanix Weaknesses
- Negative ROE at -27.12% indicates profitability issues
- Very high PE ratio of 106.74
- No dividend yield
- Debt to assets high at 45.16%
- Net margin only 7.42% neutral status
Fortinet shows strong profitability and balanced geographic revenue but faces high valuation and moderate liquidity risks. Nutanix demonstrates solid liquidity and favorable capital structure but struggles with profitability and high valuation multiples. These factors shape each company’s strategic financial positioning.
The Moat Duel: Analyzing Competitive Defensibility
A structural moat shields long-term profits from relentless competitive pressure. Only a durable advantage secures sustainable earnings growth:
Fortinet, Inc.: Dominant Switching Costs Protector
Fortinet’s moat lies in high switching costs from its integrated cybersecurity platform. Its 33% EBIT margin and growing ROIC (+63%) show efficient capital use. Expansion into cloud security deepens this moat in 2026.
Nutanix, Inc.: Emerging Hybrid Cloud Innovator
Nutanix leverages hybrid cloud orchestration as its moat, contrasting Fortinet’s security focus. Despite a lower EBIT margin (8.7%), its ROIC growth (+117%) signals rising value creation. Continued Kubernetes automation offers significant expansion potential.
Defensive Moats: Switching Costs vs. Hybrid Cloud Innovation
Fortinet’s wider moat stems from entrenched switching costs and superior profitability. Nutanix’s moat is narrower but rapidly strengthening with innovative cloud solutions. Fortinet remains better positioned to defend its market share.
Which stock offers better returns?
The past year shows Fortinet’s stock rising significantly, while Nutanix faces a steep decline, reflecting contrasting trading dynamics and momentum shifts.
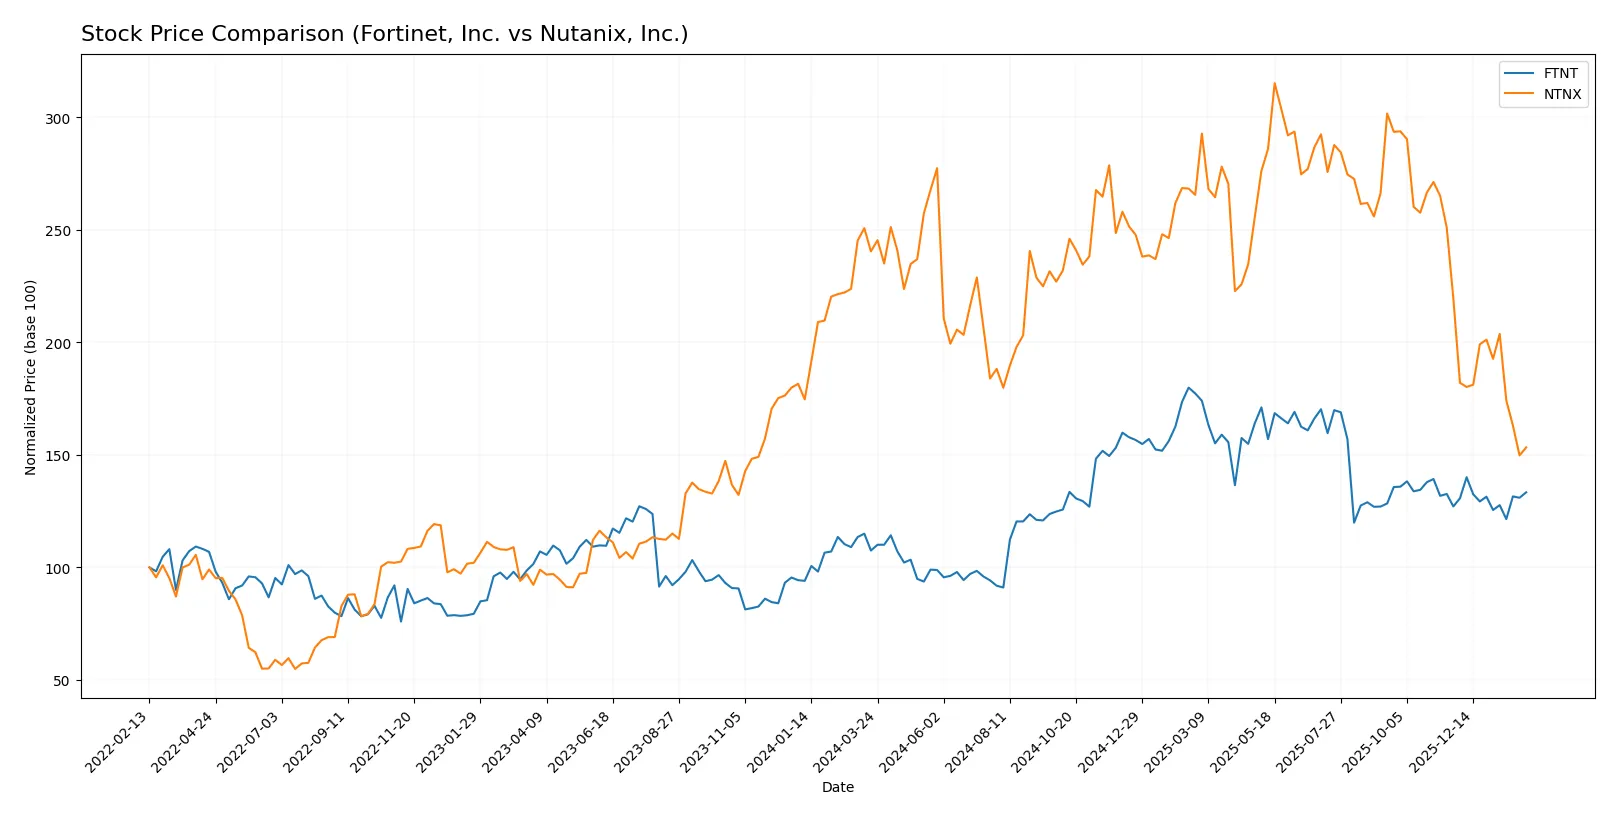
Trend Comparison
Fortinet’s stock increased 24.04% over the past 12 months, marking a bullish trend with decelerating momentum and a high volatility level of 15.07%. The price peaked at 111.64 and bottomed at 56.51.
Nutanix’s stock dropped 36.24% over the same period, indicating a bearish trend with decelerating decline and less volatility at 9.56%. The price ranged from a high of 82.77 to a low of 39.33.
Comparing both, Fortinet delivered the highest market performance, outperforming Nutanix by a wide margin during the past year.
Target Prices
Analysts present a moderately optimistic consensus for Fortinet, Inc. and Nutanix, Inc.
| Company | Target Low | Target High | Consensus |
|---|---|---|---|
| Fortinet, Inc. | 70 | 90 | 85 |
| Nutanix, Inc. | 53 | 90 | 64.67 |
Fortinet’s target consensus at $85 slightly exceeds its current price of $82.76, signaling modest upside. Nutanix’s consensus at $64.67 implies substantial growth from its $40.26 price, reflecting higher risk but potential reward.

Don’t Let Luck Decide Your Entry Point
Optimize your entry points with our advanced ProRealTime indicators. You’ll get efficient buy signals with precise price targets for maximum performance. Start outperforming now!
How do institutions grade them?
Fortinet, Inc. Grades
Below is a summary of recent institutional grades for Fortinet, Inc.:
| Grading Company | Action | New Grade | Date |
|---|---|---|---|
| Rosenblatt | Maintain | Buy | 2026-02-06 |
| Mizuho | Maintain | Underperform | 2026-02-06 |
| JP Morgan | Maintain | Underweight | 2026-02-06 |
| RBC Capital | Maintain | Sector Perform | 2026-02-06 |
| Wedbush | Maintain | Outperform | 2026-02-06 |
| Scotiabank | Downgrade | Sector Perform | 2026-02-02 |
| JP Morgan | Maintain | Underweight | 2026-01-30 |
| Rosenblatt | Upgrade | Buy | 2026-01-29 |
| TD Cowen | Upgrade | Buy | 2026-01-23 |
| Citigroup | Maintain | Neutral | 2026-01-13 |
Nutanix, Inc. Grades
The table below reflects the latest institution-issued grades for Nutanix, Inc.:
| Grading Company | Action | New Grade | Date |
|---|---|---|---|
| Barclays | Downgrade | Equal Weight | 2026-01-15 |
| Morgan Stanley | Downgrade | Equal Weight | 2026-01-12 |
| RBC Capital | Maintain | Outperform | 2026-01-05 |
| Goldman Sachs | Maintain | Buy | 2025-11-28 |
| Morgan Stanley | Maintain | Overweight | 2025-11-26 |
| B of A Securities | Maintain | Buy | 2025-11-26 |
| Keybanc | Maintain | Overweight | 2025-11-26 |
| Needham | Maintain | Buy | 2025-11-26 |
| Wells Fargo | Maintain | Equal Weight | 2025-11-26 |
| Northland Capital Markets | Maintain | Market Perform | 2025-11-26 |
Which company has the best grades?
Fortinet shows a mixed but generally positive sentiment with multiple “Buy” and “Outperform” ratings. Nutanix maintains several “Buy” and “Outperform” grades but recent downgrades to “Equal Weight” indicate cautious views. Investors should weigh these nuanced signals carefully.
Risks specific to each company
The following categories identify the critical pressure points and systemic threats facing both firms in the 2026 market environment:
1. Market & Competition
Fortinet, Inc.
- Strong cybersecurity niche with broad integrated solutions; faces intense competition from established giants and innovative startups.
Nutanix, Inc.
- Enterprise cloud platform with diverse services; competes in a crowded hybrid cloud market with tech giants and smaller cloud-native firms.
2. Capital Structure & Debt
Fortinet, Inc.
- Moderate debt-to-equity ratio (0.81) with strong interest coverage (113x) indicates solid debt management.
Nutanix, Inc.
- Negative debt-to-equity ratio (-2.14) suggests unusual capital structure; interest coverage at 11x is adequate but warrants caution.
3. Stock Volatility
Fortinet, Inc.
- Beta near 1.05 implies market-level volatility, typical for tech infrastructure firms.
Nutanix, Inc.
- Low beta of 0.48 signals lower volatility but may reflect less investor confidence or liquidity concerns.
4. Regulatory & Legal
Fortinet, Inc.
- Operates globally in cybersecurity, exposed to evolving data privacy laws and cross-border compliance risks.
Nutanix, Inc.
- Faces regulatory scrutiny in cloud data governance; compliance complexity rises with multi-region service delivery.
5. Supply Chain & Operations
Fortinet, Inc.
- Dependence on hardware components creates potential supply chain bottlenecks amid global shortages.
Nutanix, Inc.
- Software-centric model reduces hardware risk but depends heavily on cloud providers’ stability and service continuity.
6. ESG & Climate Transition
Fortinet, Inc.
- Cybersecurity solutions crucial for digital trust; however, hardware production impacts environmental footprint.
Nutanix, Inc.
- Cloud platform efficiency aids customers’ energy transition; faces pressure to improve internal carbon metrics.
7. Geopolitical Exposure
Fortinet, Inc.
- Extensive international presence exposes it to trade tensions, sanctions, and cybersecurity geopolitical risks.
Nutanix, Inc.
- Global operations in cloud services face risks from data localization laws and geopolitical cloud access restrictions.
Which company shows a better risk-adjusted profile?
Fortinet’s most impactful risk lies in fierce cybersecurity market competition and hardware supply chain constraints. Nutanix’s principal risk comes from financial distress signals, notably its Altman Z-score in the distress zone and unusual capital structure. Fortinet’s robust interest coverage and safer Altman Z-score underpin a stronger risk-adjusted profile. The stark contrast in bankruptcy risk scores justifies heightened caution on Nutanix despite its favorable cloud positioning.
Final Verdict: Which stock to choose?
Fortinet, Inc. shines as a cash machine with a robust economic moat backed by a soaring ROIC well above its cost of capital. Its unmatched efficiency drives consistent value creation, though investors should watch its stretched valuation multiples. It fits best in aggressive growth portfolios seeking durable profitability.
Nutanix, Inc. leverages a strategic moat through rapid innovation and cloud infrastructure positioning, supported by solid liquidity and a more conservative balance sheet. Relative to Fortinet, it offers a safer profile but struggles with profitability and elevated leverage. It suits GARP portfolios balancing growth potential and risk control.
If you prioritize sustained value creation and market leadership, Fortinet outshines as the compelling choice due to its superior profitability and operational efficiency. However, if you seek growth with a focus on balance sheet stability and innovation upside, Nutanix offers better stability despite near-term profitability challenges. Both present distinct analytical scenarios for investors aligned with different risk-return appetites.
Disclaimer: Investment carries a risk of loss of initial capital. The past performance is not a reliable indicator of future results. Be sure to understand risks before making an investment decision.
Go Further
I encourage you to read the complete analyses of Fortinet, Inc. and Nutanix, Inc. to enhance your investment decisions: