Home > Comparison > Technology > FTNT vs MDB
The strategic rivalry between Fortinet, Inc. and MongoDB, Inc. shapes the evolving landscape of technology infrastructure software. Fortinet operates as a capital-intensive cybersecurity hardware and software provider, while MongoDB delivers a high-margin, cloud-centric database platform. This head-to-head contrasts Fortinet’s integrated security ecosystem against MongoDB’s scalable, multi-cloud database solutions. This analysis seeks to identify which company offers the superior risk-adjusted return for a diversified portfolio in today’s dynamic tech sector.
Table of contents
Companies Overview
Fortinet and MongoDB command critical positions in the global software infrastructure sector.
Fortinet, Inc.: Cybersecurity Powerhouse
Fortinet leads in cybersecurity solutions, specializing in integrated and automated security products. Its revenue stems from hardware and software licenses, including firewalls and endpoint protection. In 2026, Fortinet focuses on expanding its FortiGate product suite and enhancing network security analytics to meet rising global threats.
MongoDB, Inc.: Database Innovator
MongoDB dominates the database platform space with its commercial servers and cloud-based Atlas service. It generates income by offering enterprise database solutions across cloud, on-premise, and hybrid deployments. In 2026, MongoDB emphasizes multi-cloud scalability and developer-friendly tools to capture enterprise digital transformation demands.
Strategic Collision: Similarities & Divergences
Fortinet and MongoDB both target enterprise IT infrastructure but diverge in core philosophies. Fortinet champions a security-first ecosystem with comprehensive threat management, while MongoDB pursues an open, flexible database platform for developers. Their competition centers on cloud infrastructure dominance. Fortinet offers a defensive moat through cybersecurity breadth, whereas MongoDB’s growth hinges on database innovation and cloud adoption.
Income Statement Comparison
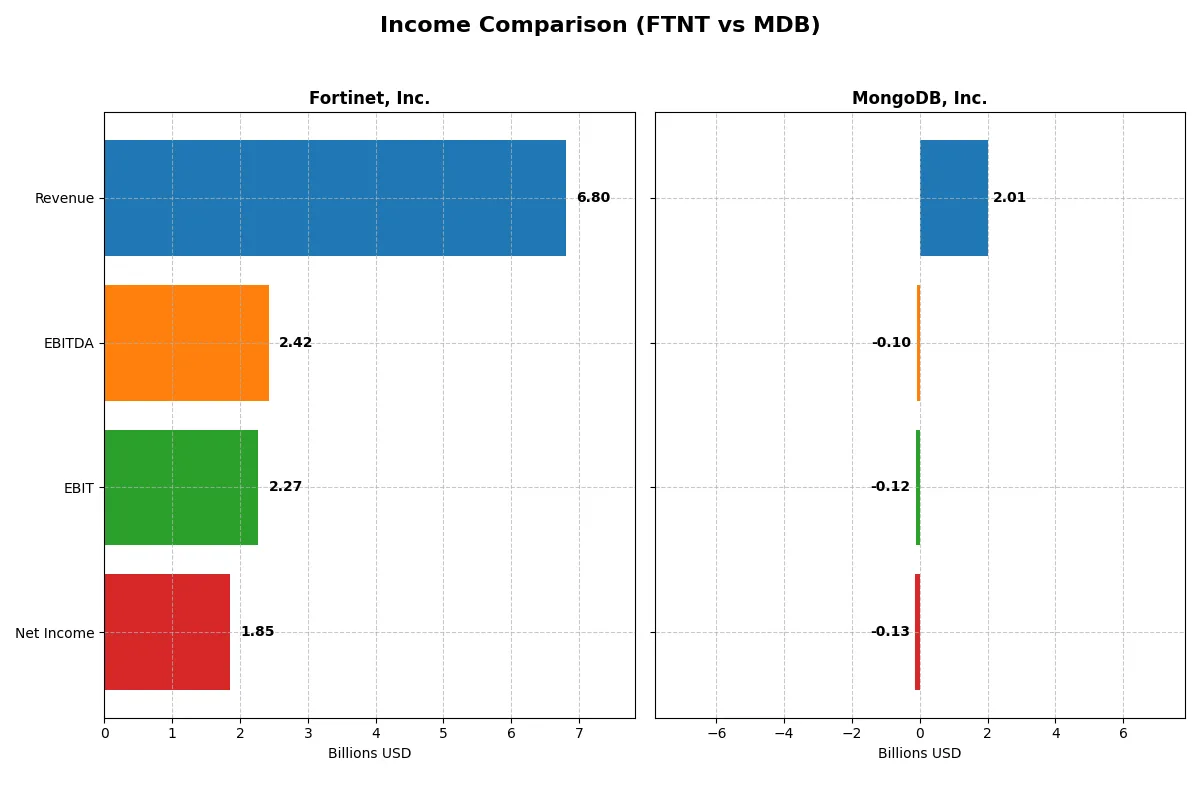
This data dissects the core profitability and scalability of both corporate engines to reveal who dominates the bottom line:
| Metric | Fortinet, Inc. (FTNT) | MongoDB, Inc. (MDB) |
|---|---|---|
| Revenue | 6.8B | 2.0B |
| Cost of Revenue | 1.3B | 535M |
| Operating Expenses | 3.4B | 1.7B |
| Gross Profit | 5.5B | 1.5B |
| EBITDA | 2.4B | -97M |
| EBIT | 2.3B | -124M |
| Interest Expense | 20M | 8M |
| Net Income | 1.9B | -129M |
| EPS | 2.44 | -1.73 |
| Fiscal Year | 2025 | 2025 |
Income Statement Analysis: The Bottom-Line Duel
This income statement comparison reveals the true efficiency and profitability of Fortinet and MongoDB’s corporate engines.
Fortinet, Inc. Analysis
Fortinet’s revenue surged from 3.3B in 2021 to 6.8B in 2025, doubling over five years. Net income grew robustly to 1.85B in 2025, reflecting strong operational leverage. Margins remain healthy, with an 80.8% gross margin and 27.3% net margin in 2025. The company exhibits steady momentum and efficient expense management, despite a slight net margin dip last year.
MongoDB, Inc. Analysis
MongoDB’s revenue climbed sharply from 590M in 2021 to 2.0B in 2025, a 240% increase. However, it remains unprofitable with a net loss of 129M in 2025, though net margin improved from -6.4% previously. Gross margin at 73.3% is solid, but a negative EBIT margin (-6.2%) signals ongoing operational challenges. MongoDB shows fast growth but still struggles to convert scale into profits.
Profitability Strength vs. Growth Ambition
Fortinet delivers clear profitability with sustained margin expansion and strong net income growth, proving a mature, efficient model. MongoDB impresses with high revenue growth but continues to operate at a loss, reflecting investment in scale over near-term profits. For investors prioritizing earnings and margin stability, Fortinet’s profile stands out as more attractive.
Financial Ratios Comparison
These vital ratios act as a diagnostic tool to expose the underlying fiscal health, valuation premiums, and capital efficiency of the companies analyzed:
| Ratios | Fortinet, Inc. (FTNT) | MongoDB, Inc. (MDB) |
|---|---|---|
| ROE | 1.50 | -0.05 |
| ROIC | 0.29 | -0.07 |
| P/E | 32.48 | -157.88 |
| P/B | 48.64 | 7.32 |
| Current Ratio | 1.17 | 5.20 |
| Quick Ratio | 1.09 | 5.20 |
| D/E | 0.81 | 0.01 |
| Debt-to-Assets | 0.10 | 0.01 |
| Interest Coverage | 103.72 | -26.70 |
| Asset Turnover | 0.65 | 0.58 |
| Fixed Asset Turnover | 4.20 | 24.78 |
| Payout ratio | 0 | 0 |
| Dividend yield | 0 | 0 |
| Fiscal Year | 2025 | 2025 |
Efficiency & Valuation Duel: The Vital Signs
Ratios act as the company’s DNA, exposing hidden risks and operational strengths that shape investor outcomes over time.
Fortinet, Inc.
Fortinet delivers robust profitability with a 150% ROE and a 27.3% net margin, signaling operational excellence. Its valuation appears stretched, with a high P/E of 32.5 and P/B of 48.6. The company reinvests aggressively in R&D, foregoing dividends, fueling growth while maintaining a solid capital structure.
MongoDB, Inc.
MongoDB suffers from negative returns: ROE at -4.6% and net margin at -6.4%, reflecting operational challenges. Its P/E is technically favorable due to negative earnings, but elevated WACC and weak interest coverage raise caution. The firm invests heavily in R&D, reflecting a growth focus but with significant financial risk.
Premium Valuation vs. Operational Safety
Fortinet offers a stronger balance of profitability and reinvestment discipline despite its premium valuation. MongoDB’s troubled returns and high financial risk weigh heavily. Investors seeking operational safety and growth may prefer Fortinet’s profile, while MongoDB suits those tolerating higher risk for potential turnaround.
Which one offers the Superior Shareholder Reward?
Fortinet and MongoDB both skip dividends, focusing on growth reinvestment. Fortinet deploys robust buybacks supported by strong free cash flow, while MongoDB prioritizes cash reserves over buybacks amid losses. I view Fortinet’s balanced buyback and cash flow model as the more sustainable and attractive total return in 2026.
Comparative Score Analysis: The Strategic Profile
The radar chart reveals the fundamental DNA and trade-offs of Fortinet, Inc. and MongoDB, Inc., highlighting their core financial strengths and vulnerabilities:
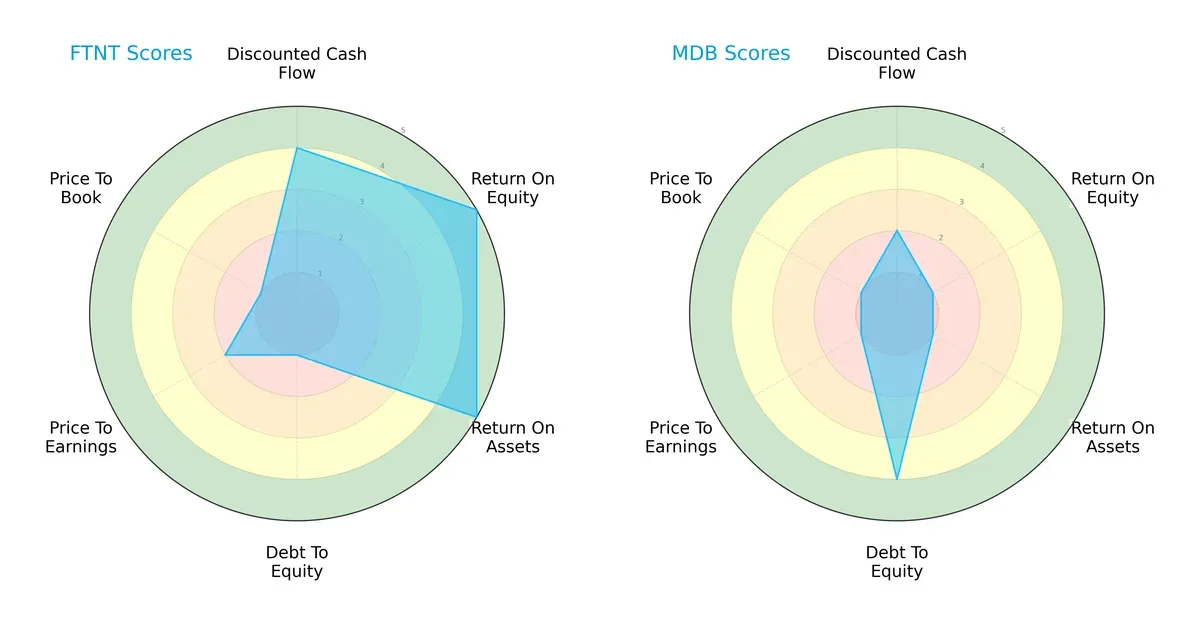
Fortinet displays a balanced profile with strong ROE and ROA scores of 5 each, reflecting efficient profit generation and asset utilization. However, its debt-to-equity score of 1 signals heavy leverage, a notable risk. MongoDB relies on a conservative capital structure with a debt-to-equity score of 4 but suffers from very low profitability scores (ROE and ROA at 1). Fortinet’s valuation metrics (P/E and P/B) are unfavorable, indicating potential overvaluation, while MongoDB’s similar low valuation scores suggest market skepticism. Overall, Fortinet leverages operational efficiency, whereas MongoDB depends on financial prudence.
—
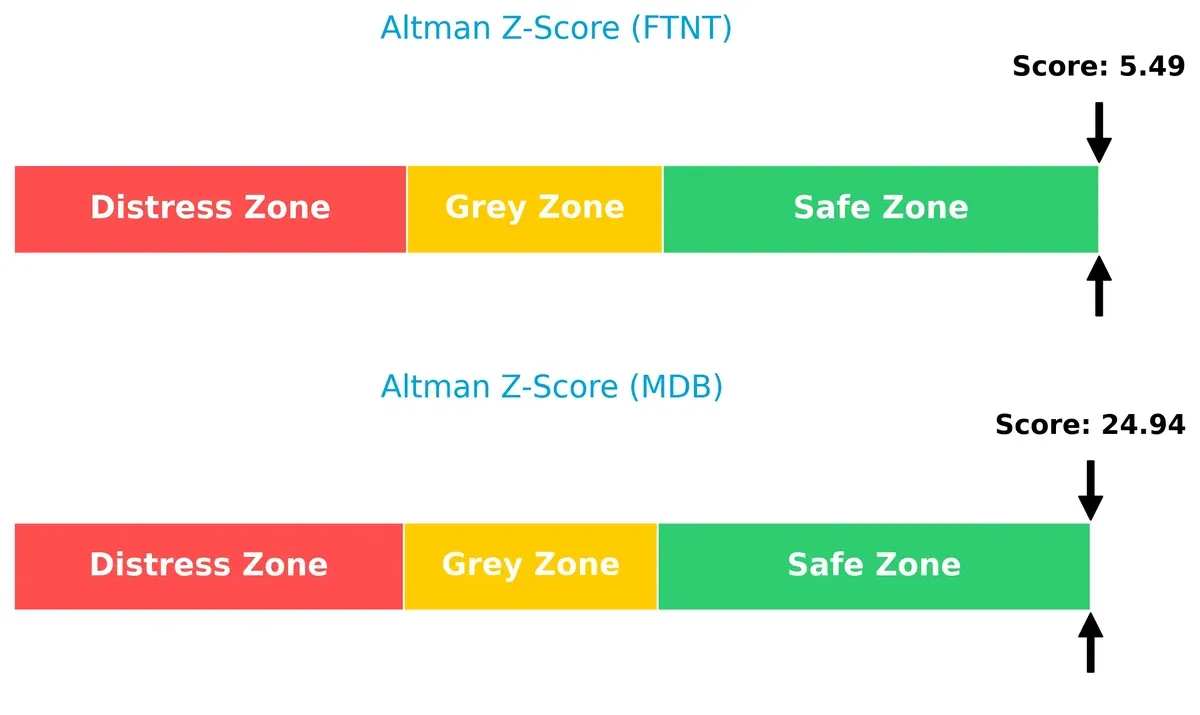
Bankruptcy Risk: Solvency Showdown
Fortinet’s Altman Z-Score of 5.49 versus MongoDB’s 24.94 places both firmly in the safe zone, yet the vast delta signals MongoDB’s exceptionally robust solvency and lower bankruptcy risk in this cycle:
—
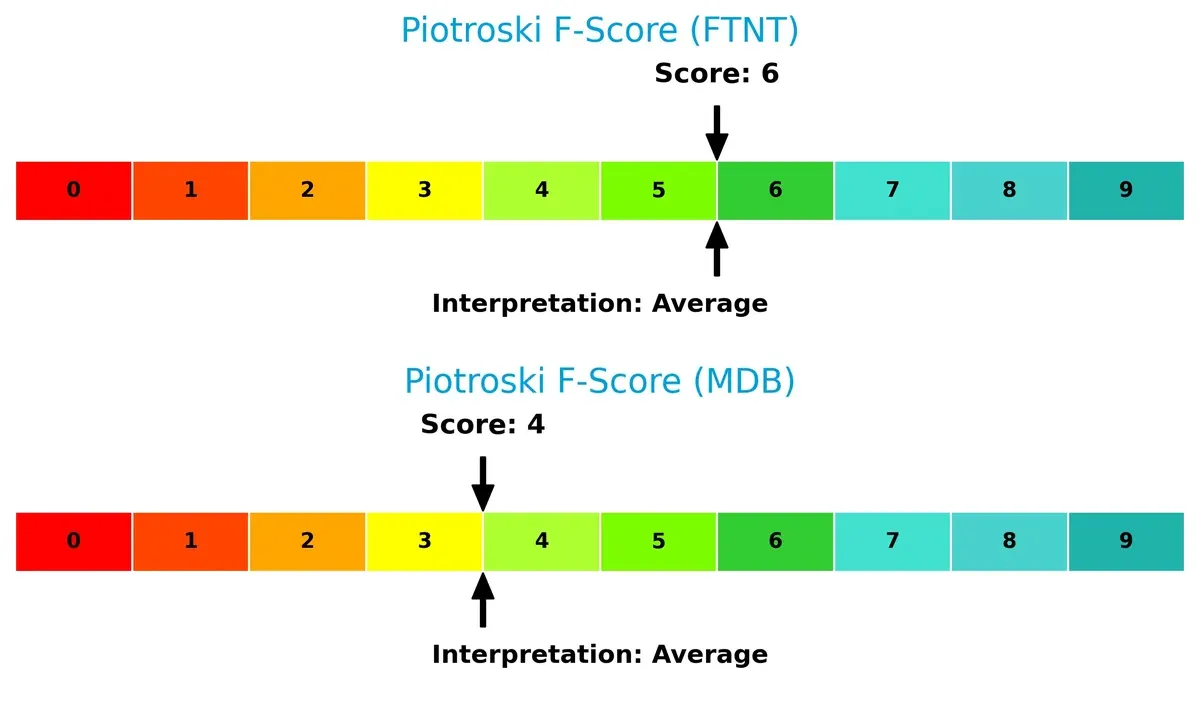
Financial Health: Quality of Operations
Fortinet’s Piotroski F-Score of 6 outperforms MongoDB’s 4, indicating stronger financial health and fewer red flags in operational quality and efficiency metrics:
How are the two companies positioned?
This section dissects the operational DNA of Fortinet and MongoDB by comparing revenue distribution and internal dynamics. The goal is to confront their economic moats to identify the most resilient, sustainable competitive advantage today.
Revenue Segmentation: The Strategic Mix
This visual comparison dissects how Fortinet, Inc. and MongoDB, Inc. diversify their income streams and where their primary sector bets lie:
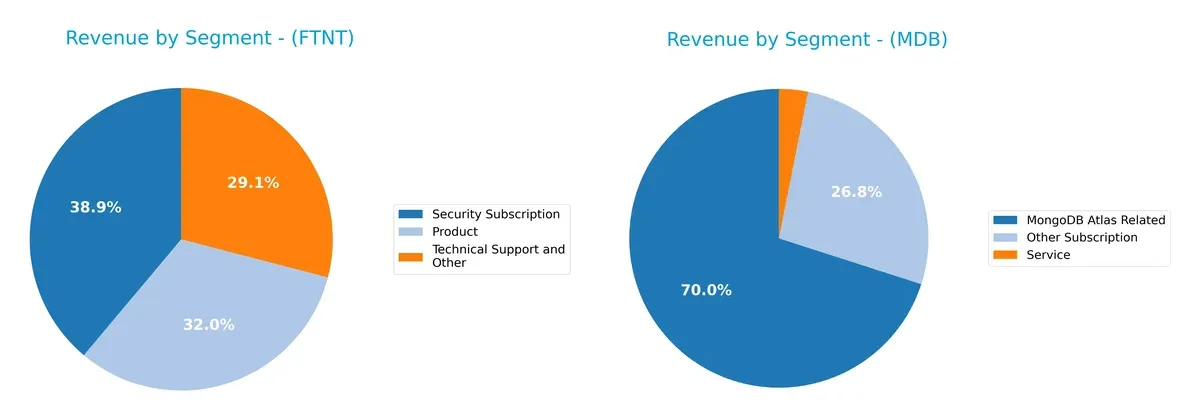
Fortinet anchors its revenue in Security Subscription at $2.3B, with solid contributions from Products ($1.9B) and Technical Support ($1.7B), showing a balanced, multi-pronged approach. MongoDB pivots heavily on MongoDB Atlas Related revenues at $1.4B, dwarfing Other Subscription ($539M) and Service ($63M). Fortinet’s diversified model reduces concentration risk, while MongoDB’s dependency on a dominant cloud service highlights ecosystem lock-in but also potential vulnerability to platform shifts.
Strengths and Weaknesses Comparison
This table compares the Strengths and Weaknesses of Fortinet, Inc. and MongoDB, Inc.:
Fortinet Strengths
- Diverse revenue streams from products, security subscriptions, and support
- Strong profitability with 27% net margin and 150% ROE
- Solid global presence across Americas, EMEA, and Asia Pacific
- Favorable quick ratio and low debt-to-assets ratio
- High fixed asset turnover indicating asset efficiency
MongoDB Strengths
- Growing subscription revenue, especially MongoDB Atlas
- Favorable quick ratio and minimal debt levels
- Exceptional fixed asset turnover reflecting efficient use of assets
- Positive P/E ratio indicating potential investor optimism
- Expanding global reach with rising revenues in Americas and EMEA
Fortinet Weaknesses
- Unfavorable valuation metrics, high P/E and P/B ratios
- No dividend yield for income investors
- Current ratio near liquidity caution threshold
- Moderate debt-to-equity ratio limits financial flexibility
MongoDB Weaknesses
- Negative profitability metrics: net margin, ROE, and ROIC all unfavorable
- Unfavorable weighted average cost of capital and interest coverage ratio
- Poor current ratio despite favorable quick ratio, indicating asset liquidity mismatch
- Unfavorable P/B ratio and no dividend yield
Fortinet demonstrates strong operational profitability and diversified global sales, though its valuation appears stretched. MongoDB shows promising asset efficiency and low leverage but faces profitability and liquidity challenges. These factors shape each company’s strategic focus on growth and financial health.
The Moat Duel: Analyzing Competitive Defensibility
A structural moat is the sole barrier protecting long-term profits from relentless competitive erosion. Here’s how Fortinet and MongoDB stack up:
Fortinet, Inc.: Fortress of Cost Advantage
Fortinet leverages a cost advantage moat, reflected in its robust 80.8% gross margin and 33.4% EBIT margin. I see its integrated cybersecurity solutions driving high ROIC, well above WACC by 20%, sustaining value creation. In 2026, expansion into emerging markets and new product lines could deepen this moat.
MongoDB, Inc.: Innovator with Network Effects
MongoDB’s competitive edge stems from network effects embedded in its database platform and cloud services. Although it currently sheds value with ROIC below WACC, its accelerating revenue growth of 19.2% and improving profitability signal a strengthening moat. Future multi-cloud adoption could disrupt traditional database players.
Cost Efficiency vs. Network Expansion: Who Holds the Moat?
Fortinet’s cost advantage delivers a deeper moat, sustaining high returns and value creation. MongoDB shows promise with growing network effects but still struggles to convert growth into profitability. Fortinet is better positioned to defend its market share amid intensifying competition.
Which stock offers better returns?
Over the past 12 months, Fortinet, Inc. surged 24.04% before slowing down recently, while MongoDB, Inc. declined 3.12% but gained momentum in the last quarter.
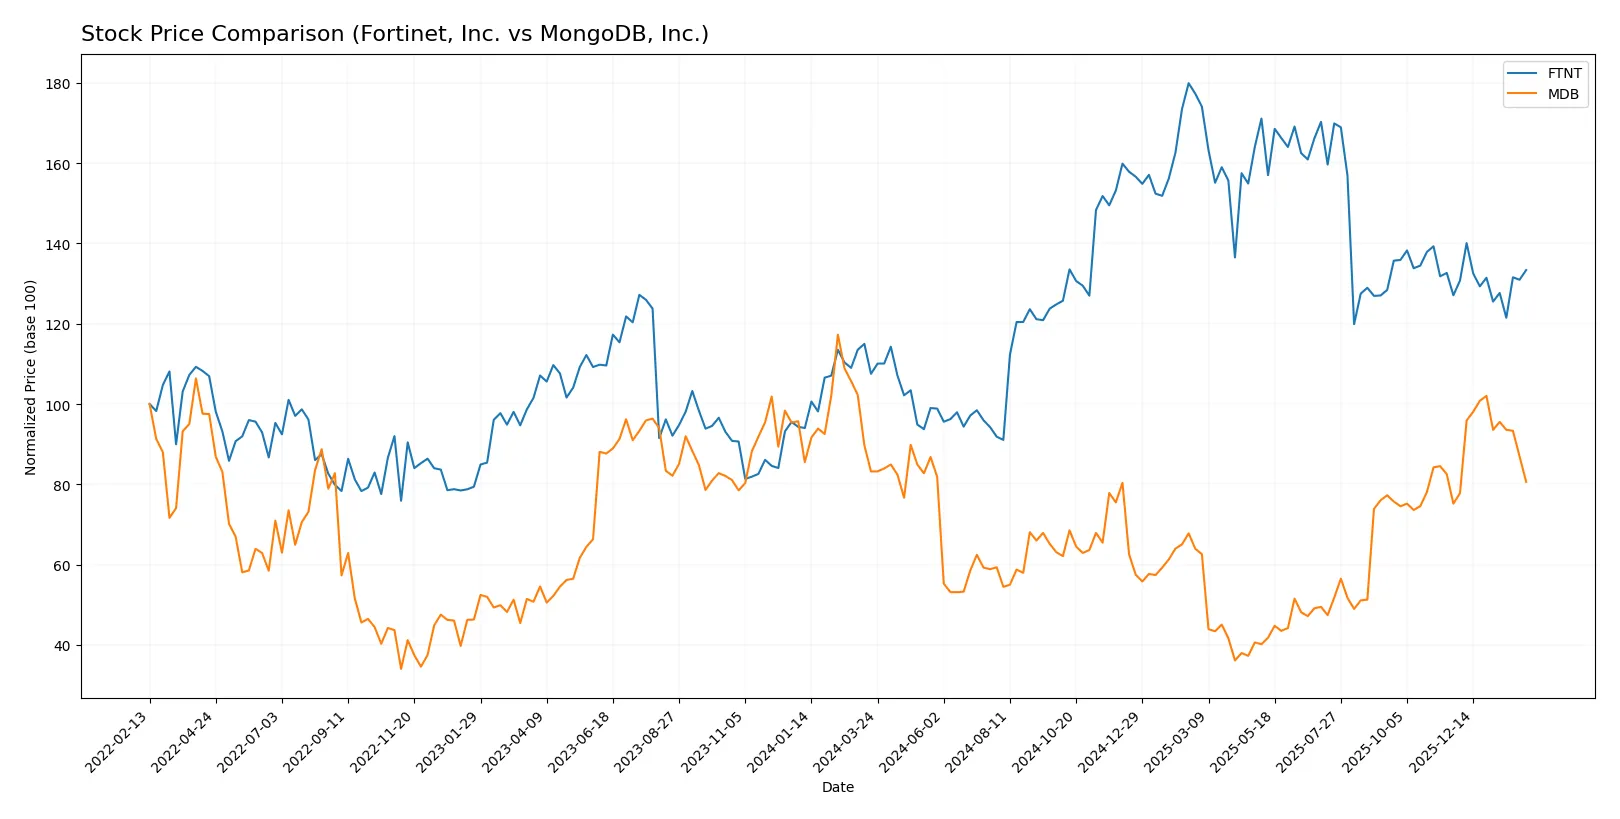
Trend Comparison
Fortinet, Inc. shows a bullish 24.04% rise over the past year with decelerating gains and moderate volatility (15.07 std dev). Its price ranged between 56.51 and 111.64.
MongoDB, Inc. displays a bearish 3.12% decline over 12 months, with accelerating loss and high volatility (69.85 std dev). Prices fluctuated from 154.39 to 435.85.
Fortinet outperformed MongoDB in total market returns, delivering a strong positive trend while MongoDB faced overall downward pressure despite recent gains.
Target Prices
Analysts present a confident target price consensus for Fortinet, Inc. and MongoDB, Inc.
| Company | Target Low | Target High | Consensus |
|---|---|---|---|
| Fortinet, Inc. | 70 | 90 | 85 |
| MongoDB, Inc. | 375 | 500 | 445.2 |
The target consensus for Fortinet sits slightly above its current price of $82.76, indicating moderate upside potential. MongoDB’s consensus target of $445.2 exceeds its current $344.35 price significantly, signaling robust analyst optimism.

Don’t Let Luck Decide Your Entry Point
Optimize your entry points with our advanced ProRealTime indicators. You’ll get efficient buy signals with precise price targets for maximum performance. Start outperforming now!
How do institutions grade them?
Fortinet, Inc. Grades
The table below summarizes recent grades assigned to Fortinet, Inc. by leading grading firms.
| Grading Company | Action | New Grade | Date |
|---|---|---|---|
| Rosenblatt | Maintain | Buy | 2026-02-06 |
| Mizuho | Maintain | Underperform | 2026-02-06 |
| JP Morgan | Maintain | Underweight | 2026-02-06 |
| RBC Capital | Maintain | Sector Perform | 2026-02-06 |
| Wedbush | Maintain | Outperform | 2026-02-06 |
| Scotiabank | Downgrade | Sector Perform | 2026-02-02 |
| JP Morgan | Maintain | Underweight | 2026-01-30 |
| Rosenblatt | Upgrade | Buy | 2026-01-29 |
| TD Cowen | Upgrade | Buy | 2026-01-23 |
| Citigroup | Maintain | Neutral | 2026-01-13 |
MongoDB, Inc. Grades
Below are the latest grades from reputable firms assessing MongoDB, Inc.
| Grading Company | Action | New Grade | Date |
|---|---|---|---|
| Needham | Maintain | Buy | 2026-01-20 |
| Needham | Maintain | Buy | 2026-01-12 |
| Barclays | Maintain | Overweight | 2026-01-12 |
| Truist Securities | Maintain | Buy | 2026-01-07 |
| Needham | Maintain | Buy | 2026-01-06 |
| RBC Capital | Maintain | Outperform | 2026-01-05 |
| Argus Research | Maintain | Buy | 2025-12-04 |
| Goldman Sachs | Maintain | Buy | 2025-12-03 |
| Citigroup | Maintain | Buy | 2025-12-03 |
| Bernstein | Maintain | Outperform | 2025-12-02 |
Which company has the best grades?
MongoDB, Inc. consistently receives strong buy and outperform ratings from multiple firms. Fortinet, Inc. faces mixed grades, ranging from buy to underperform. MongoDB’s superior consensus could influence investor confidence more positively.
Risks specific to each company
The following categories identify critical pressure points and systemic threats facing Fortinet, Inc. and MongoDB, Inc. in the 2026 market environment:
1. Market & Competition
Fortinet, Inc.
- Operates in crowded cybersecurity with strong moat but faces intense innovation pressure.
MongoDB, Inc.
- Competes in dynamic database market with scalability edge but struggles with profitability.
2. Capital Structure & Debt
Fortinet, Inc.
- Moderate leverage (D/E 0.81) with excellent interest coverage (113x) reduces financial distress risk.
MongoDB, Inc.
- Very low debt (D/E 0.01) but negative interest coverage signals operational losses and cash burn risk.
3. Stock Volatility
Fortinet, Inc.
- Beta near 1.05 suggests market-level volatility; stable relative to sector norms.
MongoDB, Inc.
- Higher beta at 1.39 implies elevated price swings and sensitivity to market shocks.
4. Regulatory & Legal
Fortinet, Inc.
- Cybersecurity regulations increase compliance costs but also create market barriers.
MongoDB, Inc.
- Data privacy laws and cloud regulations pressure product adaptation and increase legal risk.
5. Supply Chain & Operations
Fortinet, Inc.
- Hardware and software supply chain complexity could disrupt timely delivery.
MongoDB, Inc.
- Cloud-based model limits physical dependencies but relies heavily on third-party cloud providers.
6. ESG & Climate Transition
Fortinet, Inc.
- Faces growing scrutiny on energy consumption in data centers and product sustainability.
MongoDB, Inc.
- ESG initiatives less mature, potential reputational risk amid rising investor demands.
7. Geopolitical Exposure
Fortinet, Inc.
- Global sales expose firm to trade tensions and export control risks.
MongoDB, Inc.
- Primarily US-based but cloud infrastructure faces risks from international data sovereignty laws.
Which company shows a better risk-adjusted profile?
Fortinet’s strongest risk is market competition amid rapid cybersecurity innovation. MongoDB’s greatest risk is persistent unprofitability undermining financial stability. Despite Fortinet’s high valuation multiples, its solid leverage and profitability offer a more balanced risk-return profile. MongoDB’s high volatility and negative margins signal a riskier investment under current market conditions.
Final Verdict: Which stock to choose?
Fortinet’s superpower lies in its robust capital efficiency and consistent value creation. The company sustains a wide economic moat, reflecting strong returns on invested capital well above its cost of capital. A point of vigilance is its relatively high valuation multiples, which demand patience from investors. Fortinet fits well in portfolios seeking steady growth with solid fundamentals.
MongoDB’s strategic moat centers on its innovative cloud-native database platform, fueling rapid revenue expansion. Despite its negative profitability metrics, it maintains a strong balance sheet with exceptional liquidity, offering downside protection relative to Fortinet. This stock may appeal more to investors with a higher risk tolerance focused on growth potential and technological disruption.
If you prioritize durable profitability and proven capital allocation, Fortinet outshines as the compelling choice due to its sustainable competitive advantage and income quality. However, if you seek aggressive growth and can tolerate earnings volatility, MongoDB offers superior upside potential driven by its innovation-led expansion. Each stock suits distinct investor profiles balancing stability versus growth ambitions.
Disclaimer: Investment carries a risk of loss of initial capital. The past performance is not a reliable indicator of future results. Be sure to understand risks before making an investment decision.
Go Further
I encourage you to read the complete analyses of Fortinet, Inc. and MongoDB, Inc. to enhance your investment decisions: