Home > Comparison > Technology > FTNT vs INFA
The strategic rivalry between Fortinet, Inc. and Informatica Inc. shapes the future of software infrastructure. Fortinet operates as a cybersecurity powerhouse with broad, integrated hardware and software solutions. Informatica focuses on AI-driven data management platforms that unify multi-cloud environments. This analysis contrasts Fortinet’s security-centric model with Informatica’s data integration approach to identify which offers superior risk-adjusted returns for diversified portfolios in 2026.
Table of contents
Companies Overview
Fortinet and Informatica stand as pivotal players in the software infrastructure market with distinct value propositions.
Fortinet, Inc.: Cybersecurity Infrastructure Leader
Fortinet dominates the cybersecurity domain by offering integrated hardware and software security solutions. Its core revenue stems from FortiGate firewalls and security licenses that cover firewall, intrusion prevention, and endpoint protection. In 2026, Fortinet’s strategic focus remains on broadening automated cybersecurity across global enterprises, emphasizing scalable, multi-layered defenses.
Informatica Inc.: Data Management Innovator
Informatica leads in AI-powered data integration and management platforms. Its primary revenue source lies in interoperable products for data ingestion, transformation, quality, and governance across multi-cloud environments. The company’s 2026 strategy centers on enhancing enterprise data unification to drive analytics, compliance, and operational efficiency.
Strategic Collision: Similarities & Divergences
Both companies operate in software infrastructure but diverge sharply: Fortinet prioritizes a closed ecosystem of security appliances, while Informatica builds an open, AI-driven platform for data management. They compete indirectly on enterprise IT budgets, with cybersecurity and data integration as the battlegrounds. Fortinet offers a security-first investment profile; Informatica appeals to those betting on data-centric digital transformation.
Income Statement Comparison
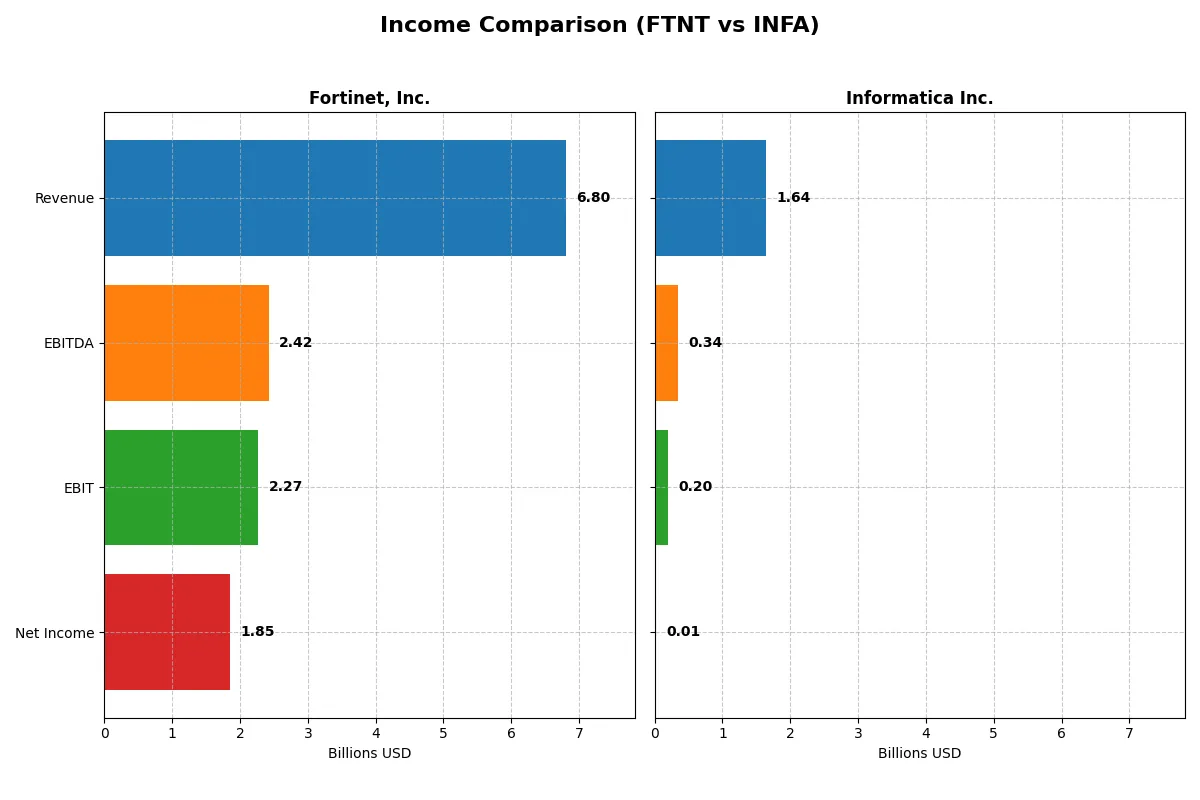
This data dissects the core profitability and scalability of both corporate engines to reveal who dominates the bottom line:
| Metric | Fortinet, Inc. (FTNT) | Informatica Inc. (INFA) |
|---|---|---|
| Revenue | 6.8B | 1.6B |
| Cost of Revenue | 1.3B | 326M |
| Operating Expenses | 3.4B | 1.2B |
| Gross Profit | 5.5B | 1.3B |
| EBITDA | 2.4B | 339M |
| EBIT | 2.3B | 199M |
| Interest Expense | 20M | 146M |
| Net Income | 1.9B | 10M |
| EPS | 2.44 | 0.033 |
| Fiscal Year | 2025 | 2024 |
Income Statement Analysis: The Bottom-Line Duel
This income statement comparison reveals which company runs a more efficient and profitable operation through revenue growth and margin control.
Fortinet, Inc. Analysis
Fortinet posts a strong revenue rise from $3.34B in 2021 to $6.80B in 2025, doubling its sales in five years. Its gross margin exceeds 80%, with a healthy net margin above 27%, reflecting excellent cost control. In 2025, Fortinet’s momentum accelerated, showing a 14% revenue growth and a 33% EBIT margin, signaling robust operational efficiency.
Informatica Inc. Analysis
Informatica’s revenue grew modestly from $1.32B in 2020 to $1.64B in 2024, a 24% increase over five years. Its gross margin holds steady near 80%, but the net margin remains low at around 0.6%, indicating limited profitability. However, the 2024 year shows a strong EBIT jump of 168% and positive net margin growth, suggesting improving operational leverage.
Margin Strength vs. Profitability Scale
Fortinet clearly outpaces Informatica in both top-line growth and bottom-line profitability, boasting superior margins and scalable earnings. Informatica’s recent margin improvements are encouraging but remain far behind Fortinet’s efficiency. For investors prioritizing sustained profit growth and operational strength, Fortinet presents a more compelling profile.
Financial Ratios Comparison
These vital ratios act as a diagnostic tool to expose the underlying fiscal health, valuation premiums, and capital efficiency of the companies compared below:
| Ratios | Fortinet, Inc. (FTNT) | Informatica Inc. (INFA) |
|---|---|---|
| ROE | 1.50 | 0.0043 |
| ROIC | 0.29 | 0.0056 |
| P/E | 32.48 | 787.95 |
| P/B | 48.64 | 3.39 |
| Current Ratio | 1.17 | 1.82 |
| Quick Ratio | 1.09 | 1.82 |
| D/E | 0.81 | 0.81 |
| Debt-to-Assets | 0.096 | 0.35 |
| Interest Coverage | 104 | 0.87 |
| Asset Turnover | 0.65 | 0.31 |
| Fixed Asset Turnover | 4.20 | 8.75 |
| Payout ratio | 0 | 0.0012 |
| Dividend yield | 0 | 0.0000015 |
| Fiscal Year | 2025 | 2024 |
Efficiency & Valuation Duel: The Vital Signs
Financial ratios serve as a company’s DNA, unveiling hidden risks and operational strengths that shape investor confidence and portfolio decisions.
Fortinet, Inc.
Fortinet exhibits exceptional profitability with a ROE of 150% and a robust net margin of 27%. Its valuation appears stretched, with a P/E of 32.5 and a high P/B of 48.6. The company reinvests aggressively in R&D, reflecting a growth-focused strategy despite offering no dividends, signaling confidence in long-term shareholder value creation.
Informatica Inc.
Informatica’s ratio data is unavailable, preventing a direct profitability and valuation analysis. The absence of key financial metrics hinders a clear view of operational efficiency or shareholder return strategy. Investors face significant informational risk, complicating any comparative assessment on fundamentals or capital allocation prudence.
Premium Valuation vs. Data Transparency
Fortinet’s high profitability and clear reinvestment plan offer a compelling risk-reward balance despite its premium valuation. Informatica’s missing ratio data introduces uncertainty, challenging risk assessment. Fortinet suits investors prioritizing operational excellence and growth clarity, while Informatica demands caution due to informational opacity.
Which one offers the Superior Shareholder Reward?
I contrast Fortinet, Inc. (FTNT) and Informatica Inc. (INFA) on shareholder returns through dividends and buybacks. Fortinet pays no dividends but maintains robust free cash flow (2.9B) and consistently deploys capital into share buybacks, fueling shareholder value. Informatica offers a negligible dividend yield (~0%) with a payout ratio near zero, signaling minimal income distribution. Its free cash flow (~1.3B) supports modest buybacks and reinvestment. Fortinet’s aggressive buyback program paired with zero dividend payout supports a sustainable growth-driven total return, outperforming Informatica’s restrained distribution. I conclude Fortinet offers a superior total shareholder reward in 2026.
Bankruptcy Risk Duel (Altman Z-Score)
Bankruptcy Risk: Solvency Showdown
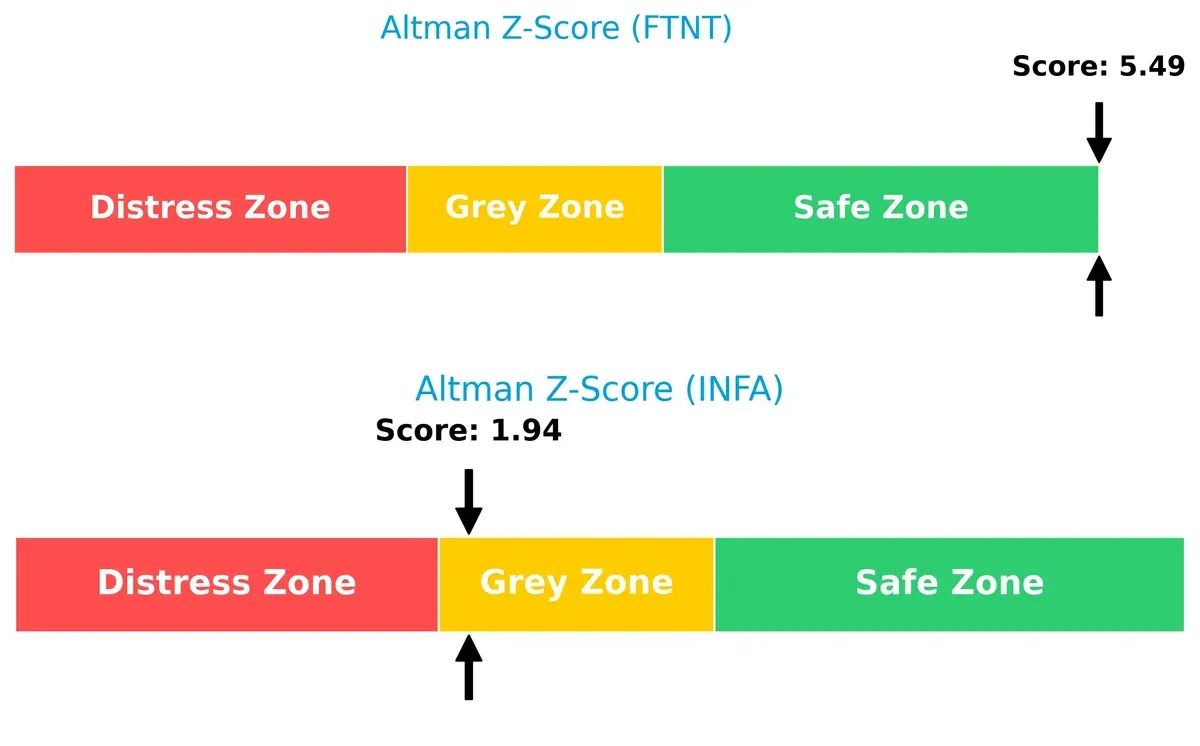
I see a stark contrast in Altman Z-Scores between Fortinet, Inc. (5.49) and Informatica Inc. (1.94): Fortinet comfortably sits in the safe zone, signaling strong long-term survival prospects. Informatica, however, remains in the grey zone, indicating moderate bankruptcy risk amid current market volatility.
Financial Strength Showdown (Piotroski F-Score)
Financial Health: Quality of Operations
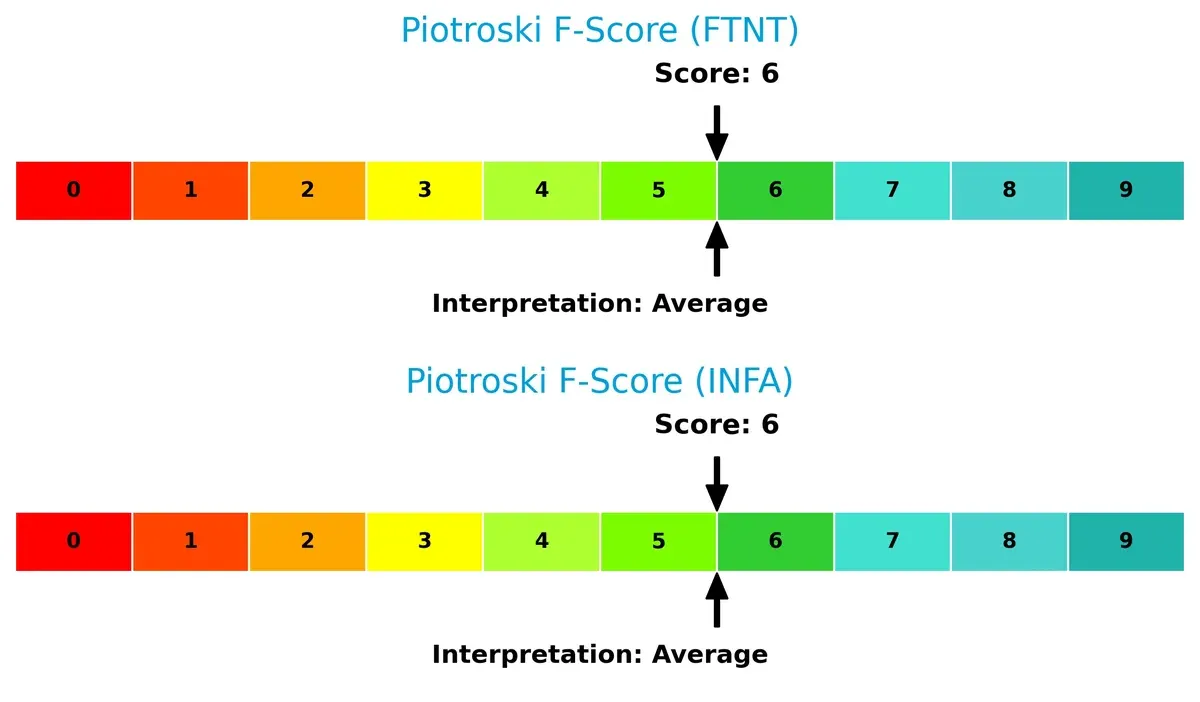
Both Fortinet and Informatica score a 6 on the Piotroski scale, reflecting average financial health. Neither firm raises immediate red flags on profitability or liquidity, but neither demonstrates the peak operational robustness that investors often seek in turbulent cycles.
How are the two companies positioned?
This section dissects the operational DNA of Fortinet and Informatica by comparing their revenue distribution and internal strengths and weaknesses. The objective is to confront their economic moats and identify which model offers the most resilient, sustainable advantage today.
Revenue Segmentation: The Strategic Mix
This visual comparison dissects how Fortinet, Inc. and Informatica Inc. diversify their income streams and where their primary sector bets lie:
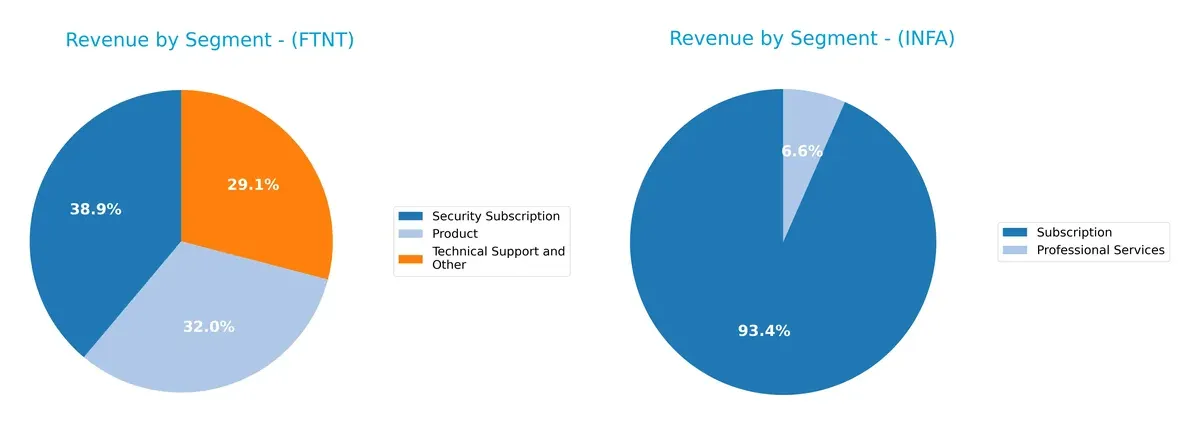
Fortinet anchors its revenue in three balanced segments: $2.3B Security Subscription, $1.9B Product sales, and $1.7B Technical Support. This mix fosters ecosystem lock-in and recurring income. Informatica leans heavily on $1.1B Subscription revenue, supplemented by $78M Professional Services, showing a subscription pivot but higher concentration risk. Fortinet’s diversified base signals infrastructure dominance, while Informatica’s focus bets strongly on cloud subscription growth.
Strengths and Weaknesses Comparison
This table compares the Strengths and Weaknesses of Fortinet, Inc. and Informatica Inc.:
Fortinet Strengths
- Solid profitability with 27.26% net margin and 149.77% ROE
- Favorable ROIC at 28.76% above WACC
- Diverse revenue streams from products, subscriptions, and support
- Strong global presence across Americas, EMEA, and Asia Pacific
Informatica Strengths
- Subscription revenue exceeds 1B USD, showing recurring income strength
- Geographic revenue concentrated in North America with growing EMEA and Asia Pacific presence
- Mix of professional services and licenses diversifies income sources
Fortinet Weaknesses
- High valuation metrics with PE at 32.48 and PB at 48.64, potentially overvalued
- Zero dividend yield limits income appeal
- Moderate liquidity with current ratio at 1.17
- Limited explicit data on market share and innovation
Informatica Weaknesses
- Lack of available financial ratios and key metrics hampers full assessment
- Smaller revenue scale compared to Fortinet
- Geographic concentration risks in North America
- Limited visibility on profitability and capital efficiency
Fortinet’s strengths lie in profitability and global diversification, tempered by valuation concerns. Informatica shows solid subscription revenues and geographic footprint but lacks comprehensive financial transparency. These factors shape each company’s strategic focus and risk profile.
The Moat Duel: Analyzing Competitive Defensibility
A structural moat is the only reliable shield protecting long-term profits from relentless competition erosion. Let’s dissect two technology firms’ moats:
Fortinet, Inc.: Network Effects and Integrated Security Ecosystem
Fortinet’s primary moat stems from its expansive network effects and integrated cybersecurity platform. This advantage shows in a robust 33% EBIT margin and growing ROIC. In 2026, expansion into cloud and AI-driven security could deepen its moat further.
Informatica Inc.: Data Integration and AI-Driven Platform Lock-in
Informatica’s moat centers on AI-powered data management and platform interoperability, creating switching costs unlike Fortinet’s security focus. Its lower EBIT margin (~12%) signals a narrower moat but rapid AI adoption may unlock new growth vectors.
Network Effects vs. Platform Lock-in: The Moat Showdown
Fortinet boasts a wider, more durable moat with a 20%+ ROIC spread above WACC and consistent margin strength. Informatica’s moat is promising but narrower. Fortinet remains better positioned to defend market share amid intensifying competition.
Which stock offers better returns?
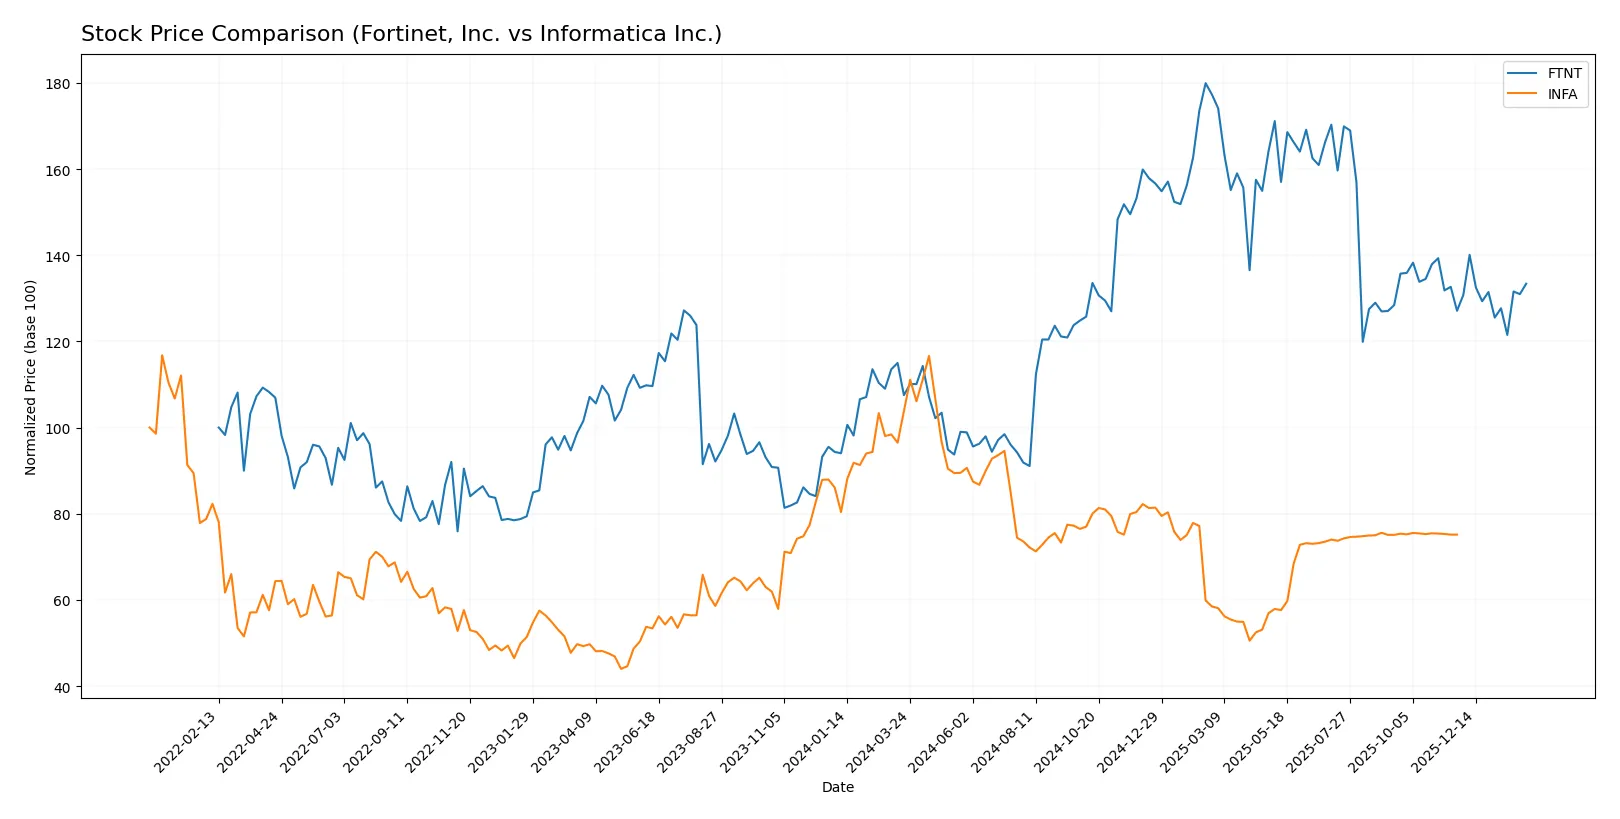
Fortinet, Inc. and Informatica Inc. exhibit contrasting stock price dynamics over the past year, with Fortinet showing a strong upward move and Informatica facing a significant decline.
Trend Comparison
Fortinet’s stock rose 24.04% over the past 12 months, confirming a bullish trend despite decelerating momentum. The price fluctuated between 56.51 and 111.64, with elevated volatility at a 15.07 standard deviation.
Informatica’s stock lost 12.68% in the same period, marking a bearish trend with accelerating decline. The price ranged from 16.67 to 38.48, and volatility remained moderate at 4.46 standard deviation.
Fortinet outperformed Informatica by a wide margin, delivering the highest market return and a clear positive price trajectory over the last year.
Target Prices
Analysts present a clear target price consensus for Fortinet, Inc. and Informatica Inc.
| Company | Target Low | Target High | Consensus |
|---|---|---|---|
| Fortinet, Inc. | 70 | 90 | 85 |
| Informatica Inc. | 18 | 44 | 26.67 |
Fortinet’s consensus target of 85 slightly exceeds its current price of 82.76, indicating moderate upside potential. Informatica’s consensus target of 26.67 is just above its current price of 24.79, suggesting limited near-term gains.

Don’t Let Luck Decide Your Entry Point
Optimize your entry points with our advanced ProRealTime indicators. You’ll get efficient buy signals with precise price targets for maximum performance. Start outperforming now!
How do institutions grade them?
The following tables summarize recent institutional grades for Fortinet, Inc. and Informatica Inc.:
Fortinet, Inc. Grades
The table below details Fortinet’s recent grades from several reputable grading companies.
| Grading Company | Action | New Grade | Date |
|---|---|---|---|
| Rosenblatt | Maintain | Buy | 2026-02-06 |
| Mizuho | Maintain | Underperform | 2026-02-06 |
| JP Morgan | Maintain | Underweight | 2026-02-06 |
| RBC Capital | Maintain | Sector Perform | 2026-02-06 |
| Wedbush | Maintain | Outperform | 2026-02-06 |
| Scotiabank | Downgrade | Sector Perform | 2026-02-02 |
| JP Morgan | Maintain | Underweight | 2026-01-30 |
| Rosenblatt | Upgrade | Buy | 2026-01-29 |
| TD Cowen | Upgrade | Buy | 2026-01-23 |
| Citigroup | Maintain | Neutral | 2026-01-13 |
Informatica Inc. Grades
Below is a summary of recent grades assigned to Informatica by recognized financial institutions.
| Grading Company | Action | New Grade | Date |
|---|---|---|---|
| Guggenheim | Downgrade | Neutral | 2025-08-07 |
| UBS | Maintain | Neutral | 2025-08-07 |
| Baird | Maintain | Neutral | 2025-05-28 |
| JP Morgan | Downgrade | Neutral | 2025-05-28 |
| RBC Capital | Maintain | Sector Perform | 2025-05-28 |
| Wolfe Research | Downgrade | Peer Perform | 2025-05-28 |
| Wells Fargo | Maintain | Equal Weight | 2025-05-28 |
| Truist Securities | Downgrade | Hold | 2025-05-28 |
| RBC Capital | Maintain | Sector Perform | 2025-05-27 |
| UBS | Maintain | Neutral | 2025-05-16 |
Which company has the best grades?
Fortinet holds a broader range of grades, including multiple Buy and Outperform ratings, while Informatica’s grades cluster around Neutral and Sector Perform. Fortinet’s stronger grades may suggest higher institutional confidence, potentially affecting investor sentiment and valuation positively.
Risks specific to each company
The following categories identify the critical pressure points and systemic threats facing both firms in the 2026 market environment:
1. Market & Competition
Fortinet, Inc.
- Operates in a highly competitive cybersecurity space with rapid innovation cycles and strong incumbents.
Informatica Inc.
- Faces fierce competition in AI-powered data management with larger cloud and software firms expanding aggressively.
2. Capital Structure & Debt
Fortinet, Inc.
- Maintains moderate debt with a debt-to-equity ratio of 0.81; interest coverage is very strong at 113x.
Informatica Inc.
- Financial data on capital structure is unavailable, increasing uncertainty about leverage risk.
3. Stock Volatility
Fortinet, Inc.
- Beta of 1.05 indicates volatility roughly in line with the tech sector; trading volume is robust.
Informatica Inc.
- Slightly higher beta at 1.14 suggests marginally greater sensitivity to market swings; lower liquidity than Fortinet.
4. Regulatory & Legal
Fortinet, Inc.
- Subject to cybersecurity regulations and data privacy laws globally, increasing compliance costs.
Informatica Inc.
- Operates under strict data governance and privacy regulations, critical for AI and cloud data management.
5. Supply Chain & Operations
Fortinet, Inc.
- Hardware production and global distribution expose it to supply chain disruptions and component shortages.
Informatica Inc.
- Software-centric model reduces supply chain risks but depends heavily on cloud infrastructure stability.
6. ESG & Climate Transition
Fortinet, Inc.
- ESG disclosures are limited; energy use in hardware manufacturing may pose transition risks.
Informatica Inc.
- Growing investor pressure to enhance ESG transparency, especially around data ethics and energy-efficient AI.
7. Geopolitical Exposure
Fortinet, Inc.
- Global footprint exposes it to trade tensions, particularly US-China cybersecurity restrictions.
Informatica Inc.
- Primarily US-focused but risks exist from international regulations on data sovereignty and cross-border data flows.
Which company shows a better risk-adjusted profile?
Fortinet’s strongest risk lies in intense market competition and valuation concerns, despite solid capital structure and financial stability. Informatica faces critical unknowns due to missing financial data and higher geopolitical and regulatory complexities. Fortinet’s Altman Z-score of 5.49 places it safely above distress thresholds, unlike Informatica’s 1.94 in a grey zone. I judge Fortinet shows a better risk-adjusted profile, anchored by robust liquidity and manageable debt, while Informatica’s incomplete data and geopolitical exposure raise caution flags.
Final Verdict: Which stock to choose?
Fortinet’s superpower lies in its ability to convert invested capital into exceptional returns, boasting a very favorable moat with a growing ROIC. Its massive profitability and cash flow generation fuel growth but watch its high valuation multiples as a point of vigilance. It suits investors targeting aggressive growth with a tolerance for premium pricing.
Informatica’s strategic moat rests in its data management niche with a steady recurring revenue base, offering a more conservative profile compared to Fortinet. Despite weaker profitability and financial caution signals, it appeals to those seeking growth at a reasonable price with a focus on stability and operational improvements.
If you prioritize high-growth and market leadership, Fortinet outshines with robust profitability and a sustainable competitive advantage. However, if you seek a more measured growth approach with better balance sheet caution, Informatica offers potential upside with less valuation risk. Both present distinct analytical scenarios for different investor profiles.
Disclaimer: Investment carries a risk of loss of initial capital. The past performance is not a reliable indicator of future results. Be sure to understand risks before making an investment decision.
Go Further
I encourage you to read the complete analyses of Fortinet, Inc. and Informatica Inc. to enhance your investment decisions: