Home > Comparison > Technology > FTNT vs GEN
The strategic rivalry between Fortinet, Inc. and Gen Digital Inc. shapes the cybersecurity landscape within the technology sector. Fortinet operates as a capital-intensive infrastructure provider with broad, integrated security hardware and software solutions. In contrast, Gen Digital focuses on consumer cyber safety through subscription-based software services. This analysis pits Fortinet’s enterprise scale against Gen’s consumer-centric model to identify which offers superior risk-adjusted returns for a diversified portfolio.
Table of contents
Companies Overview
Fortinet and Gen Digital anchor the cybersecurity landscape with distinct market approaches and scale.
Fortinet, Inc.: Integrated Cybersecurity Powerhouse
Fortinet dominates the enterprise cybersecurity space, earning revenue primarily from its comprehensive hardware and software solutions. Its flagship FortiGate platform integrates firewall, VPN, and intrusion prevention. In 2026, Fortinet sharpened its edge through broad automation and multi-layered security, targeting large-scale industries like telecom and government for sustained growth.
Gen Digital Inc.: Consumer-Focused Cyber Safety Leader
Gen Digital leads in consumer cybersecurity with subscription-based platforms like Norton 360, offering malware protection and identity theft services. Its 2026 strategy emphasized expanding privacy tools, including VPN and social media monitoring, to enhance digital safety across PCs, mobile devices, and online identities worldwide.
Strategic Collision: Similarities & Divergences
Both firms excel in cybersecurity but differ sharply. Fortinet builds a closed, integrated ecosystem for enterprise clients, while Gen Digital pursues an open, subscription-driven consumer model. Their main battleground is digital security coverage—enterprise versus individual users. These contrasting models shape distinct risk profiles and growth trajectories for investors.
Income Statement Comparison
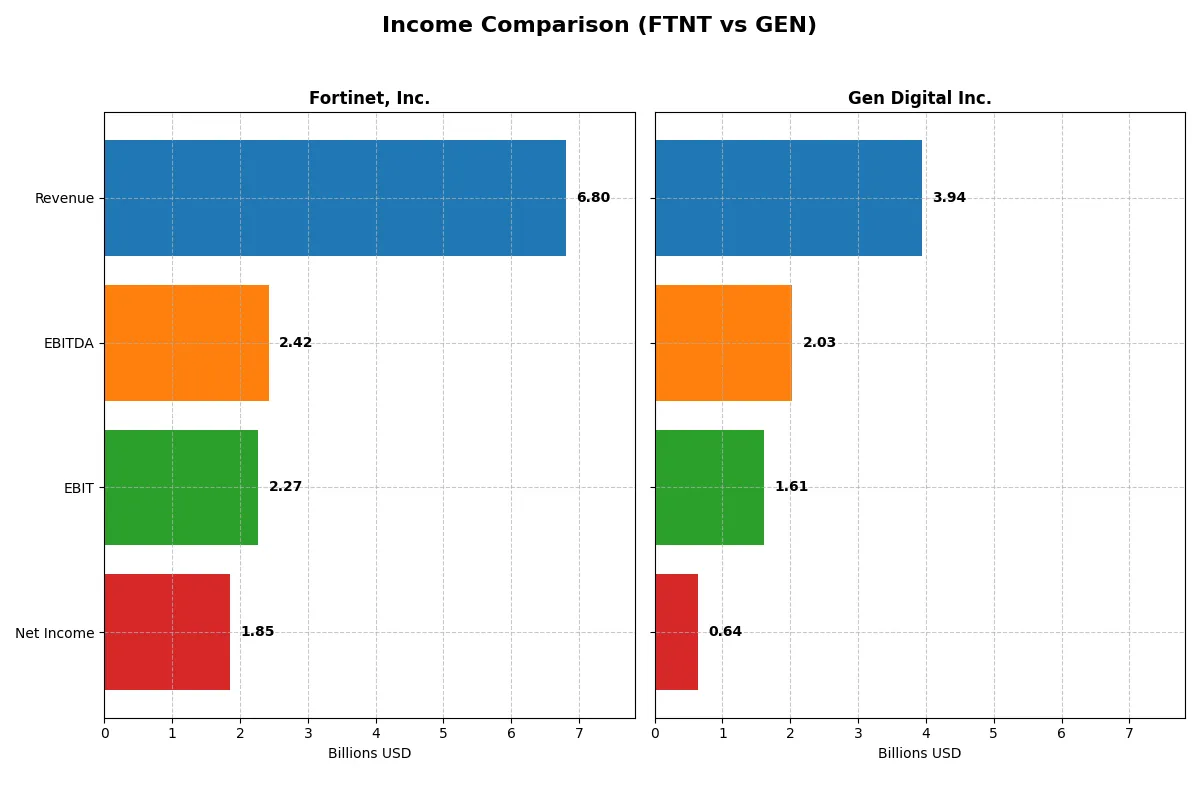
This data dissects the core profitability and scalability of both corporate engines to reveal who dominates the bottom line:
| Metric | Fortinet, Inc. (FTNT) | Gen Digital Inc. (GEN) |
|---|---|---|
| Revenue | 6.8B | 3.9B |
| Cost of Revenue | 1.3B | 776M |
| Operating Expenses | 3.4B | 1.5B |
| Gross Profit | 5.5B | 3.2B |
| EBITDA | 2.4B | 2.0B |
| EBIT | 2.3B | 1.6B |
| Interest Expense | 20M | 578M |
| Net Income | 1.9B | 643M |
| EPS | 2.44 | 1.04 |
| Fiscal Year | 2025 | 2025 |
Income Statement Analysis: The Bottom-Line Duel
This income statement comparison exposes how efficiently each company converts revenue into profit and sustains margin strength over time.
Fortinet, Inc. Analysis
Fortinet’s revenue surged from 3.3B in 2021 to nearly 6.8B in 2025, doubling over five years. Net income climbed impressively from 607M to 1.85B, highlighting robust profit growth. Its gross margin remains strong at 80.8%, with a solid 27.3% net margin in 2025. The company sustains efficiency despite expanding operating expenses, signaling healthy momentum.
Gen Digital Inc. Analysis
Gen Digital’s revenue grew moderately from 2.55B in 2021 to 3.93B in 2025, a 54% rise. Net income showed less volatility, ending at 643M in 2025 after peaking at 1.33B in 2023. Gross margin holds firm around 80.3%, but net margin is thinner at 16.3%, weighed down by high interest expenses (14.7% of revenue). Recent EBIT growth at 44% indicates operational leverage despite margin pressure.
Margin Power vs. Revenue Scale
Fortinet dominates with stronger revenue and net income growth, paired with superior net margins and controlled interest costs. Gen Digital delivers respectable operational gains but struggles with heavier interest burdens and weaker net margins. For investors, Fortinet’s profile offers a more compelling blend of scale and profitability resilience.
Financial Ratios Comparison
These vital ratios act as a diagnostic tool to expose the underlying fiscal health, valuation premiums, and capital efficiency of the companies compared below:
| Ratios | Fortinet, Inc. (FTNT) | Gen Digital Inc. (GEN) |
|---|---|---|
| ROE | 1.50 | 0.28 |
| ROIC | 0.29 | 0.08 |
| P/E | 32.48 | 25.36 |
| P/B | 48.64 | 7.19 |
| Current Ratio | 1.17 | 0.51 |
| Quick Ratio | 1.09 | 0.51 |
| D/E | 0.81 | 3.66 |
| Debt-to-Assets | 0.10 | 0.54 |
| Interest Coverage | 103.72 | 2.79 |
| Asset Turnover | 0.65 | 0.25 |
| Fixed Asset Turnover | 4.20 | 36.10 |
| Payout ratio | 0 | 0.49 |
| Dividend yield | 0 | 1.92% |
| Fiscal Year | 2025 | 2025 |
Efficiency & Valuation Duel: The Vital Signs
Financial ratios serve as a company’s DNA, uncovering hidden risks and operational excellence within its core business.
Fortinet, Inc.
Fortinet boasts a commanding 150% ROE and a strong 27% net margin, signaling exceptional profitability. Yet, its P/E of 32.5 and P/B near 49 mark the stock as stretched. The firm reinvests aggressively in R&D, foregoing dividends to fuel growth and maintain its technological edge.
Gen Digital Inc.
Gen Digital delivers a solid 28% ROE with a 16% net margin, reflecting stable earnings. Its valuation appears demanding, with a P/E of 25.4 and P/B around 7.2. The company offers a modest 1.9% dividend yield, balancing shareholder returns with debt-heavy capital management.
Premium Valuation vs. Operational Safety
Fortinet commands a premium valuation but excels in profitability and operational metrics, while Gen Digital faces leverage and liquidity challenges despite dividend income. Fortinet suits growth-focused investors; Gen fits those seeking moderate income with higher risk tolerance.
Which one offers the Superior Shareholder Reward?
Fortinet (FTNT) pays no dividends but generates strong free cash flow, reinvesting aggressively in growth and maintaining a modest buyback program. Gen Digital (GEN) offers a 1.9–2.3% dividend yield with a ~50% payout ratio and moderate buybacks. GEN’s yield is supported by stable free cash flow coverage near 99%. FTNT’s distribution relies on capital appreciation fueled by reinvestment, while GEN balances income and growth through dividends and buybacks. Given FTNT’s zero dividend and reliance on reinvestment, its reward suits growth-focused investors. GEN’s blend of dividends and buybacks appeals to income-oriented shareholders. I find GEN’s sustainable distribution strategy and total return profile more attractive for 2026 investors seeking steady income plus growth.
Comparative Score Analysis: The Strategic Profile
The radar chart reveals the fundamental DNA and trade-offs of Fortinet, Inc. and Gen Digital Inc., highlighting their financial strengths and valuation challenges:
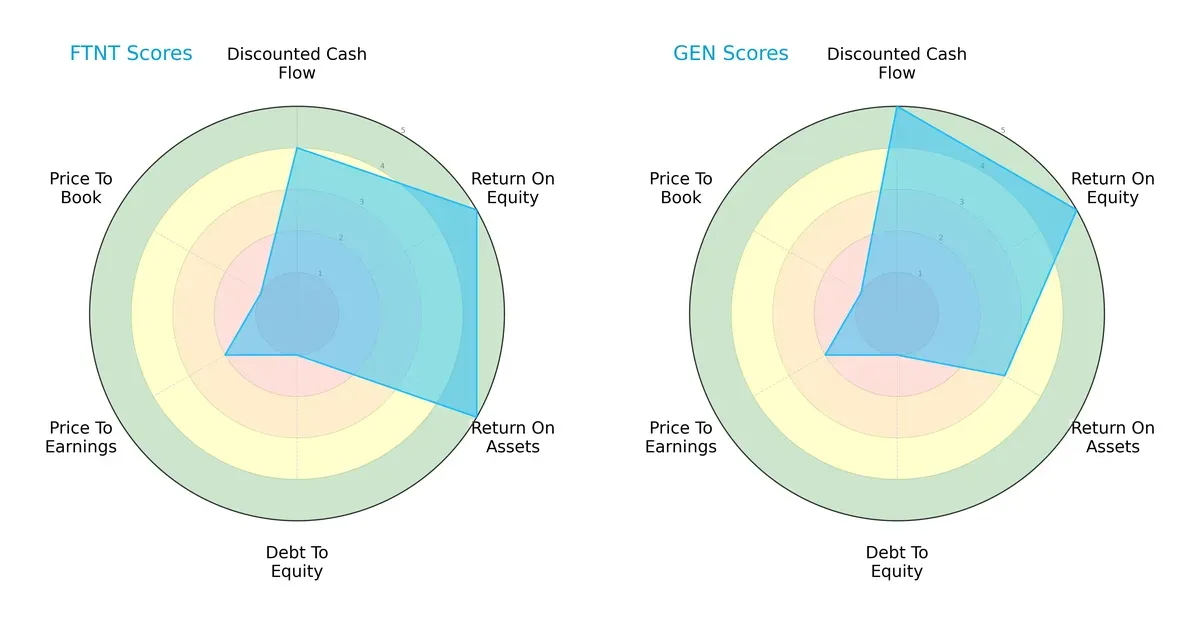
Fortinet shows robust operational efficiency with high ROE and ROA scores (5 each), signaling strong asset utilization and profitability. Gen Digital matches Fortinet in ROE but lags in ROA (3), indicating less efficient asset use. Both firms suffer from weak debt-to-equity and valuation metrics, reflecting high leverage and rich pricing. Gen’s standout is a superior discounted cash flow score (5 vs. 4), suggesting better future cash flow prospects. Overall, Fortinet offers a more balanced operational profile, while Gen leans on its DCF advantage.
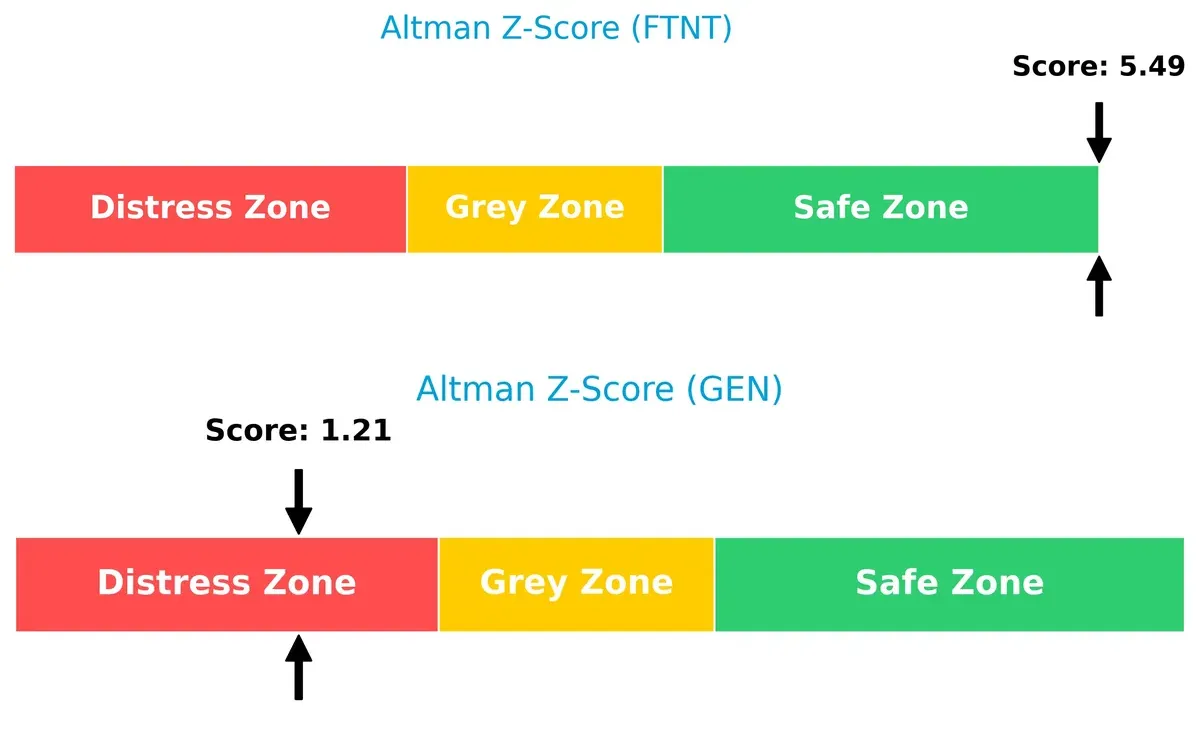
Bankruptcy Risk: Solvency Showdown
Fortinet’s Altman Z-Score of 5.49 places it firmly in the safe zone, whereas Gen’s 1.21 signals distress risk. This gap highlights Fortinet’s stronger long-term survival prospects in this cycle:
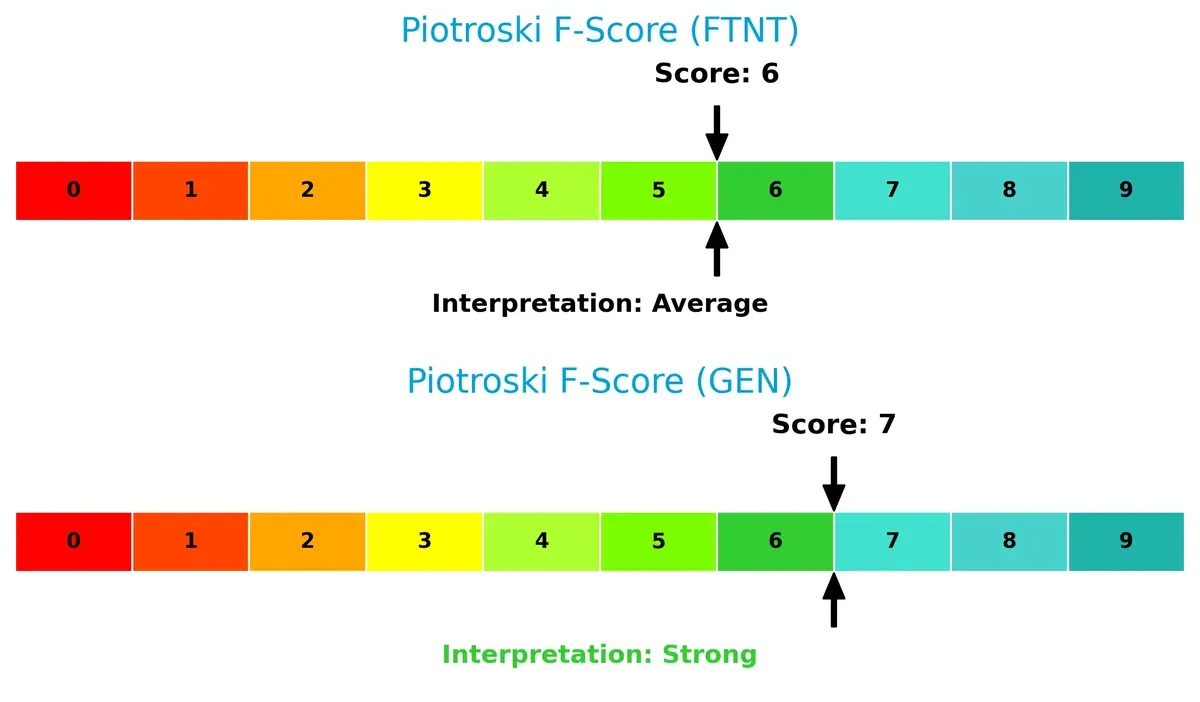
Financial Health: Quality of Operations
Gen Digital’s Piotroski score of 7 surpasses Fortinet’s 6, indicating slightly better financial health and internal metric strength. Fortinet’s score suggests moderate operational quality but some caution remains:
How are the two companies positioned?
This section dissects Fortinet and Gen Digital’s operational DNA by comparing their revenue distribution and internal dynamics. The objective is to confront their economic moats and identify which business model offers the most resilient competitive advantage today.
Revenue Segmentation: The Strategic Mix
The following visual comparison dissects how Fortinet and Gen Digital diversify their income streams and where their primary sector bets lie:
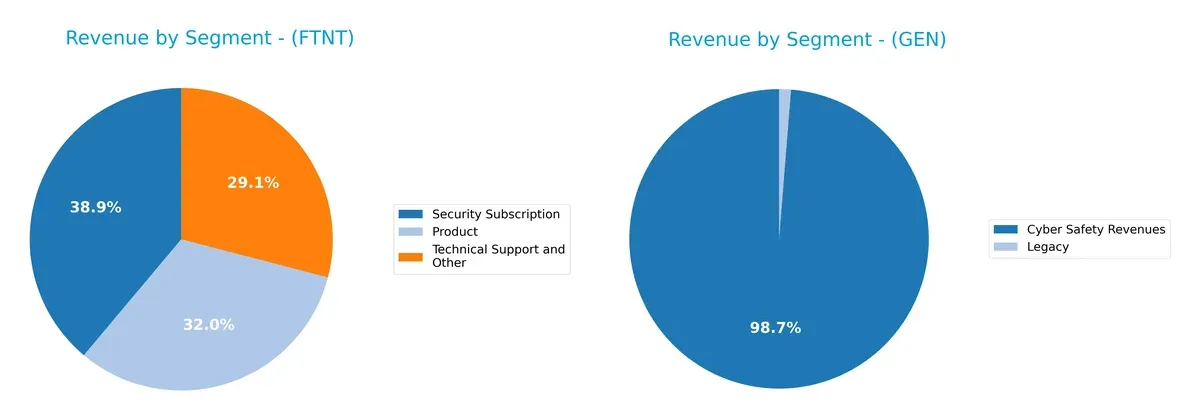
Fortinet’s revenue divides fairly evenly among Security Subscription ($2.3B), Product ($1.9B), and Technical Support ($1.7B), showcasing a balanced ecosystem lock-in strategy. Gen Digital pivots heavily on Cyber Safety ($3.9B in 2025) with minimal Legacy sales ($50M), revealing concentration risk but dominance in consumer security. Fortinet’s diversified mix cushions volatility, while Gen’s focus anchors its brand but may expose it to market shifts.
Strengths and Weaknesses Comparison
This table compares the Strengths and Weaknesses of Fortinet and Gen Digital:
Fortinet Strengths
- Strong profitability with 27.26% net margin and 149.77% ROE
- Favorable debt management with 9.59% debt-to-assets
- Balanced geographic revenue: Americas, EMEA, Asia Pacific
- Diverse revenue streams from products and subscriptions
- High interest coverage ratio at 112.99
Gen Digital Strengths
- Solid net margin at 16.34% and positive ROE of 28.34%
- Favorable WACC at 7.78% supports capital efficiency
- High fixed asset turnover at 36.1 indicates efficient asset use
- Significant revenue from Cyber Safety and Identity products
- Global presence with strong Americas and EMEA revenues
Fortinet Weaknesses
- Elevated valuation multiples with PE of 32.48 and PB of 48.64
- No dividend yield, potentially limiting income investors
- Neutral current ratio at 1.17 may constrain short-term liquidity
- Moderate asset turnover of 0.65 limits capital efficiency
Gen Digital Weaknesses
- Weak liquidity ratios: current and quick ratio at 0.51
- High leverage with debt-to-assets of 53.66% and DE of 3.66
- Unfavorable asset turnover at 0.25 suggests inefficient operations
- PE and PB ratios remain unfavorable despite profitability
Fortinet shows robust profitability and conservative leverage, supporting stable growth and operational efficiency. Gen Digital’s strengths lie in asset utilization and product focus but face liquidity and leverage challenges that may impact financial flexibility.
The Moat Duel: Analyzing Competitive Defensibility
A structural moat is the only thing protecting long-term profits from relentless competition and margin erosion. Here’s how Fortinet and Gen Digital compare:
Fortinet, Inc.: Dominant Network Effects and Integrated Security Ecosystem
Fortinet’s moat stems from strong network effects and integrated cybersecurity solutions. Its ROIC exceeds WACC by 20%, reflecting robust value creation and margin stability. Expansion into Asia Pacific and new managed services deepen its moat in 2026.
Gen Digital Inc.: Subscription-Based Switching Costs Under Pressure
Gen Digital relies on subscription switching costs, but its ROIC trails WACC, signaling value destruction. Unlike Fortinet, its profitability declines with rising interest expenses. Growth hinges on evolving consumer privacy products amid intensifying competition.
Verdict: Network Effects vs. Subscription Lock-in – Fortinet’s Moat Widens the Gap
Fortinet’s growing ROIC and value-creating moat starkly contrast Gen’s shrinking returns and value erosion. Fortinet is far better positioned to defend and expand its market share in an evolving cybersecurity landscape.
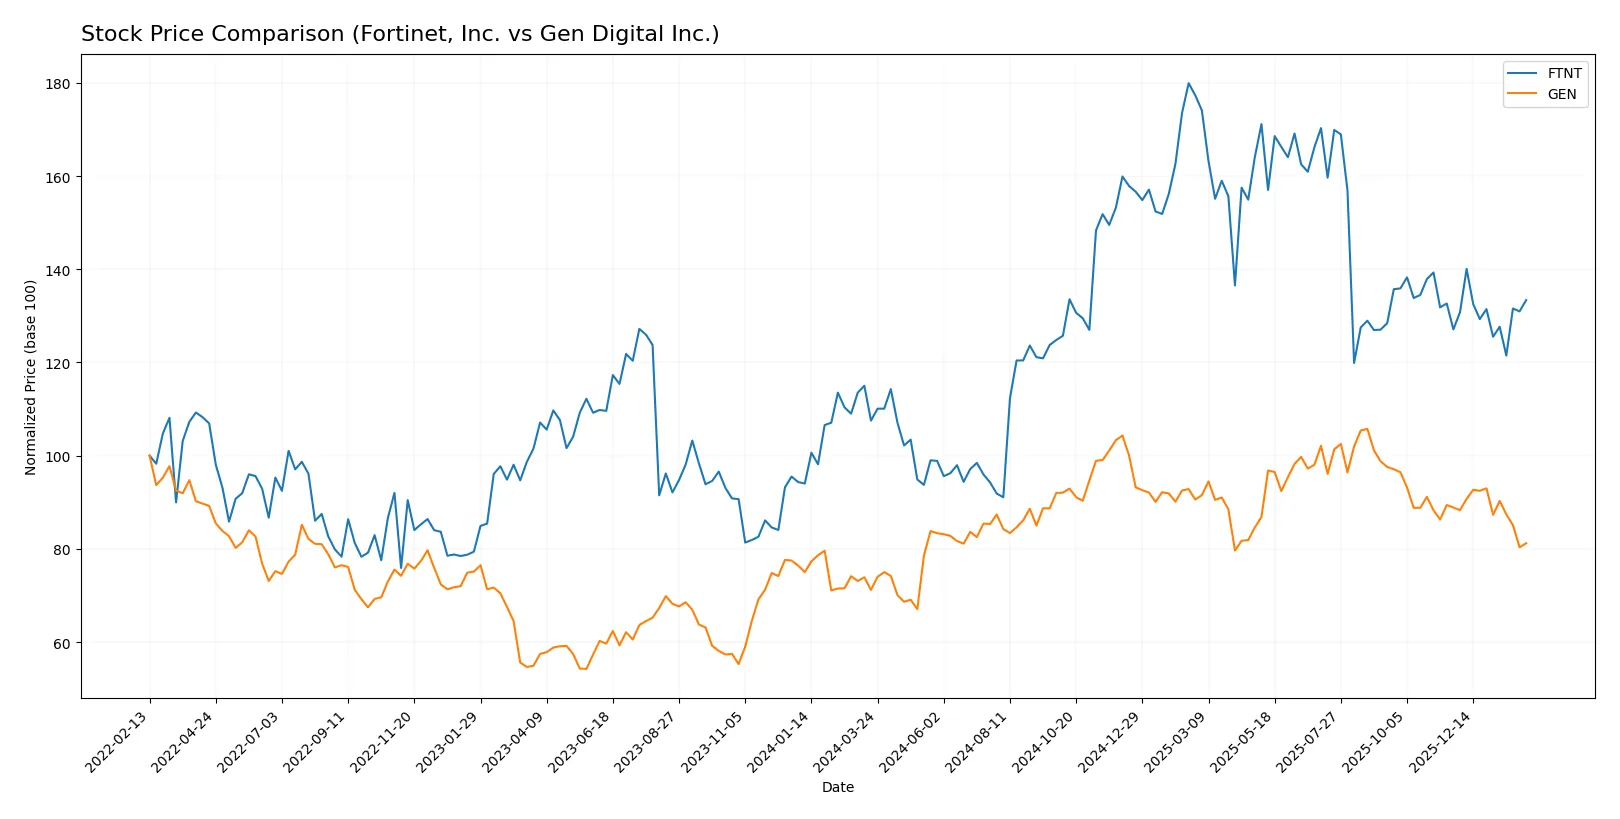
Which stock offers better returns?
Fortinet, Inc. and Gen Digital Inc. have both shown notable price movements over the past 12 months, with distinct trends and trading dynamics shaping their market performance.
Trend Comparison
Fortinet, Inc. posts a bullish trend over the past year with a 24.04% price gain, though momentum is slowing. Its price ranged from 56.51 to 111.64, showing significant volatility (15.07 std dev).
Gen Digital Inc. also shows a bullish trend with a 14.06% gain over 12 months but with decelerating growth. The stock price fluctuated between 20.03 and 31.58, exhibiting lower volatility (2.49 std dev).
Fortinet outperformed Gen Digital in market performance with a higher overall price increase despite recent deceleration affecting both stocks.
Target Prices
Analysts present a clear target price consensus for Fortinet, Inc. and Gen Digital Inc.
| Company | Target Low | Target High | Consensus |
|---|---|---|---|
| Fortinet, Inc. | 70 | 90 | 85 |
| Gen Digital Inc. | 31 | 32 | 31.67 |
Fortinet’s consensus target of 85 sits slightly above its current price of 82.76, indicating modest upside. Gen Digital’s consensus near 31.67 is well above its current 24.25, suggesting stronger expected appreciation.

Don’t Let Luck Decide Your Entry Point
Optimize your entry points with our advanced ProRealTime indicators. You’ll get efficient buy signals with precise price targets for maximum performance. Start outperforming now!
How do institutions grade them?
Fortinet, Inc. Grades
The following table shows recent grades assigned to Fortinet by major institutions:
| Grading Company | Action | New Grade | Date |
|---|---|---|---|
| Rosenblatt | maintain | Buy | 2026-02-06 |
| Mizuho | maintain | Underperform | 2026-02-06 |
| JP Morgan | maintain | Underweight | 2026-02-06 |
| RBC Capital | maintain | Sector Perform | 2026-02-06 |
| Wedbush | maintain | Outperform | 2026-02-06 |
| Scotiabank | downgrade | Sector Perform | 2026-02-02 |
| JP Morgan | maintain | Underweight | 2026-01-30 |
| Rosenblatt | upgrade | Buy | 2026-01-29 |
| TD Cowen | upgrade | Buy | 2026-01-23 |
| Citigroup | maintain | Neutral | 2026-01-13 |
Gen Digital Inc. Grades
The following table shows recent grades assigned to Gen Digital by major institutions:
| Grading Company | Action | New Grade | Date |
|---|---|---|---|
| Barclays | maintain | Equal Weight | 2026-02-06 |
| Evercore ISI Group | maintain | Outperform | 2025-11-07 |
| RBC Capital | maintain | Sector Perform | 2025-11-07 |
| Morgan Stanley | maintain | Equal Weight | 2025-09-02 |
| Barclays | maintain | Equal Weight | 2025-08-08 |
| Wells Fargo | maintain | Overweight | 2025-08-08 |
| RBC Capital | maintain | Sector Perform | 2025-08-08 |
| Barclays | maintain | Equal Weight | 2025-07-14 |
| RBC Capital | maintain | Sector Perform | 2025-05-07 |
| Morgan Stanley | maintain | Equal Weight | 2025-04-16 |
Which company has the best grades?
Fortinet shows a wider range of grades, including multiple Buy and Outperform ratings. Gen Digital mainly holds Equal Weight and Sector Perform grades. Fortinet’s stronger grades could indicate higher expectations from analysts, potentially attracting investors seeking growth opportunities.
Risks specific to each company
The following categories identify the critical pressure points and systemic threats facing both firms in the 2026 market environment:
1. Market & Competition
Fortinet, Inc.
- Operates in a highly competitive cybersecurity sector with strong enterprise demand but faces intense innovation pressure.
Gen Digital Inc.
- Focuses on consumer cyber safety, battling commoditization and aggressive pricing in subscription services.
2. Capital Structure & Debt
Fortinet, Inc.
- Maintains a conservative leverage profile with debt-to-assets at 9.6%, supporting financial stability.
Gen Digital Inc.
- Exhibits high leverage with debt-to-assets at 53.7%, raising concerns about financial risk.
3. Stock Volatility
Fortinet, Inc.
- Beta of 1.05 indicates moderate volatility in line with the tech sector average.
Gen Digital Inc.
- Slightly higher beta at 1.1 suggests elevated price fluctuations relative to the market.
4. Regulatory & Legal
Fortinet, Inc.
- Faces standard cybersecurity compliance requirements across multiple regions, with limited litigation history.
Gen Digital Inc.
- Subject to stringent consumer data privacy laws; increased risk from identity protection service regulations.
5. Supply Chain & Operations
Fortinet, Inc.
- Relies on hardware and software integration, potentially vulnerable to semiconductor supply constraints.
Gen Digital Inc.
- Primarily software-based, less exposed to supply chain disruptions but dependent on digital platform stability.
6. ESG & Climate Transition
Fortinet, Inc.
- Moderate ESG focus; energy use in data centers and hardware manufacturing pose challenges.
Gen Digital Inc.
- Growing emphasis on privacy and ethical data use; ESG risks linked to consumer trust erosion.
7. Geopolitical Exposure
Fortinet, Inc.
- Global footprint across Americas, EMEA, and APAC exposes it to geopolitical tensions and trade restrictions.
Gen Digital Inc.
- Broad international presence with particular sensitivity to data localization laws and cross-border privacy regulations.
Which company shows a better risk-adjusted profile?
Fortinet’s strongest risk is market competition demanding constant innovation and hardware-software integration challenges. Gen Digital’s greatest risk lies in its elevated debt load, straining financial flexibility amid competitive pressures. Fortinet’s safer Altman Z-Score (5.5 vs. 1.2) and balanced leverage signal a better risk-adjusted profile. Recent financials reveal Gen Digital’s debt-to-assets ratio exceeds 50%, a red flag for solvency under stress. This stark difference underscores Fortinet’s more resilient posture in 2026.
Final Verdict: Which stock to choose?
Fortinet, Inc. stands out as a powerhouse of operational efficiency and value creation. Its robust ROIC significantly exceeds its WACC, signaling a durable competitive moat and disciplined capital allocation. A point of vigilance remains its lofty valuation multiples, which could temper near-term upside. This stock suits investors targeting aggressive growth and long-term value appreciation.
Gen Digital Inc. offers a compelling strategic moat built on recurring revenue streams and cloud-based security dominance. Its financial profile, however, carries elevated leverage and liquidity concerns, making it comparatively riskier than Fortinet. Gen fits portfolios aiming for Growth at a Reasonable Price (GARP), balancing growth potential with cautious risk tolerance.
If you prioritize sustainable value creation and operational excellence, Fortinet outshines due to its superior profitability and capital efficiency. However, if you seek exposure to high-growth cloud security with a willingness to navigate financial leverage risks, Gen offers better growth upside but commands a premium in risk. Both represent distinct analytical scenarios suited for different investor profiles.
Disclaimer: Investment carries a risk of loss of initial capital. The past performance is not a reliable indicator of future results. Be sure to understand risks before making an investment decision.
Go Further
I encourage you to read the complete analyses of Fortinet, Inc. and Gen Digital Inc. to enhance your investment decisions: