Home > Comparison > Consumer Cyclical > TSLA vs F
The strategic rivalry between Tesla, Inc. and Ford Motor Company shapes the future of the auto manufacturing sector. Tesla leads as an innovative electric vehicle and energy solutions pioneer, while Ford remains a traditional automotive heavyweight with deep roots in trucks and commercial vehicles. This analysis pits Tesla’s high-growth, tech-driven model against Ford’s established volume-driven approach. I will determine which company offers a superior risk-adjusted outlook for a diversified portfolio.
Table of contents
Companies Overview
Tesla and Ford represent two giants shaping the future of the auto manufacturing industry with distinct approaches.
Tesla, Inc.: Pioneer of Electric Mobility
Tesla dominates the electric vehicle market, generating revenue primarily through its automotive segment and energy products. It sells electric cars, regulatory credits, and offers vehicle services, including financing and insurance. In 2026, Tesla’s strategic focus sharpens on expanding its energy generation and storage business alongside scaling production and software capabilities. This dual-segment model fuels its innovation-driven growth.
Ford Motor Company: Legacy Automaker Embracing Transformation
Ford is a stalwart in traditional and commercial vehicles, earning revenue via sales of trucks, cars, SUVs, and luxury vehicles, alongside financing and leasing services. In 2026, Ford concentrates on electrification through its Ford Model e unit, while maintaining strong commercial vehicle sales and dealer network financing. The company balances legacy manufacturing with new energy vehicle adoption in a competitive global market.
Strategic Collision: Similarities & Divergences
Tesla pursues a closed ecosystem combining direct sales with energy solutions, contrasting Ford’s dealer-based, open distribution model. Both compete fiercely in electric vehicles, but Tesla’s innovation edge challenges Ford’s scale and legacy strength. Tesla’s high-beta growth profile differs from Ford’s dividend-paying, value-oriented stance, offering investors contrasting risk and reward dynamics within the auto sector.
Income Statement Comparison
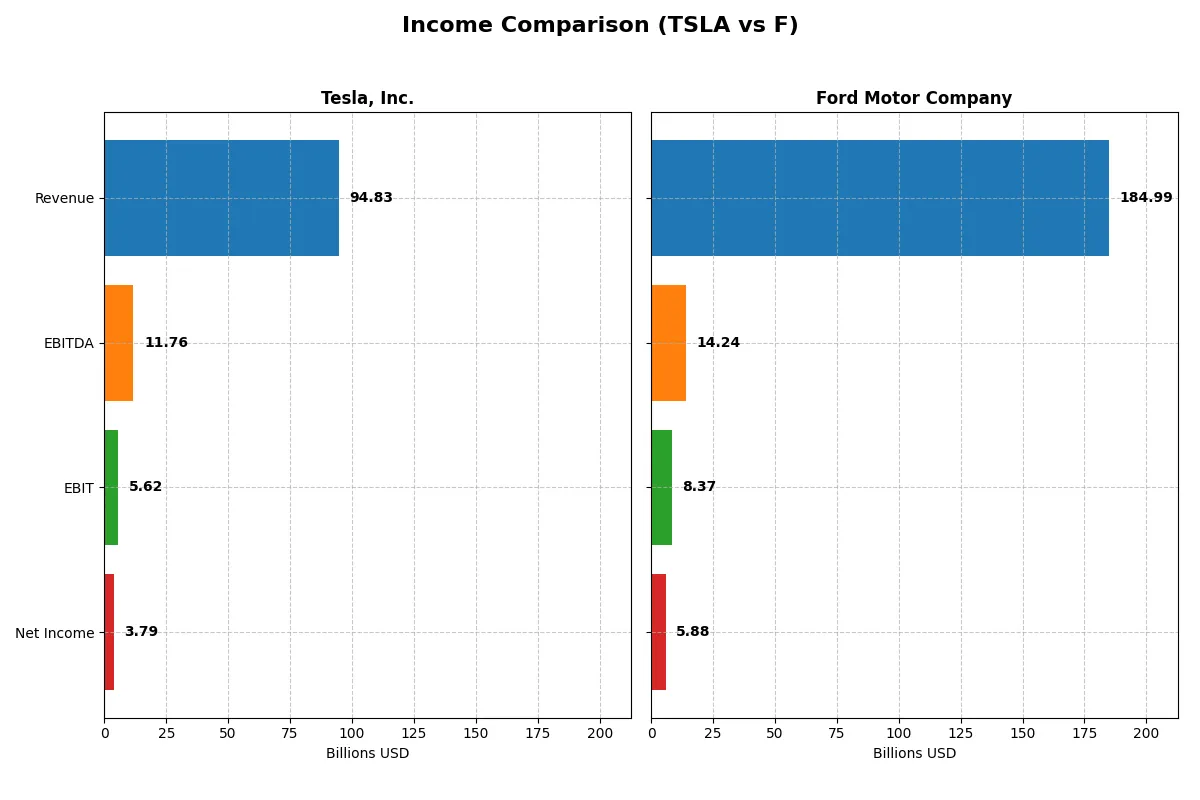
The following data dissects the core profitability and scalability of both corporate engines to reveal who dominates the bottom line:
| Metric | Tesla, Inc. (TSLA) | Ford Motor Company (F) |
|---|---|---|
| Revenue | 94.8B | 185.0B |
| Cost of Revenue | 77.7B | 169.5B |
| Operating Expenses | 12.7B | 10.3B |
| Gross Profit | 17.1B | 15.5B |
| EBITDA | 11.8B | 14.2B |
| EBIT | 5.6B | 8.4B |
| Interest Expense | 0.3B | 1.1B |
| Net Income | 3.8B | 5.9B |
| EPS | 1.18 | 1.48 |
| Fiscal Year | 2025 | 2024 |
Income Statement Analysis: The Bottom-Line Duel
This income statement comparison reveals which company runs its financial engine with greater efficiency and sustainable momentum.
Tesla, Inc. Analysis
Tesla’s revenue rose 76% from 2021 to 2025 but dipped 2.9% last year to $94.8B. Net income plunged 31% over five years and halved last year to $3.8B, dragging net margin down to 4.0%. Gross margin sits at 18%, showing decent cost control, yet EBIT dropped nearly 40%, signaling weakening operating efficiency. Recent trends highlight stalled momentum and margin pressures.
Ford Motor Company Analysis
Ford’s revenue expanded 45.5% over five years, reaching $185B in 2024 with 5% growth last year. Net income surged 560% over the period, hitting $5.9B, while net margin improved to 3.2%. Gross margin is lower at 8.4%, but EBIT jumped 58% last year to $8.4B, reflecting stronger operational leverage. Ford shows improving profitability and positive momentum despite a slimmer margin profile.
Margin Efficiency vs. Growth Momentum
Tesla commands a higher gross margin but suffers declining net income and margin erosion, undermining its financial momentum. Ford, though operating with a thinner gross margin, consistently grows revenue and net income, boosting profitability and EBIT sharply. Investors seeking robust earnings growth may favor Ford’s improving margin trajectory over Tesla’s recent profitability setbacks.
Financial Ratios Comparison
These vital ratios act as a diagnostic tool to expose the underlying fiscal health, valuation premiums, and capital efficiency of the companies analyzed below:
| Ratios | Tesla, Inc. (TSLA) | Ford Motor Company (F) |
|---|---|---|
| ROE | 4.62% | 13.11% |
| ROIC | 2.95% | 1.81% |
| P/E | 383 | 6.70 |
| P/B | 17.69 | 0.88 |
| Current Ratio | 2.16 | 1.16 |
| Quick Ratio | 1.77 | 1.02 |
| D/E (Debt-to-Equity) | 0.10 | 3.59 |
| Debt-to-Assets | 6.08% | 56.40% |
| Interest Coverage | 12.88 | 4.59 |
| Asset Turnover | 0.69 | 0.65 |
| Fixed Asset Turnover | 2.33 | 2.85 |
| Payout Ratio | 0 | 53.04% |
| Dividend Yield | 0% | 7.92% |
| Fiscal Year | 2025 | 2024 |
Efficiency & Valuation Duel: The Vital Signs
Financial ratios act as a company’s DNA, exposing hidden risks and revealing operational excellence beyond surface-level metrics.
Tesla, Inc.
Tesla’s ROE at 4.62% and net margin of 4.0% reveal subdued profitability compared to its lofty valuation. The P/E ratio of 383 signals an extremely stretched stock price. Tesla maintains a strong current ratio of 2.16 and low debt, supporting financial stability. However, it pays no dividends, reinvesting heavily in R&D to fuel growth.
Ford Motor Company
Ford posts a healthier ROE of 13.11% but struggles with a thin net margin of 3.18%. Its P/E of 6.7 and P/B below 1 highlight an attractively valued stock. The company’s moderate current ratio and higher debt load present some risks. Ford returns value through a 7.92% dividend yield, catering to income-focused investors.
Premium Valuation vs. Operational Safety
Tesla’s premium valuation contrasts with Ford’s attractive price and dividend income. Tesla’s reinvestment strategy suits growth seekers, while Ford offers a more balanced risk-reward profile. Investors prioritizing stability and yield may prefer Ford; those betting on innovation might lean toward Tesla.
Which one offers the Superior Shareholder Reward?
I compare Tesla and Ford’s shareholder rewards by focusing on dividends and buybacks. Ford pays a 7.9% dividend yield with a 53% payout ratio, showing strong income focus despite heavy debt (debt/equity 3.59). Tesla pays no dividend but reinvests free cash flow (1.9B FCF) into growth and share buybacks. Tesla’s buyback program and zero dividend payout ratio reflect a growth-driven capital allocation. Ford’s moderate free cash flow coverage (44%) for dividends signals risk in sustaining payout amid leverage. Tesla’s balance sheet strength and reinvestment strategy offer more sustainable, long-term value. I conclude Tesla provides superior total returns in 2026 due to growth potential and prudent capital allocation, while Ford’s high dividend yield carries higher financial risk.
Comparative Score Analysis: The Strategic Profile
The radar chart reveals the fundamental DNA and trade-offs of Tesla and Ford, highlighting their core financial strengths and vulnerabilities:
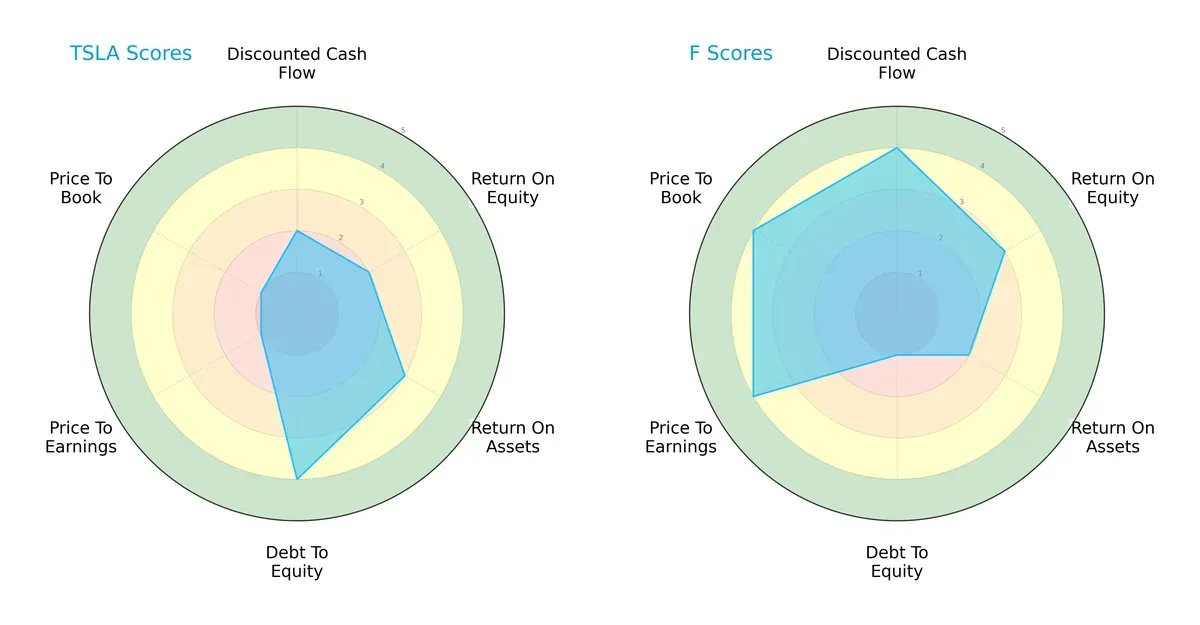
Tesla shows strength in asset utilization and conservative leverage, with a debt-to-equity score of 4 indicating a solid balance sheet. However, its valuation metrics (P/E and P/B scores of 1) suggest the market currently perceives it as overvalued or facing challenges in justified pricing. Ford, conversely, excels in discounted cash flow and valuation scores (both 4), signaling undervaluation and strong future cash flow prospects despite a weaker debt-to-equity score of 1, which points to higher leverage risk. Overall, Ford presents a more balanced financial profile, while Tesla leans heavily on balance sheet strength and asset efficiency.
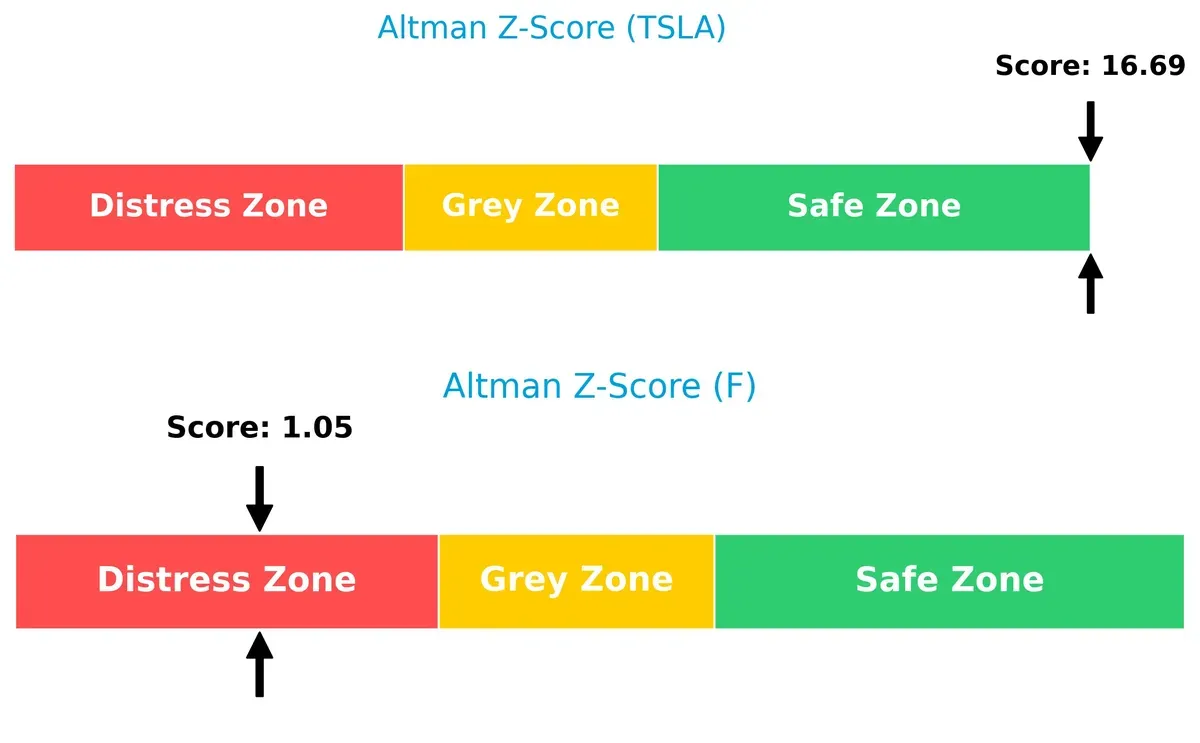
Bankruptcy Risk: Solvency Showdown
Tesla’s Altman Z-Score of 16.7 places it firmly in the safe zone, signaling exceptionally low bankruptcy risk. Ford’s score of 1.05 lands in the distress zone, indicating significant solvency concerns and higher default probability in this cycle:
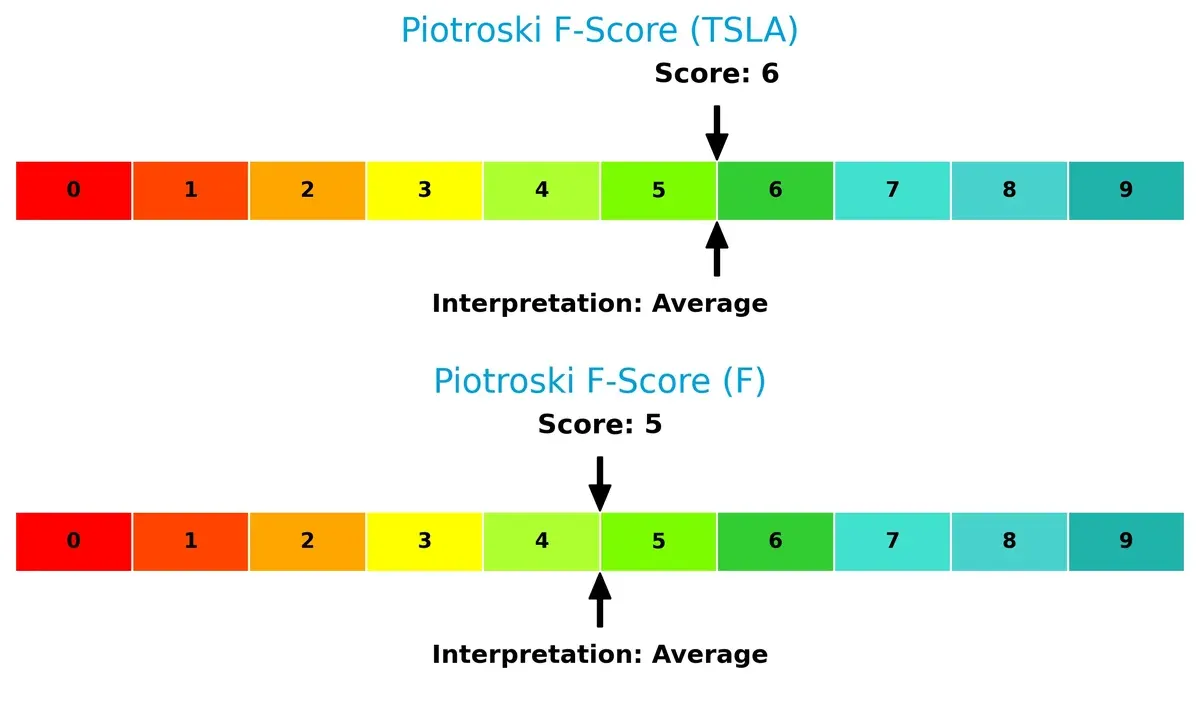
Financial Health: Quality of Operations
Both Tesla and Ford exhibit average Piotroski F-Scores—6 and 5 respectively—implying moderate financial health. Neither company shows acute red flags, but Tesla’s slightly higher score suggests marginally better operational quality and internal financial stability:
How are the two companies positioned?
This section dissects Tesla and Ford’s operational DNA by comparing their revenue distribution and internal dynamics. The goal is to confront their economic moats and reveal which offers the most resilient competitive advantage today.
Revenue Segmentation: The Strategic Mix
This comparison dissects how Tesla, Inc. and Ford Motor Company diversify their income streams and reveals where their primary sector bets lie:
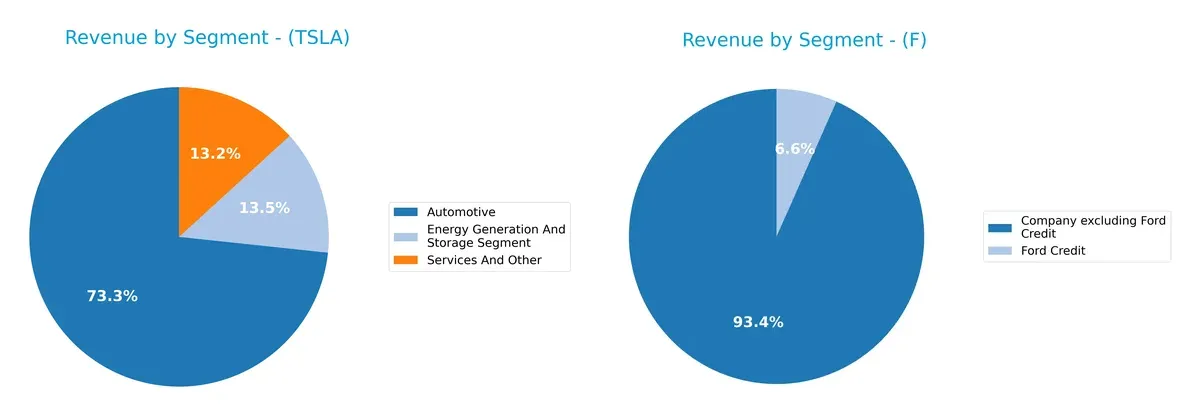
Tesla’s revenue pivots heavily on Automotive, generating $69.5B in 2025, while Energy Storage and Services each contribute around $12.7B and $12.5B. Ford leans on its core Automotive and Ford Credit segments, with $173B and $12.3B respectively in 2024. Tesla shows more diversification across tech-driven segments, reducing concentration risk. Ford’s reliance on traditional automotive sales anchors it to cyclical industry pressures but benefits from a stable finance arm.
Strengths and Weaknesses Comparison
This table compares the Strengths and Weaknesses of Tesla, Inc. and Ford Motor Company:
Tesla Strengths
- Diversified revenue streams across Automotive, Energy, and Services segments
- Strong global presence with significant sales in the US, China, and other countries
- Favorable liquidity ratios indicating solid short-term financial health
Ford Strengths
- Wide geographic diversification with strong sales in the US, Canada, UK, and Mexico
- Favorable valuation metrics with low PE and PB ratios
- Lower WACC than Tesla suggesting cheaper capital cost
Tesla Weaknesses
- Unfavorable profitability metrics including low net margin, ROE, and ROIC
- High valuation multiples may pressure returns
- Absence of dividend yield could deter income investors
Ford Weaknesses
- High debt levels reflected in debt-to-assets and debt-to-equity ratios
- Unfavorable profitability with low net margin and ROIC
- Neutral to low current ratio signals weaker short-term liquidity
Tesla’s strength lies in its diversified product and geographic mix coupled with strong liquidity. Ford benefits from valuation attractiveness and global sales breadth but faces challenges with leverage and profitability. Each company’s financial and market profile implies distinct strategic priorities.
The Moat Duel: Analyzing Competitive Defensibility
A structural moat is the only reliable shield protecting long-term profits from relentless competitive erosion:
Tesla, Inc.: Innovation and Brand Intangibles
Tesla’s moat stems from strong intangible assets and innovation leadership. This results in premium pricing and margin resilience despite recent profit declines. New product launches and energy ventures could either deepen or strain this moat in 2026.
Ford Motor Company: Operational Efficiency and Scale
Ford’s moat lies in cost advantages and scale economies, contrasting Tesla’s innovation edge. Ford’s improving ROIC trend signals growing operational strength. Expansion in electric and commercial vehicles offers significant upside opportunities.
Innovation Leadership vs. Scale Efficiency
Tesla’s shrinking ROIC signals weakening economic value, while Ford’s rising ROIC trend suggests improving profitability. Despite Tesla’s brand strength, Ford currently possesses a deeper moat better positioned to defend market share in evolving automotive markets.
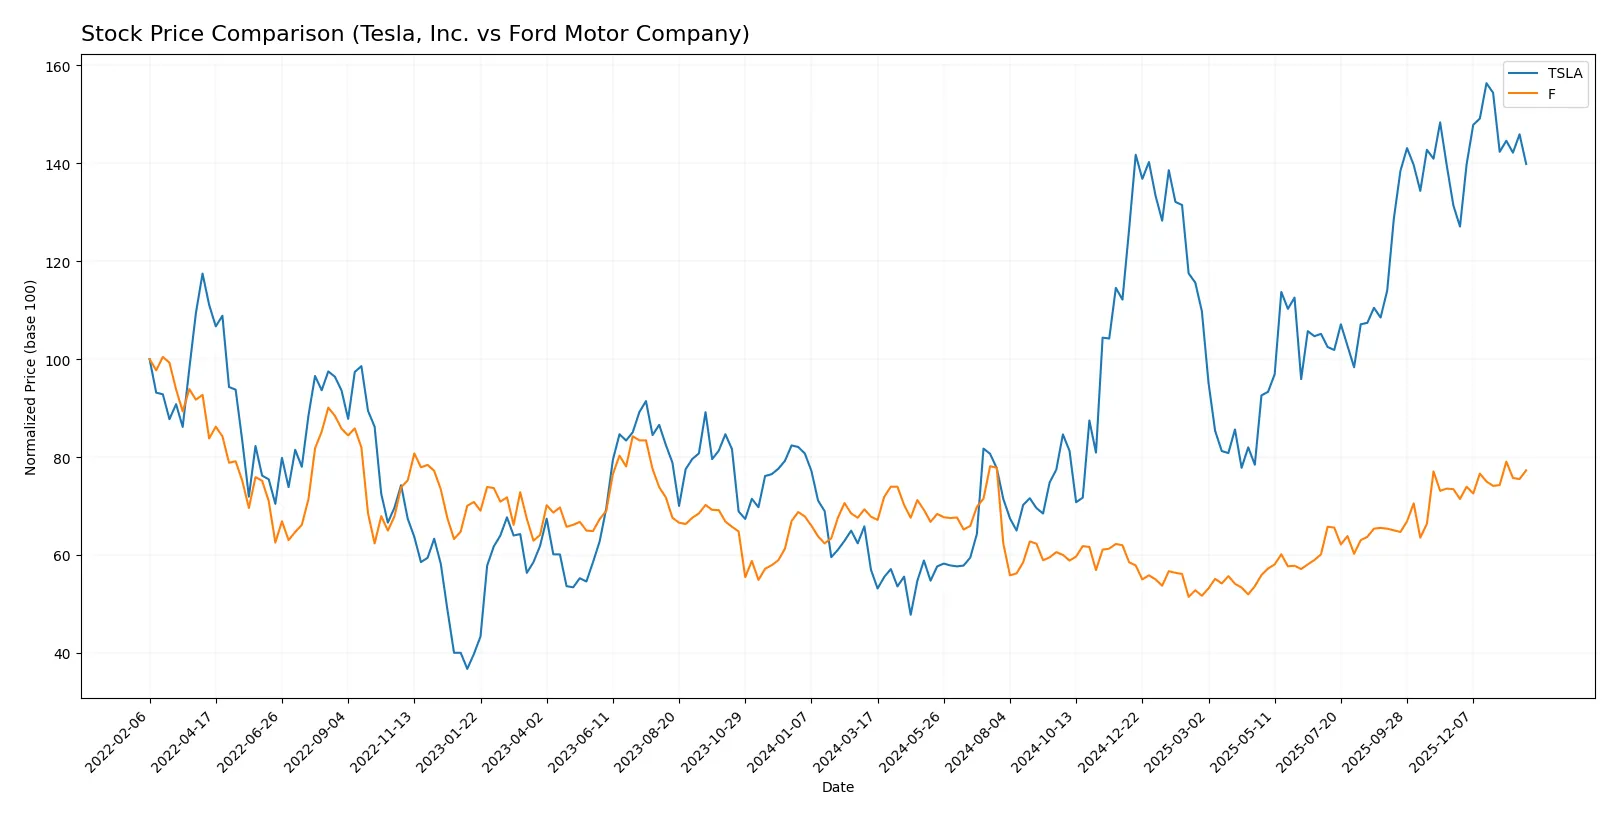
Which stock offers better returns?
The past year shows stark contrasts in price dynamics between Tesla and Ford, with Tesla’s stock surging substantially while Ford’s gains remain modest and gradually accelerating.
Trend Comparison
Tesla’s price rose 145.47% over the past 12 months, marking a strong bullish trend despite decelerating momentum. Its volatility is high, with a 96.04 standard deviation and a peak price of 481.2.
Ford’s stock increased 13.96% over the same period, reflecting a bullish trend with accelerating momentum. Volatility remains low at 1.32 standard deviation, with a highest price of 14.2.
Tesla’s performance significantly outpaces Ford’s, delivering the highest market returns despite deceleration in trend acceleration.
Target Prices
Analysts present a clear consensus on target prices for Tesla, Inc. and Ford Motor Company.
| Company | Target Low | Target High | Consensus |
|---|---|---|---|
| Tesla, Inc. | 300 | 600 | 459 |
| Ford Motor Company | 11 | 16 | 12.91 |
Tesla’s target consensus of $459 sits above its current price of $430, indicating moderate upside potential. Ford’s $12.91 consensus is slightly below its current $13.88 price, suggesting limited near-term growth expectations.

Don’t Let Luck Decide Your Entry Point
Optimize your entry points with our advanced ProRealTime indicators. You’ll get efficient buy signals with precise price targets for maximum performance. Start outperforming now!
How do institutions grade them?
The following tables summarize recent institutional grades for Tesla, Inc. and Ford Motor Company:
Tesla, Inc. Grades
This table outlines recent grades issued by reputable financial institutions on Tesla shares.
| Grading Company | Action | New Grade | Date |
|---|---|---|---|
| Morgan Stanley | Maintain | Equal Weight | 2026-01-29 |
| Mizuho | Maintain | Outperform | 2026-01-29 |
| Wells Fargo | Maintain | Underweight | 2026-01-29 |
| GLJ Research | Maintain | Sell | 2026-01-29 |
| Wedbush | Maintain | Outperform | 2026-01-29 |
| Cantor Fitzgerald | Maintain | Overweight | 2026-01-29 |
| RBC Capital | Maintain | Outperform | 2026-01-29 |
| Truist Securities | Maintain | Hold | 2026-01-29 |
| Needham | Maintain | Hold | 2026-01-29 |
| Barclays | Maintain | Equal Weight | 2026-01-23 |
Ford Motor Company Grades
Recent institutional grades for Ford shares are detailed in this table.
| Grading Company | Action | New Grade | Date |
|---|---|---|---|
| Barclays | Maintain | Equal Weight | 2026-01-23 |
| JP Morgan | Maintain | Overweight | 2026-01-21 |
| UBS | Maintain | Neutral | 2026-01-14 |
| HSBC | Maintain | Hold | 2026-01-13 |
| TD Cowen | Maintain | Hold | 2026-01-13 |
| Piper Sandler | Upgrade | Overweight | 2026-01-08 |
| Evercore ISI Group | Maintain | In Line | 2025-12-22 |
| Morgan Stanley | Maintain | Equal Weight | 2025-12-08 |
| Evercore ISI Group | Maintain | In Line | 2025-11-24 |
| Barclays | Maintain | Equal Weight | 2025-10-27 |
Which company has the best grades?
Tesla exhibits a wider grade range, including multiple Outperform and Overweight ratings, while Ford mostly receives Hold and Equal Weight grades. Tesla’s stronger grades suggest higher institutional confidence, potentially affecting investor sentiment and valuation.
Risks specific to each company
The following categories identify critical pressure points and systemic threats facing Tesla, Inc. and Ford Motor Company in the 2026 market environment:
1. Market & Competition
Tesla, Inc.
- Leads EV innovation but faces intensifying competition and high valuation risks.
Ford Motor Company
- Strong legacy brand with growing EV efforts but pressured by slower innovation and market share loss.
2. Capital Structure & Debt
Tesla, Inc.
- Maintains low debt-to-equity (0.1) and strong interest coverage (16.6x), reducing financial risk.
Ford Motor Company
- High leverage (D/E 3.59) and significant debt-to-assets (56.4%) increase financial vulnerability despite adequate interest coverage.
3. Stock Volatility
Tesla, Inc.
- Beta of 1.835 signals higher volatility, typical for growth tech-oriented firms.
Ford Motor Company
- Lower beta (1.631) indicates less volatility but still sensitive to cyclical and industry risks.
4. Regulatory & Legal
Tesla, Inc.
- Exposure to evolving EV incentives and emissions regulations worldwide.
Ford Motor Company
- Faces legacy regulatory challenges and compliance costs in traditional and emerging vehicle segments.
5. Supply Chain & Operations
Tesla, Inc.
- Focus on vertical integration improves control but sensitive to raw material costs and production scaling.
Ford Motor Company
- More dependent on traditional supply chains, vulnerable to global parts shortages and logistics disruptions.
6. ESG & Climate Transition
Tesla, Inc.
- Strong ESG narrative centered on clean energy and sustainability initiatives.
Ford Motor Company
- Accelerating climate transition efforts but legacy operations complicate ESG progress and perception.
7. Geopolitical Exposure
Tesla, Inc.
- Global footprint with significant China exposure, risking trade tensions impact.
Ford Motor Company
- Also globally diversified but more focused on North American and European markets, moderating geopolitical risk.
Which company shows a better risk-adjusted profile?
Tesla’s primary risk lies in its stretched valuation and high stock volatility amid competitive pressure. Ford’s biggest risk is its heavy debt burden compromising financial flexibility. Despite Tesla’s growth risks, its superior balance sheet and innovation moat deliver a cleaner risk-adjusted profile. Ford’s distress-level Altman Z-score and elevated leverage warrant caution despite favorable valuation multiples.
Final Verdict: Which stock to choose?
Tesla’s superpower lies in its market-leading innovation and brand strength, driving premium positioning in electric vehicles. However, its declining profitability and high valuation multiples remain points of vigilance. Tesla fits investors seeking aggressive growth with tolerance for volatility and execution risks.
Ford’s moat stems from its deep manufacturing scale and steady cash flow, supported by improving profitability and attractive valuation metrics. It offers better financial stability than Tesla but carries legacy debt risks. Ford suits investors focused on growth at a reasonable price and income stability.
If you prioritize cutting-edge innovation and are comfortable with elevated valuation and profit margin pressures, Tesla is compelling. However, if you seek more stable cash flow and valuation discipline with improving returns, Ford offers better stability and value. Each presents distinct investment scenarios depending on risk appetite and growth expectations.
Disclaimer: Investment carries a risk of loss of initial capital. The past performance is not a reliable indicator of future results. Be sure to understand risks before making an investment decision.
Go Further
I encourage you to read the complete analyses of Tesla, Inc. and Ford Motor Company to enhance your investment decisions: