Home > Comparison > Consumer Cyclical > GM vs F
The strategic rivalry between General Motors Company and Ford Motor Company shapes the future of the global automotive industry. GM operates as a diversified auto manufacturer with integrated technology and financing services. Ford focuses on commercial vehicles and innovative financing solutions, balancing legacy strength with electric mobility investments. This analysis compares their distinct corporate models to determine which offers superior risk-adjusted returns for a diversified portfolio in today’s evolving automotive landscape.

Table of contents
Companies Overview
General Motors Company and Ford Motor Company dominate the US auto manufacturing landscape with distinct strategic approaches.
General Motors Company: Global Auto Innovator
General Motors commands the global automotive market with a diverse portfolio including trucks, crossovers, and electric vehicles. Its core revenue flows from vehicle sales and automotive financing. In 2026, GM strategically advances autonomous driving and connected vehicle technologies, emphasizing software-enabled services as a growth lever.
Ford Motor Company: American Legacy Automaker
Ford focuses on trucks, SUVs, and commercial vehicles, generating revenue through vehicle sales and comprehensive financing solutions. Its 2026 strategy centers on electrification and the expansion of its commercial vehicle segment, blending traditional manufacturing with innovative mobility solutions.
Strategic Collision: Similarities & Divergences
Both companies compete fiercely in electric and commercial vehicle markets but diverge in execution. GM prioritizes a software-driven ecosystem with autonomous tech, while Ford leans on electrification and commercial fleet dominance. Their investment profiles reflect this contrast: GM offers tech-forward growth potential; Ford emphasizes legacy resilience with a pivot to electrification.
Income Statement Comparison
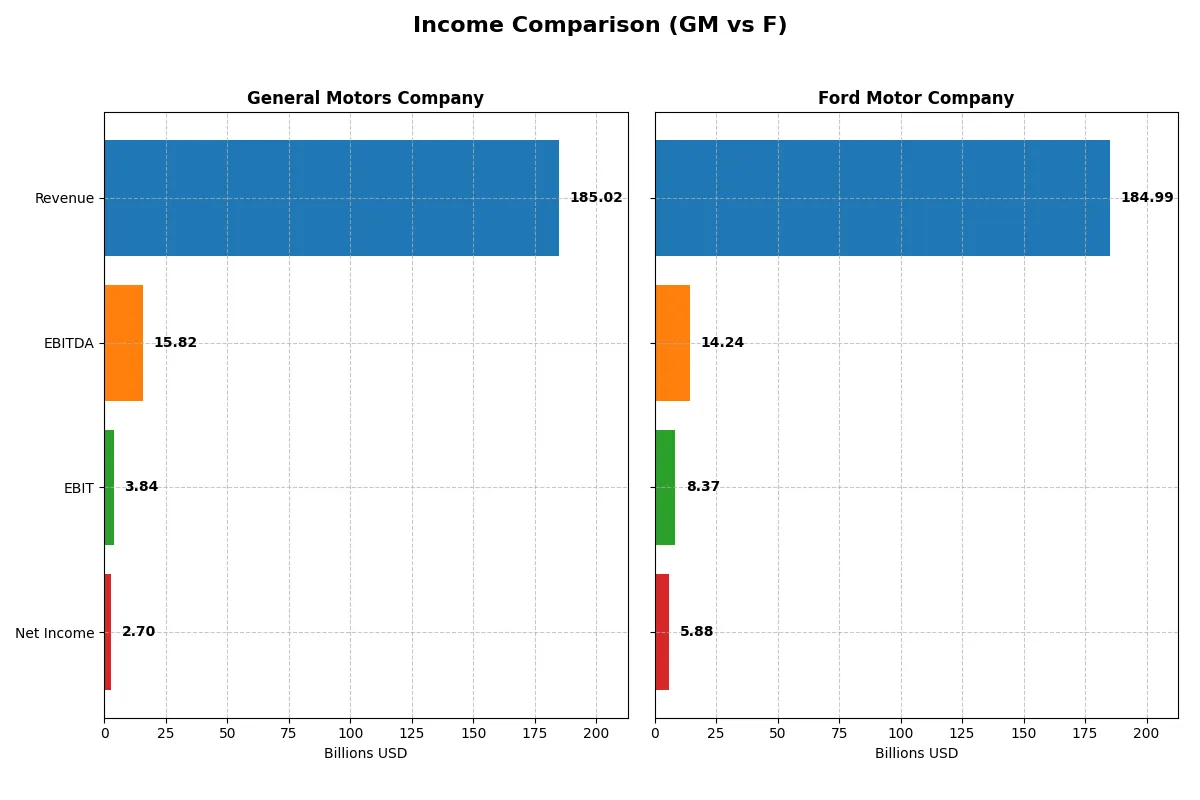
This data dissects the core profitability and scalability of both corporate engines to reveal who dominates the bottom line:
| Metric | General Motors Company (GM) | Ford Motor Company (F) |
|---|---|---|
| Revenue | 185.0B | 185.0B |
| Cost of Revenue | 173.4B | 169.5B |
| Operating Expenses | 8.7B | 10.3B |
| Gross Profit | 11.6B | 15.5B |
| EBITDA | 15.8B | 14.2B |
| EBIT | 3.8B | 8.4B |
| Interest Expense | 727M | 1.14B |
| Net Income | 2.7B | 5.9B |
| EPS | 3.33 | 1.48 |
| Fiscal Year | 2025 | 2024 |
Income Statement Analysis: The Bottom-Line Duel
This income statement comparison reveals which automaker drives superior efficiency and profit generation in a challenging market environment.
General Motors Company Analysis
GM’s revenue rose 45.7% from 2021 to 2025, peaking at $187B in 2024 before slipping slightly to $185B in 2025. Its net income, however, declined sharply by 73% over the period, dropping from $10B in 2023 to $2.7B in 2025. Gross margin compressed to 6.3% in 2025, signaling rising costs. The net margin of 1.5% reflects diminished profitability and operational headwinds in the latest year.
Ford Motor Company Analysis
Ford’s revenue advanced steadily, growing 45.5% from 2020 to 2024, reaching $185B in 2024. Net income surged by over 550%, recovering from a $1.3B loss in 2020 to $5.9B in 2024. Ford’s gross margin held firm at 8.4%, outperforming GM. Its net margin expanded to 3.2%, highlighting improved operational leverage and a robust earnings rebound in the most recent fiscal year.
Margin Power vs. Earnings Momentum
Ford clearly outpaces GM in profitability metrics, boasting superior gross and net margins alongside strong earnings growth momentum. GM’s revenue scale is comparable but masks deteriorating net income and margin contraction. For investors prioritizing financial resilience and margin expansion, Ford’s profile offers a more attractive combination of profit recovery and operational efficiency.
Financial Ratios Comparison
These vital ratios act as a diagnostic tool to expose the underlying fiscal health, valuation premiums, and capital efficiency of the companies compared below:
| Ratios | General Motors Company (GM) | Ford Motor Company (F) |
|---|---|---|
| ROE | 4.41% | 13.11% |
| ROIC | 1.16% | 1.81% |
| P/E | 27.7 | 6.70 |
| P/B | 1.22 | 0.88 |
| Current Ratio | 1.17 | 1.16 |
| Quick Ratio | 1.01 | 1.02 |
| D/E (Debt-to-Equity) | 2.13 | 3.59 |
| Debt-to-Assets | 46.3% | 56.4% |
| Interest Coverage | 4.00 | 4.59 |
| Asset Turnover | 0.66 | 0.65 |
| Fixed Asset Turnover | 2.17 | 2.85 |
| Payout Ratio | 24.4% | 53.0% |
| Dividend Yield | 0.88% | 7.92% |
| Fiscal Year | 2025 | 2024 |
Efficiency & Valuation Duel: The Vital Signs
Ratios act as a company’s DNA, exposing hidden risks and operational excellence critical for informed investment decisions.
General Motors Company
GM shows weak profitability with a low ROE of 4.41% and a slim net margin of 1.46%. The stock appears expensive trading at a P/E of 27.72 despite a reasonable P/B of 1.22. Shareholder returns are modest with a low dividend yield of 0.88%, reflecting a cautious capital allocation amid high debt levels.
Ford Motor Company
Ford delivers a stronger ROE of 13.11% and a healthier net margin of 3.18%, trading at an attractive P/E of 6.7 and P/B of 0.88. The stock appears undervalued relative to peers. Ford offers a generous dividend yield near 7.92%, balancing shareholder returns against elevated leverage and moderate profitability.
Balanced Valuation Meets Operational Trade-offs
Ford presents a better blend of valuation and profitability metrics, with a lower P/E and stronger ROE. GM’s higher valuation and weaker returns suggest greater risk. Investors seeking value and income may prefer Ford, while those favoring stability face a more cautious GM profile.
Which one offers the Superior Shareholder Reward?
I observe that Ford delivers a higher dividend yield near 8.0% in 2024, versus GM’s sub-1.1%. Ford’s payout ratio exceeds 50%, signaling aggressive income distribution, while GM maintains a conservative 24%. GM’s free cash flow per share stands positive at $12.0, supporting steady dividends and buybacks. Ford also executes buybacks but carries heavier debt (debt-to-equity 3.6 vs. GM’s 2.1), raising sustainability concerns. GM’s balanced payout and capital discipline suggest a more durable shareholder return over market cycles. I favor GM for a superior total return profile in 2026.
Comparative Score Analysis: The Strategic Profile
The radar chart reveals the fundamental DNA and trade-offs of General Motors Company and Ford Motor Company, highlighting their distinct strategic strengths and vulnerabilities:
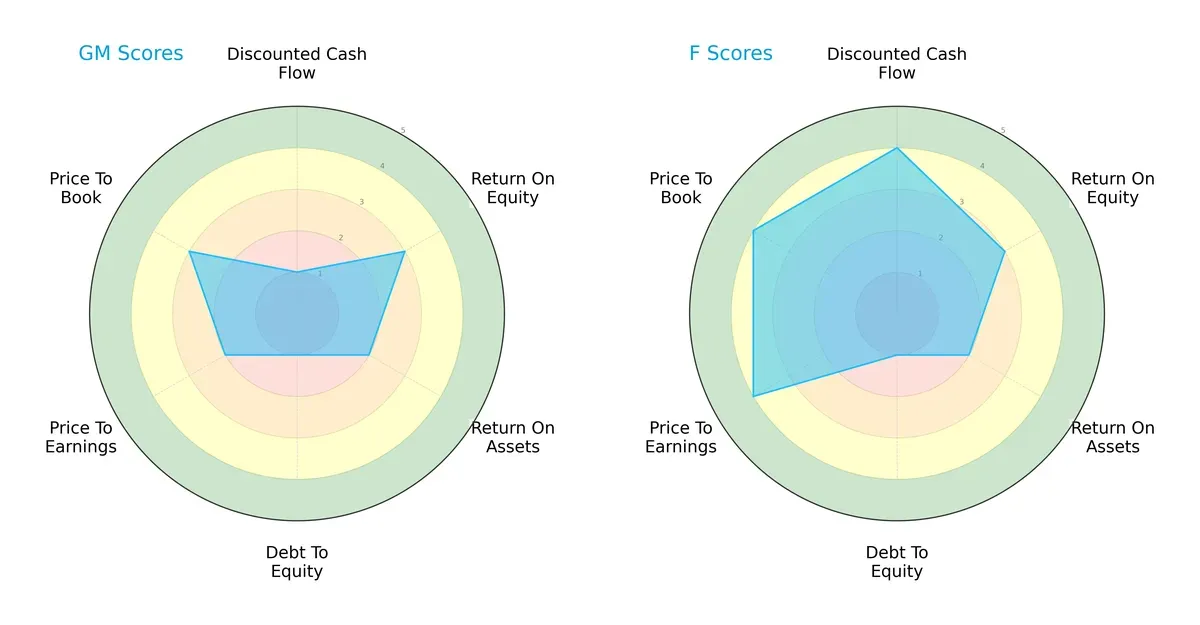
Ford delivers a stronger discounted cash flow and valuation profile, scoring 4 on DCF and P/E metrics, compared to GM’s weaker 1 and 2. Both firms share moderate efficiency, with equal ROE (3) and ROA (2) scores. However, both suffer from high leverage risk, scoring 1 on debt-to-equity. GM’s valuation metrics lag behind Ford, reflecting a less compelling market discount. Overall, Ford presents a more balanced and favorable financial scorecard, whereas GM relies heavily on moderate profitability with weak cash flow and balance sheet health.
Bankruptcy Risk: Solvency Showdown
The Altman Z-Scores place both GM (1.24) and Ford (1.05) in the distress zone, signaling high bankruptcy risk amid current market pressures:
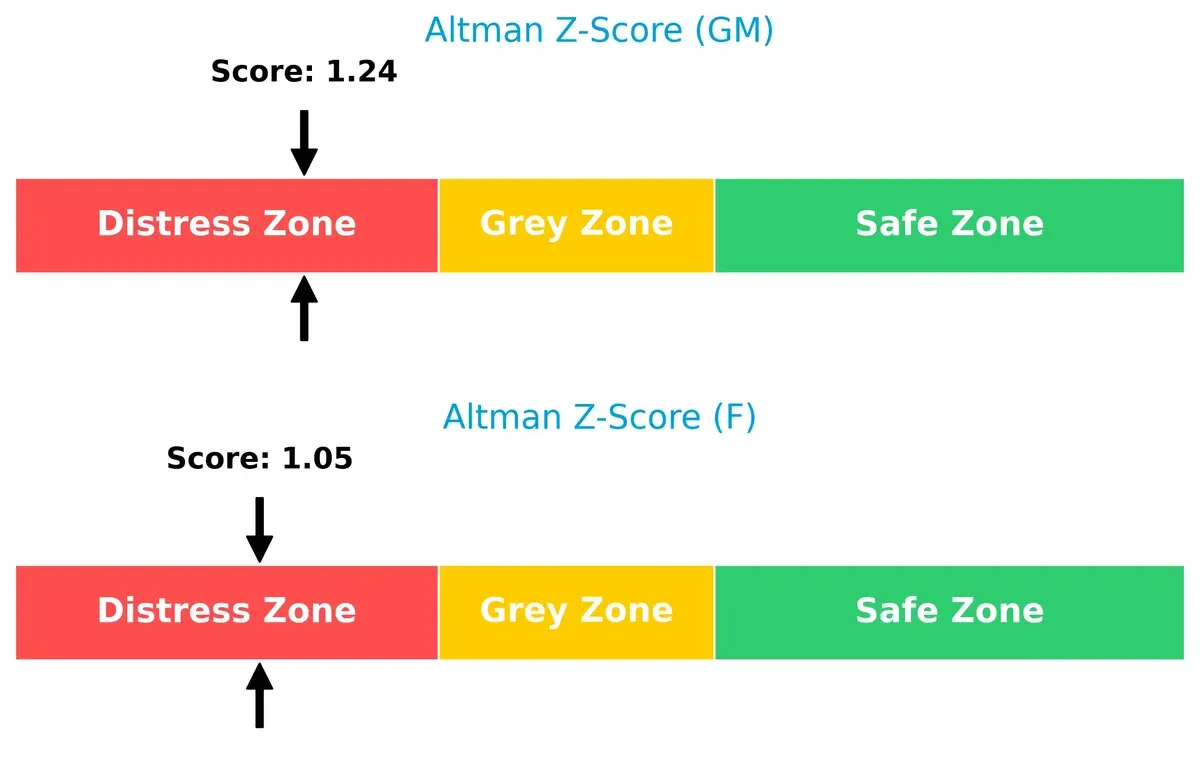
Both automakers face significant solvency challenges. GM’s marginally higher score suggests a slightly better buffer but still signals financial distress. Long-term survival requires urgent deleveraging and cash flow improvement to avoid default as cyclical headwinds persist.
Financial Health: Quality of Operations
Piotroski F-Scores indicate average financial health for both GM (6) and Ford (5), with neither company demonstrating peak operational strength:
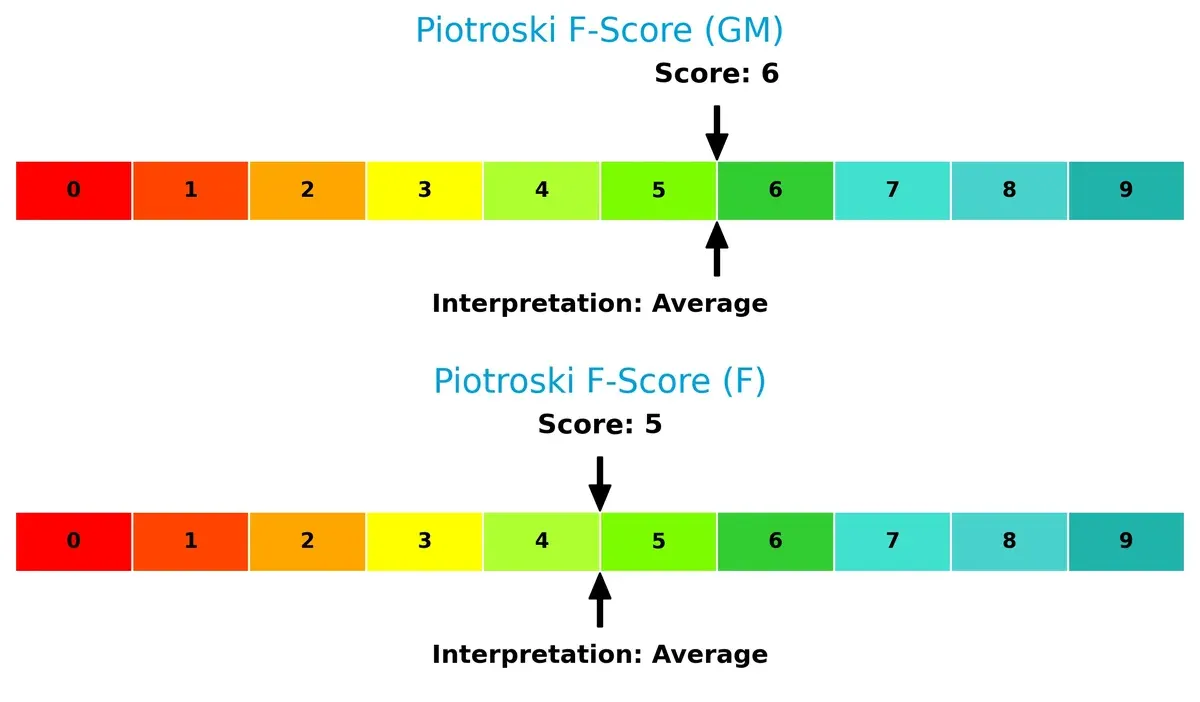
These middling scores suggest both firms maintain adequate but not robust internal financial metrics. Neither shows immediate red flags, but the modest scores highlight limited operational efficiency and potential vulnerability if economic conditions worsen. Investors should watch closely for improvements in profitability and balance sheet discipline.
How are the two companies positioned?
This section dissects the operational DNA of GM and Ford by comparing their revenue distribution by segment alongside internal strengths and weaknesses. The goal is to confront their economic moats and identify which business model offers the most resilient, sustainable competitive advantage in today’s market.
Revenue Segmentation: The Strategic Mix
This comparison dissects how General Motors and Ford diversify their income streams and reveals each firm’s core sector bets:
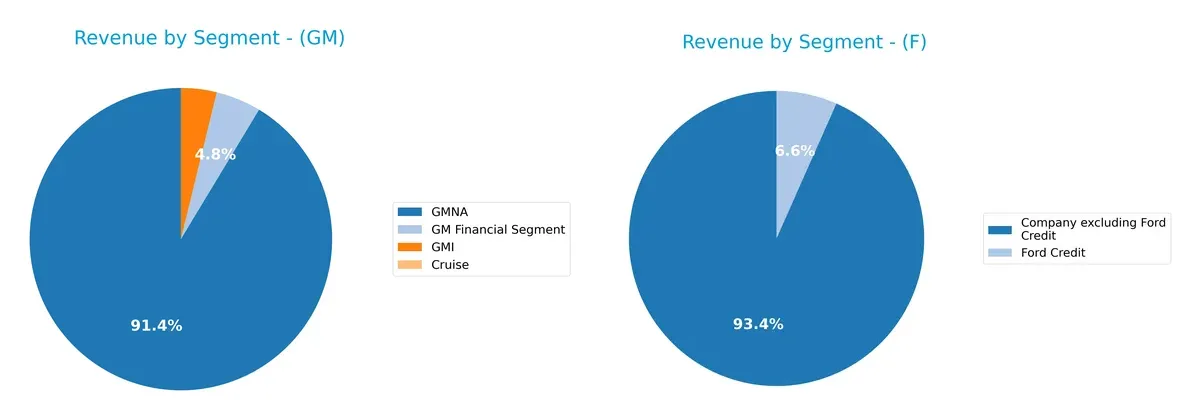
General Motors leans heavily on its GMNA segment, generating $322B in 2025, dwarfing its other segments like GM Financial at $17B and GMI at $13.4B. Ford shows a simpler split, with $173B from “Company excluding Ford Credit” and $12.3B from Ford Credit. GM’s reliance on GMNA signals infrastructure dominance but also concentration risk. Ford’s more balanced approach between automotive and finance segments suggests moderate diversification.
Strengths and Weaknesses Comparison
This table compares the strengths and weaknesses of General Motors Company and Ford Motor Company based on key financial and market criteria:
GM Strengths
- Diversified revenue across financial, manufacturing, and autonomous segments
- Strong US market presence with $138B revenue
- Favorable quick ratio and interest coverage
F Strengths
- Favorable P/E and P/B ratios reflect market valuation
- Higher net margin and ROE indicate better profitability
- Diverse geographic presence including Europe and Asia
GM Weaknesses
- Low profitability metrics: net margin 1.46%, ROE 4.41%, ROIC 1.16% below WACC
- High debt-to-equity ratio at 2.13
- Slightly unfavorable overall financial ratios
F Weaknesses
- High debt-to-equity at 3.59 and debt-to-assets 56.4% suggest leverage risk
- Net margin at 3.18% still low for sector standards
- Lower fixed asset turnover compared to peers
General Motors shows a strong US market focus and solid liquidity but struggles with profitability and leverage. Ford exhibits better profitability metrics and valuation but carries higher financial risk due to leverage. Both companies face challenges balancing growth and capital structure in a volatile automotive market.
The Moat Duel: Analyzing Competitive Defensibility
A structural moat protects long-term profits from relentless competitive erosion. Without it, earnings become vulnerable and unsustainable:
General Motors Company: Legacy Scale with Declining ROIC
GM’s primary moat stems from its massive scale and brand portfolio. However, its ROIC trails WACC by 4.65%, signaling value destruction. The 67.5% ROIC decline warns of weakening financial defensibility. Expansion into autonomous vehicles may stabilize margins but faces intense competition in 2026.
Ford Motor Company: Improving Profitability Amid Value Drain
Ford’s moat hinges on operational improvements and product refresh cycles. Unlike GM, Ford shows a rising ROIC trend (+191%) despite still shedding value versus WACC by 3.65%. EBIT and net margin growth indicate firmer financial footing. Ford’s electric and commercial vehicle push could deepen its competitive edge this year.
Scale Power vs. Operational Momentum: Who Holds the Deeper Moat?
GM’s entrenched scale is offset by deteriorating capital efficiency, while Ford’s improving ROIC trajectory signals a more resilient moat. I see Ford as better positioned to defend and grow market share amidst evolving industry pressures.
Which stock offers better returns?
The past year shows stark differences in price movements and trading dynamics between General Motors Company and Ford Motor Company, reflecting varied investor sentiment and market momentum.
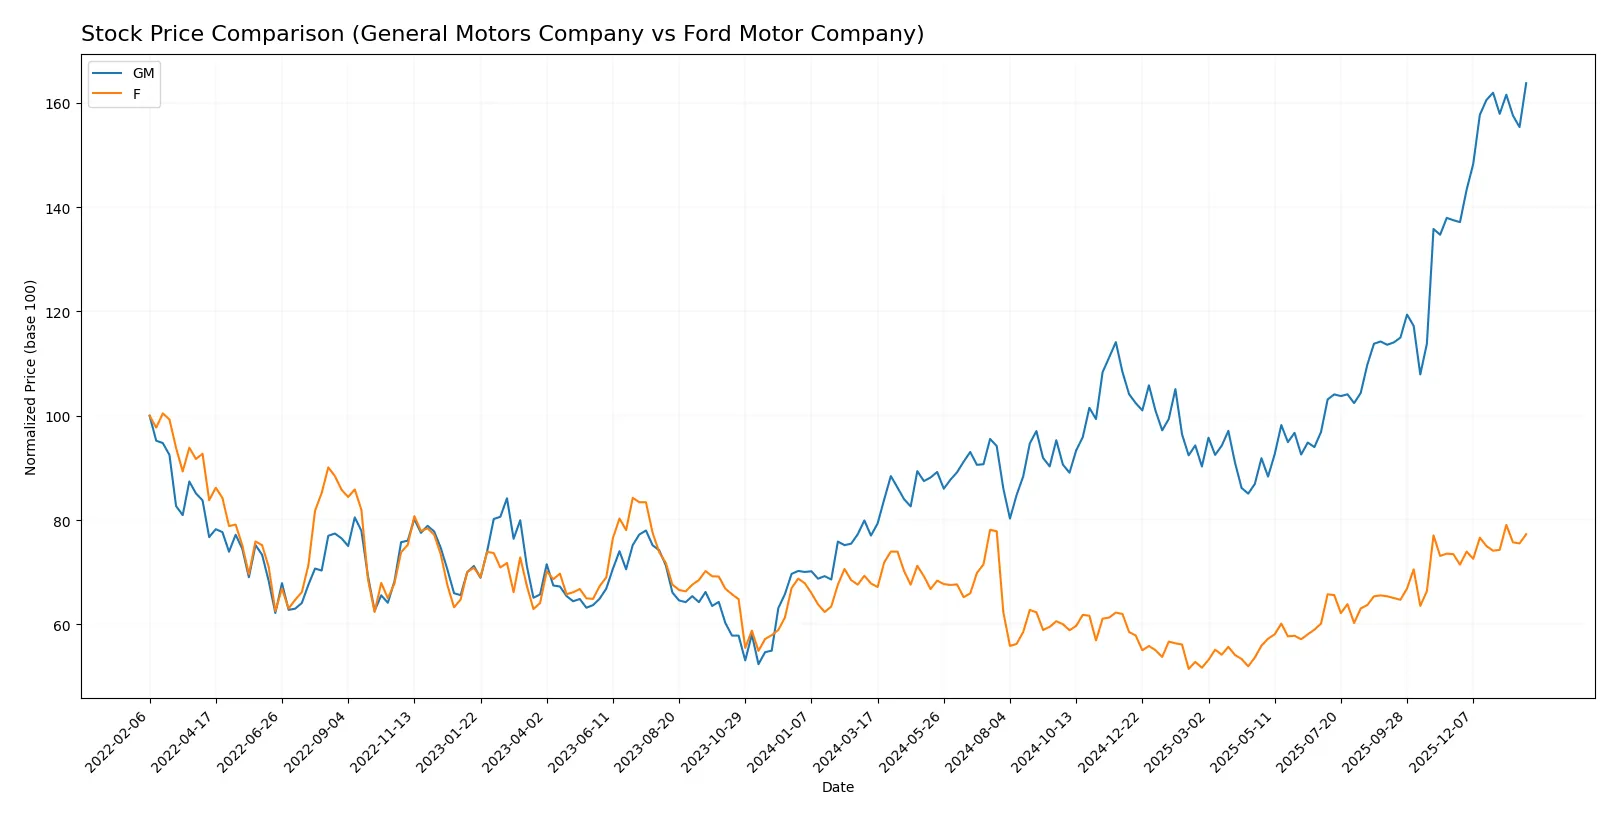
Trend Comparison
General Motors Company’s stock surged 113% over 12 months, marking a bullish trend with accelerating gains and notable volatility (11.04 std deviation). It hit a high of 84.0 and a low of 39.5.
Ford Motor Company’s stock rose 14% over the same period, also bullish but with lower acceleration and volatility (1.32 std deviation). The price ranged between 9.24 and 14.2.
GM’s strong acceleration and higher price appreciation outpaced Ford’s moderate gains, delivering superior market performance over the past year.
Target Prices
Analysts present a mixed but generally optimistic target consensus for General Motors and Ford.
| Company | Target Low | Target High | Consensus |
|---|---|---|---|
| General Motors Company | 55 | 110 | 89.93 |
| Ford Motor Company | 11 | 16 | 12.91 |
The consensus target price for GM at $89.93 stands slightly above its current price of $84, signaling moderate upside potential. Ford’s target consensus of $12.91 is below its current price of $13.88, indicating possible downside risk or market caution.

Don’t Let Luck Decide Your Entry Point
Optimize your entry points with our advanced ProRealTime indicators. You’ll get efficient buy signals with precise price targets for maximum performance. Start outperforming now!
How do institutions grade them?
General Motors Company Grades
Here are the latest grades issued by established financial institutions for General Motors Company:
| Grading Company | Action | New Grade | Date |
|---|---|---|---|
| RBC Capital | Maintain | Outperform | 2026-01-28 |
| Mizuho | Maintain | Outperform | 2026-01-28 |
| Wells Fargo | Maintain | Underweight | 2026-01-28 |
| Barclays | Maintain | Overweight | 2026-01-28 |
| UBS | Maintain | Buy | 2026-01-28 |
| Deutsche Bank | Maintain | Hold | 2026-01-28 |
| Piper Sandler | Maintain | Overweight | 2026-01-28 |
| Barclays | Maintain | Overweight | 2026-01-23 |
| JP Morgan | Maintain | Overweight | 2026-01-21 |
| HSBC | Maintain | Hold | 2026-01-13 |
Ford Motor Company Grades
These are the recent grades from credible grading firms for Ford Motor Company:
| Grading Company | Action | New Grade | Date |
|---|---|---|---|
| Barclays | Maintain | Equal Weight | 2026-01-23 |
| JP Morgan | Maintain | Overweight | 2026-01-21 |
| UBS | Maintain | Neutral | 2026-01-14 |
| HSBC | Maintain | Hold | 2026-01-13 |
| TD Cowen | Maintain | Hold | 2026-01-13 |
| Piper Sandler | Upgrade | Overweight | 2026-01-08 |
| Evercore ISI Group | Maintain | In Line | 2025-12-22 |
| Morgan Stanley | Maintain | Equal Weight | 2025-12-08 |
| Evercore ISI Group | Maintain | In Line | 2025-11-24 |
| Barclays | Maintain | Equal Weight | 2025-10-27 |
Which company has the best grades?
General Motors holds stronger grades overall, with multiple Outperform and Overweight ratings versus Ford’s predominately Equal Weight and Hold grades. This difference may influence investor confidence and portfolio positioning.
Risks specific to each company
The following categories identify critical pressure points and systemic threats facing General Motors Company and Ford Motor Company in the challenging 2026 market environment:
1. Market & Competition
General Motors Company
- Operating globally with diverse brands but faces margin pressure from intense competition.
Ford Motor Company
- Competes aggressively with a strong focus on trucks and electric vehicles, but market volatility impacts sales.
2. Capital Structure & Debt
General Motors Company
- Debt-to-equity ratio of 2.13 signals high leverage, raising financial risk concerns.
Ford Motor Company
- Even higher leverage with debt-to-equity at 3.59, exposing greater financial vulnerability.
3. Stock Volatility
General Motors Company
- Beta at 1.32 suggests moderate market sensitivity, slightly less volatile than Ford.
Ford Motor Company
- Beta of 1.63 indicates higher stock price swings, increasing investor risk.
4. Regulatory & Legal
General Motors Company
- Subject to global regulatory pressures on emissions and safety, impacting costs.
Ford Motor Company
- Similar regulatory environment with added scrutiny on financing and leasing operations.
5. Supply Chain & Operations
General Motors Company
- Global supply chain risks from geopolitical tensions and component shortages remain.
Ford Motor Company
- Faces similar supply chain disruptions but benefits from operational flexibility in key segments.
6. ESG & Climate Transition
General Motors Company
- Invests in autonomous and electric tech but must accelerate ESG commitments.
Ford Motor Company
- Strong focus on electric vehicles and sustainability, though transition costs pressure margins.
7. Geopolitical Exposure
General Motors Company
- Significant exposure to China and emerging markets creates geopolitical risk.
Ford Motor Company
- Also exposed globally but with a stronger North American focus, slightly reducing risk.
Which company shows a better risk-adjusted profile?
Ford’s most significant risk is its high leverage, which amplifies financial risk amid economic uncertainties. General Motors struggles primarily with profitability and operational pressures. Ford’s slightly favorable financial ratios and higher P/E valuation suggest better market confidence. However, both firms remain in distress zones by Altman Z-Score, signaling elevated bankruptcy risk. Ford’s stronger return on equity and asset turnover hint at a marginally better risk-adjusted profile, but elevated debt levels warrant caution. General Motors’ weaker profitability metrics and moderate stock volatility raise red flags despite a more balanced debt-to-assets ratio.
Final Verdict: Which stock to choose?
General Motors Company’s superpower lies in its strong brand recognition and operational scale that fuels modest cash flow generation. However, its declining profitability and value destruction signal a point of vigilance. GM suits investors with an appetite for aggressive growth willing to navigate volatility.
Ford Motor Company benefits from a strategic moat built on improving profitability and a more attractive valuation profile. Its recurring cash flow and stronger income growth offer better stability compared to GM. Ford fits portfolios oriented toward GARP—growth at a reasonable price.
If you prioritize turnaround potential and are comfortable with operational risks, GM’s scale and recent bullish momentum might appeal. However, if you seek a more stable growth trajectory with improving fundamentals, Ford outshines GM by offering better income growth and valuation metrics. Both carry notable risks, so aligning with your risk tolerance is essential.
Disclaimer: Investment carries a risk of loss of initial capital. The past performance is not a reliable indicator of future results. Be sure to understand risks before making an investment decision.
Go Further
I encourage you to read the complete analyses of General Motors Company and Ford Motor Company to enhance your investment decisions: