Home > Comparison > Technology > FISV vs WIT
The strategic rivalry between Fiserv, Inc. and Wipro Limited shapes the evolution of the global technology services sector. Fiserv operates as a capital-intensive fintech innovator focused on payment processing and financial technology. Wipro, in contrast, is a vast IT services and consulting powerhouse with broad industry exposure. This analysis examines their contrasting growth models to identify which offers superior risk-adjusted returns for a diversified portfolio in today’s dynamic tech landscape.

Table of contents
Companies Overview
Fiserv and Wipro stand as influential players in the global information technology services sector.
Fiserv, Inc.: Global Fintech Powerhouse
Fiserv dominates as a payment and financial services technology provider. It generates revenue through merchant acquiring, digital commerce, and cloud-based point-of-sale solutions. In 2026, it strategically focuses on enhancing omnichannel commerce platforms and expanding security and fraud protection services, reinforcing its foothold in fintech innovation.
Wipro Limited: IT Consulting and Services Giant
Wipro commands a broad IT and consulting services portfolio, delivering digital strategy, cloud, and business process services worldwide. Its revenue stems from IT services, IT products, and government enterprise solutions. In 2026, Wipro emphasizes digital transformation and cloud infrastructure to serve diverse industries, including healthcare, financial services, and government sectors.
Strategic Collision: Similarities & Divergences
Fiserv and Wipro diverge in focus: Fiserv prioritizes financial technology ecosystems, while Wipro emphasizes broad IT consulting and cloud services. They compete primarily in digital transformation and cloud adoption but target different client bases—Fiserv in financial services, Wipro across industries including government. Their investment profiles differ with Fiserv driven by fintech innovation and Wipro by scale and diversified IT expertise.
Income Statement Comparison
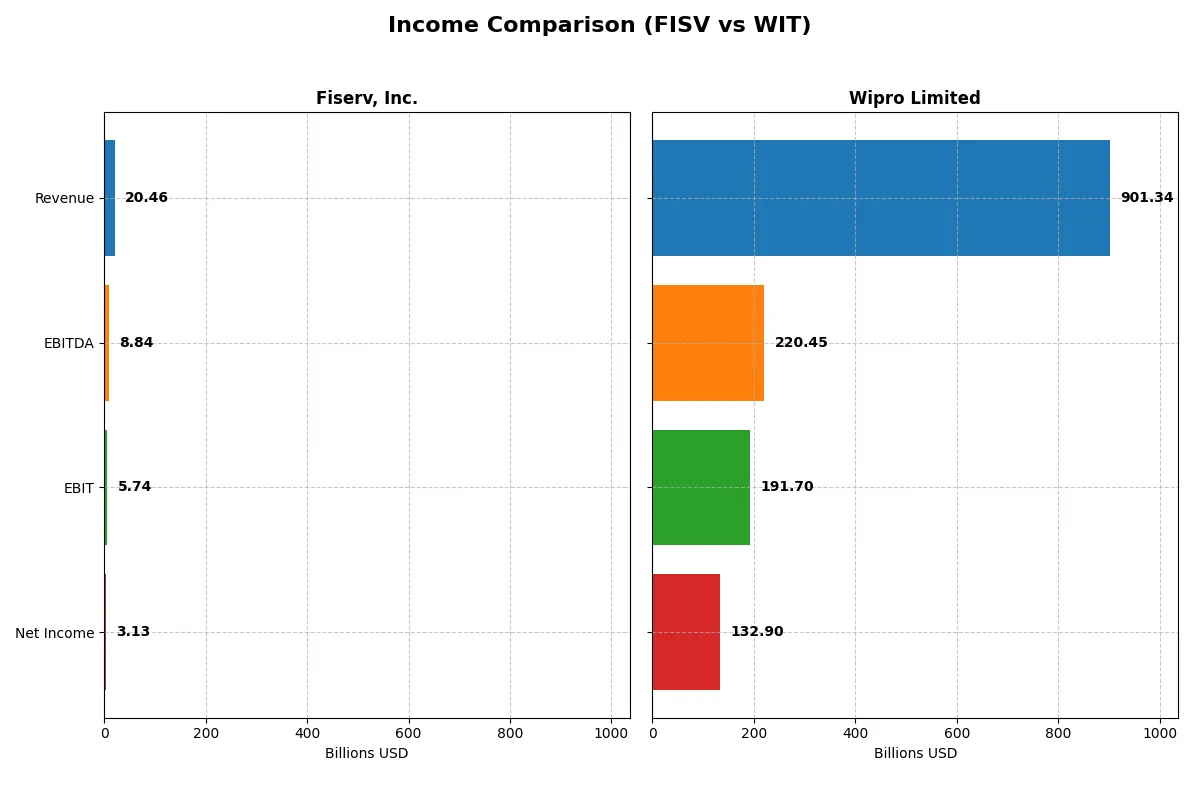
This data dissects the core profitability and scalability of both corporate engines to reveal who dominates the bottom line:
| Metric | Fiserv, Inc. (FISV) | Wipro Limited (WIT) |
|---|---|---|
| Revenue | 20.46B USD | 901.34B INR |
| Cost of Revenue | 8.01B USD | 625.05B INR |
| Operating Expenses | 6.56B USD | 122.72B INR |
| Gross Profit | 12.44B USD | 276.29B INR |
| EBITDA | 8.84B USD | 220.45B INR |
| EBIT | 5.74B USD | 191.70B INR |
| Interest Expense | 1.24B USD | 14.94B INR |
| Net Income | 3.13B USD | 132.90B INR |
| EPS | 5.41 USD | 12.56 INR |
| Fiscal Year | 2024 | 2025 |
Income Statement Analysis: The Bottom-Line Duel
The upcoming income statement comparison reveals each company’s operational efficiency and profitability trajectory, key to understanding their corporate engines.
Fiserv, Inc. Analysis
Fiserv’s revenue climbed steadily from $14.9B in 2020 to $20.5B in 2024, with net income surging from $958M to $3.13B. Its gross margin remains robust at 60.8%, while net margin holds favorably at 15.3%. In 2024, Fiserv accelerated EBIT growth by 17%, signaling improved operational momentum and cost control.
Wipro Limited Analysis
Wipro’s revenue showed a modest dip of 0.24% to 901B INR in 2025, yet net income grew strongly by 19.8% to 133B INR. Gross margin stays healthy at 30.6%, with a solid net margin of 14.7%. The company’s EBIT expanded 19% year-over-year, reflecting enhanced efficiency despite flat top-line growth.
Margin Strength vs. Growth Momentum
Fiserv leads with superior margins and solid revenue expansion, posting a 37.7% revenue increase over five years and a 226.8% net income rise. Wipro, meanwhile, exhibits higher net income growth momentum recently but struggles with stagnant revenue. For investors, Fiserv’s profile offers sustained margin power and consistent growth, while Wipro’s appeal lies in accelerating profitability amid mixed top-line trends.
Financial Ratios Comparison
These vital ratios act as a diagnostic tool to expose the underlying fiscal health, valuation premiums, and capital efficiency of the companies compared below:
| Ratios | Fiserv, Inc. (FISV) | Wipro Limited (WIT) |
|---|---|---|
| ROE | 11.6% | 16.0% |
| ROIC | 8.7% | 10.5% |
| P/E | 38.0 | 20.6 |
| P/B | 4.39 | 3.30 |
| Current Ratio | 1.06 | 2.72 |
| Quick Ratio | 1.06 | 2.71 |
| D/E | 0.92 | 0.23 |
| Debt-to-Assets | 32.3% | 14.9% |
| Interest Coverage | 4.75 | 10.28 |
| Asset Turnover | 0.27 | 0.70 |
| Fixed Asset Turnover | 8.62 | 8.48 |
| Payout ratio | 0% | 47.2% |
| Dividend yield | 0% | 2.29% |
| Fiscal Year | 2024 | 2025 |
Efficiency & Valuation Duel: The Vital Signs
Financial ratios serve as a company’s DNA, uncovering hidden risks and revealing operational strengths critical for investment decisions.
Fiserv, Inc.
Fiserv posts a moderate ROE of 11.6% and a net margin of 15.3%, signaling decent profitability. However, its P/E at 38x suggests the stock is expensive relative to earnings, while a P/S multiple near 7x confirms valuation stretch. The absence of dividends highlights reliance on reinvestment, though capital allocation remains cautious with a neutral ROIC versus WACC spread.
Wipro Limited
Wipro shines with a robust 16% ROE and a 14.7% net margin, demonstrating operational efficiency. Its P/E ratio of 20.6x is more reasonable, reflecting fair valuation. The company supports shareholders with a 2.3% dividend yield, combining steady returns with reinvestment in growth and R&D. Wipro’s low leverage and strong interest coverage underpin financial stability.
Premium Valuation vs. Operational Safety
Wipro offers a better blend of profitability, valuation, and shareholder returns, with 79% favorable ratios versus Fiserv’s more balanced but pricier profile. Investors favoring operational safety and income may prefer Wipro, while those betting on growth might tolerate Fiserv’s stretched multiples and reinvestment focus.
Which one offers the Superior Shareholder Reward?
I observe that Fiserv, Inc. (FISV) pays no dividends but aggressively reinvests free cash flow, maintaining payout ratio at 0%. Its free cash flow per share hits $8.7 with a price-to-free-cash-flow ratio near 23.5, signaling growth focus. FISV’s buybacks are implied but not quantified here, suggesting reinvestment into operations. In contrast, Wipro Limited (WIT) pays a consistent dividend yield around 2.3% with a moderate payout ratio of 47%. It combines dividends with steady buybacks, reflected in free cash flow per share of $14.8 and a lower price-to-free-cash-flow ratio near 17.7, indicating a more balanced shareholder return. WIT’s strong operating cash flow coverage and lower leverage enhance dividend sustainability. For 2026, I favor Wipro’s dual distribution approach, offering a superior total shareholder return profile through reliable dividends and buybacks, while Fiserv’s zero yield and reinvestment strategy carry higher growth risk but less immediate income.
Comparative Score Analysis: The Strategic Profile
The radar chart reveals the fundamental DNA and trade-offs of Fiserv, Inc. and Wipro Limited, exposing their competitive strengths and vulnerabilities:
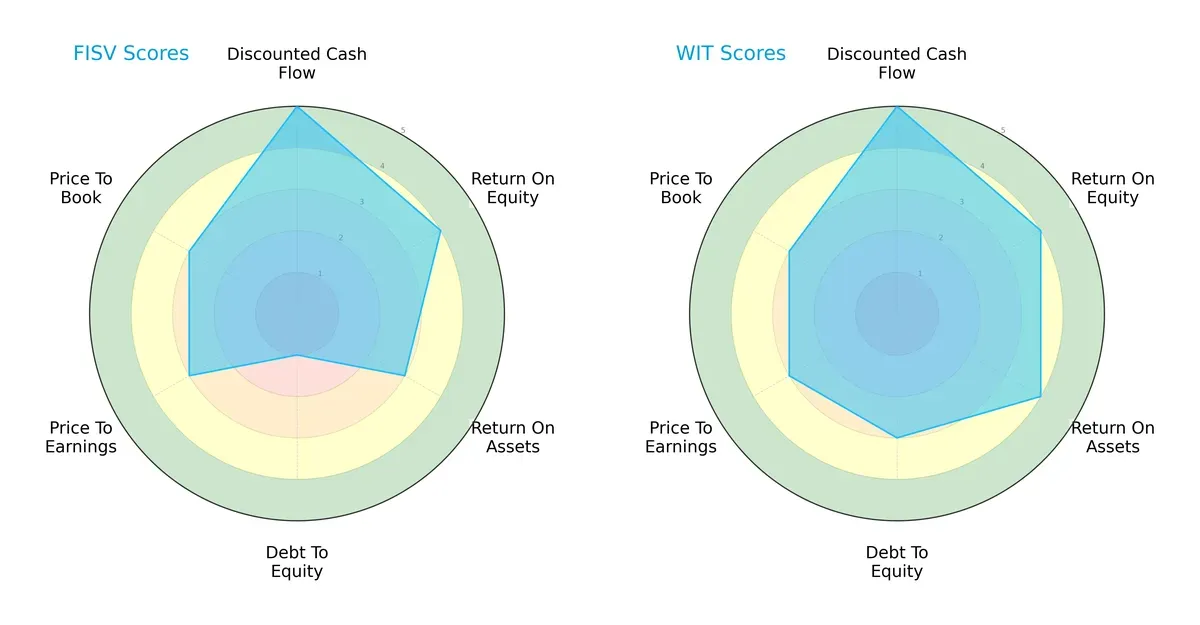
Wipro presents a more balanced profile, excelling in ROA (4 vs. 3) and debt management (3 vs. 1), signaling better asset utilization and financial stability. Fiserv matches Wipro on DCF and ROE but suffers from a weak debt-to-equity score, increasing financial risk. Both companies show moderate valuations (PE/PB scores of 3), but Wipro’s diversified edge in operational efficiency and leverage management stands out.
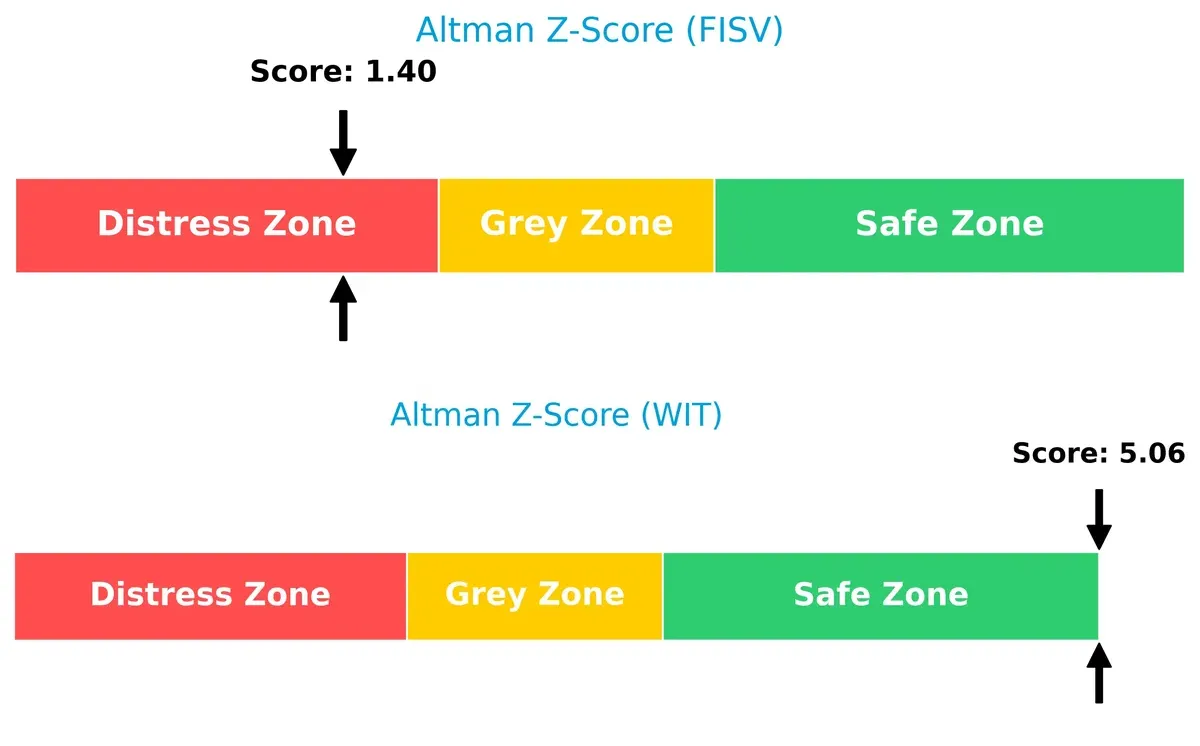
Bankruptcy Risk: Solvency Showdown
Wipro’s Altman Z-Score of 5.06 places it firmly in the safe zone, indicating strong long-term solvency. In contrast, Fiserv’s 1.40 score flags distress risk, signaling potential bankruptcy concerns in this cycle:
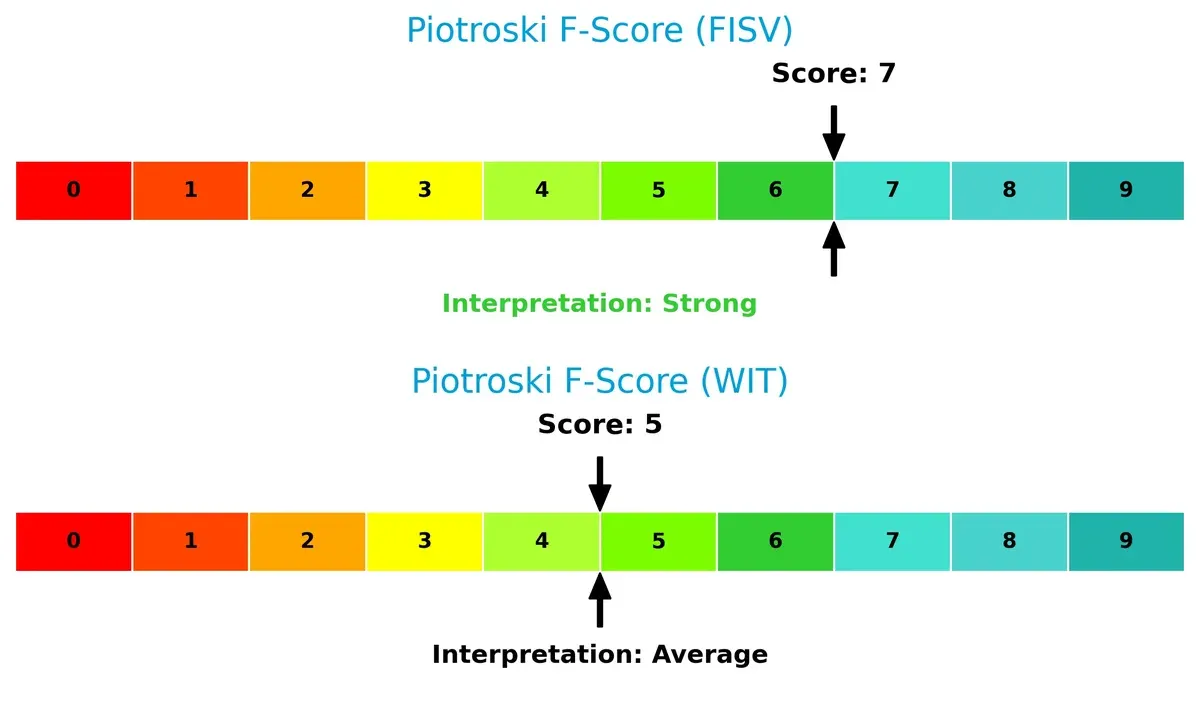
Financial Health: Quality of Operations
Fiserv’s Piotroski F-Score of 7 indicates strong internal financial health and operational quality. Wipro’s score of 5 is average, suggesting some caution on internal metrics relative to Fiserv:
How are the two companies positioned?
This section dissects FISV and WIT’s operational DNA by comparing their revenue distribution and internal dynamics. The goal is to confront their economic moats to identify which model offers the most resilient, sustainable competitive advantage today.
Revenue Segmentation: The Strategic Mix
This visual comparison dissects how both firms diversify their income streams and where their primary sector bets lie:
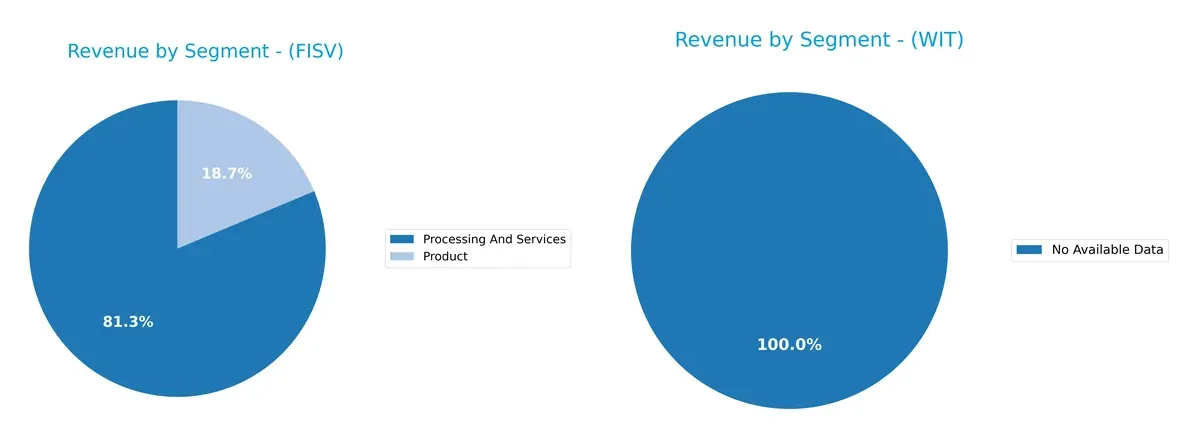
Fiserv, Inc. anchors revenue in “Processing And Services” with $16.6B, dwarfing its $3.8B “Product” segment. Wipro Limited shows no available data, so I cannot assess its revenue mix. Fiserv’s heavy reliance on processing signals strong infrastructure dominance but raises concentration risk if fintech innovations disrupt this segment. Its smaller product line offers limited diversification, making ecosystem lock-in critical for sustaining growth.
Strengths and Weaknesses Comparison
This table compares the Strengths and Weaknesses of Fiserv, Inc. and Wipro Limited:
Fiserv Strengths
- Strong processing and services revenue (16.6B USD in 2024)
- Favorable net margin at 15.31%
- Quick ratio favorable at 1.06
- Fixed asset turnover strong at 8.62
- Neutral debt levels with 32.3% debt-to-assets
Wipro Strengths
- High profitability with net margin 14.74% and ROE 16.04%
- Favorable ROIC at 10.49% above WACC
- Strong liquidity with current ratio 2.72 and quick ratio 2.71
- Low debt ratio at 14.93% debt-to-assets
- Favorable interest coverage at 12.83
- Dividend yield positive at 2.29%
Fiserv Weaknesses
- Unfavorable valuation multiples, P/E 38 and P/B 4.39
- Asset turnover low at 0.27 indicating less efficient asset use
- Dividend yield zero
- Net margin and ROE neutral to favorable but not leading
- Concentrated US revenue with limited geographic diversification
Wipro Weaknesses
- P/B ratio unfavorable at 3.3 indicating possible overvaluation
- Neutral asset turnover at 0.7 lower than sector leaders
- Limited revenue detail on geographic or segment diversification
- No detailed segment revenue disclosed for 2025
Fiserv demonstrates strong scale in processing services and solid liquidity but faces valuation and asset efficiency challenges. Wipro displays robust profitability, liquidity, and low leverage, though valuation and diversification data are less transparent. These contrasts highlight differing strategic focuses between scale and financial efficiency.
The Moat Duel: Analyzing Competitive Defensibility
A structural moat alone protects long-term profits from relentless competitive erosion. Here’s how Fiserv and Wipro defend their turf:
Fiserv, Inc.: Durable Network Effects and Integrated Solutions
Fiserv’s moat stems from network effects and high switching costs embedded in its payments and fintech platforms. Its superior ROIC above WACC and stable 28% EBIT margin confirm efficient capital use. Expansion into omnichannel commerce and cloud point-of-sale deepens this moat in 2026.
Wipro Limited: Cost Advantage in IT Services with Scale
Wipro’s moat relies on scale-driven cost advantages and diversified IT services across industries. Although it sustains ROIC above WACC, declining ROIC signals margin pressure. Growth in digital consulting and cloud could reinvigorate Wipro’s competitive edge if operational efficiencies improve.
Network Effects vs. Scale Economies: The Moat Showdown
Fiserv’s growing ROIC and integrated ecosystem create a wider, more durable moat than Wipro’s scale-based advantage. I see Fiserv better positioned to defend market share through innovation and sticky client relationships. Wipro must reverse profitability trends to maintain its foothold.
Which stock offers better returns?
Over the past year, both Fiserv, Inc. and Wipro Limited experienced declining stock prices, with varied degrees of volatility and acceleration in their trading dynamics.
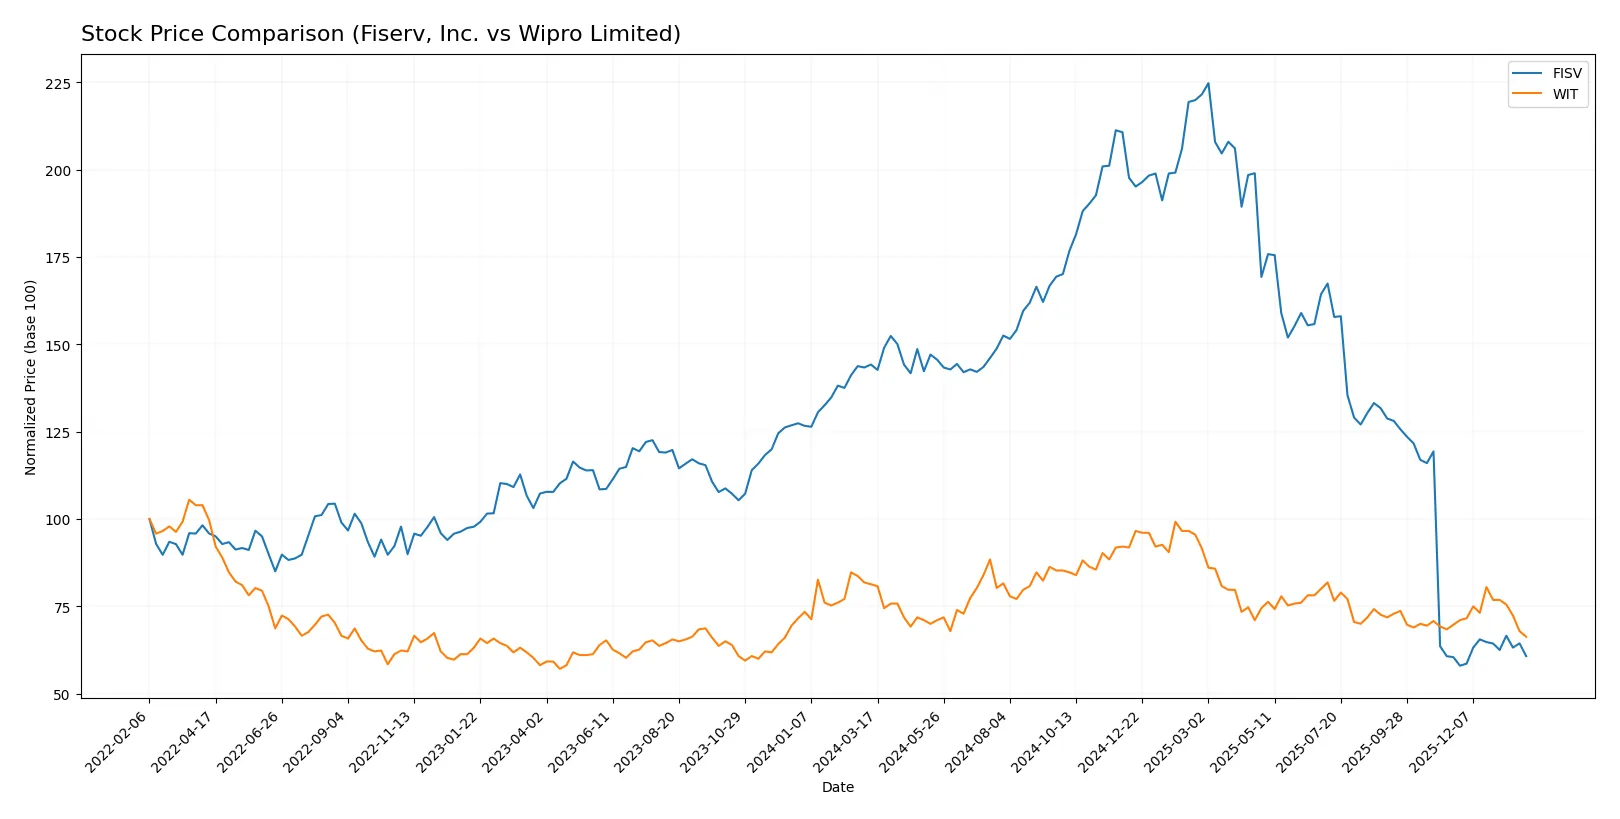
Trend Comparison
Fiserv, Inc. shows a 57.86% price decline over the last 12 months, marking a bearish trend with accelerating downward momentum and high volatility (std dev 46.88). The stock peaked at 235.69 and troughed at 60.84 during this period.
Wipro Limited’s stock fell 18.45% over the past year, also bearish but with decelerating losses and minimal volatility (std dev 0.31). Its price ranged between 3.77 and 2.52, indicating a less dramatic decline.
Comparing both, Wipro Limited outperformed Fiserv, Inc. by delivering a smaller market loss, despite both trending downward over the analyzed year.
Target Prices
Analysts present a broad range for Fiserv, Inc. and a tight range for Wipro Limited, signaling varying growth expectations.
| Company | Target Low | Target High | Consensus |
|---|---|---|---|
| Fiserv, Inc. | 62 | 180 | 105.61 |
| Wipro Limited | 7 | 7.7 | 7.35 |
Fiserv’s target consensus sits significantly above its current price of 63.73, reflecting optimistic growth potential. Wipro’s targets far exceed its 2.52 stock price, indicating strong upside expectations despite recent market levels.

Don’t Let Luck Decide Your Entry Point
Optimize your entry points with our advanced ProRealTime indicators. You’ll get efficient buy signals with precise price targets for maximum performance. Start outperforming now!
How do institutions grade them?
Fiserv, Inc. Grades
The latest institutional grades for Fiserv, Inc. reflect mixed but mostly positive sentiment.
| Grading Company | Action | New Grade | Date |
|---|---|---|---|
| Tigress Financial | Maintain | Buy | 2025-12-31 |
| Mizuho | Maintain | Outperform | 2025-12-22 |
| Argus Research | Downgrade | Hold | 2025-10-30 |
| RBC Capital | Maintain | Outperform | 2025-10-30 |
| Bernstein | Downgrade | Market Perform | 2025-10-30 |
| Seaport Global | Downgrade | Neutral | 2025-10-30 |
| Keybanc | Downgrade | Sector Weight | 2025-10-30 |
| Truist Securities | Downgrade | Hold | 2025-10-30 |
| Keefe, Bruyette & Woods | Maintain | Outperform | 2025-10-30 |
| UBS | Downgrade | Neutral | 2025-10-30 |
Wipro Limited Grades
Institutional grades for Wipro Limited show a trend of cautious upgrades and downgrades.
| Grading Company | Action | New Grade | Date |
|---|---|---|---|
| UBS | Upgrade | Neutral | 2025-01-02 |
| Wedbush | Maintain | Underperform | 2024-01-16 |
| JP Morgan | Maintain | Underweight | 2023-05-24 |
| Bernstein | Downgrade | Underperform | 2023-03-22 |
| Bernstein | Downgrade | Underperform | 2023-03-21 |
| Goldman Sachs | Upgrade | Buy | 2022-09-13 |
| Goldman Sachs | Upgrade | Buy | 2022-09-12 |
| Morgan Stanley | Downgrade | Underweight | 2022-07-14 |
| Morgan Stanley | Downgrade | Underweight | 2022-07-13 |
| Macquarie | Upgrade | Outperform | 2022-06-02 |
Which company has the best grades?
Fiserv, Inc. holds stronger and more recent grades, including multiple “Outperform” and “Buy” ratings. Wipro’s grades trend lower, with many “Underperform” and “Underweight” ratings. This disparity may influence investor confidence and portfolio positioning.
Risks specific to each company
The following categories identify the critical pressure points and systemic threats facing both firms in the 2026 market environment:
1. Market & Competition
Fiserv, Inc.
- Faces fierce fintech competition in payment services; high P/E and PB ratios suggest overvaluation risks.
Wipro Limited
- Competes globally in IT services with diverse offerings; lower valuation metrics and strong ROIC support resilience.
2. Capital Structure & Debt
Fiserv, Inc.
- Debt-to-equity near 0.92 signals higher leverage; interest coverage moderate at 4.64x, indicating vulnerability to rate hikes.
Wipro Limited
- Maintains low leverage with debt-to-equity at 0.23; interest coverage strong at 12.83x, ensuring financial flexibility.
3. Stock Volatility
Fiserv, Inc.
- Beta of 0.80 shows moderate sensitivity to market swings; wide price range reflects past volatility.
Wipro Limited
- Beta of 0.56 indicates lower market sensitivity; narrow trading range suggests stability.
4. Regulatory & Legal
Fiserv, Inc.
- Operates in US with stringent financial regulations; potential risks from compliance and data security enforcement.
Wipro Limited
- Exposure to Indian regulatory environment with evolving IT policies; compliance risk manageable but requires vigilance.
5. Supply Chain & Operations
Fiserv, Inc.
- Relies on cloud and fintech platforms; operational risk from technology integration and service disruptions.
Wipro Limited
- Extensive global delivery model; operational complexity may affect margins but diversified client base mitigates risk.
6. ESG & Climate Transition
Fiserv, Inc.
- Increasing pressure to enhance ESG disclosures; no dividend yield may affect investor sentiment on sustainability.
Wipro Limited
- Strong ESG focus with dividend yield of 2.29%; better positioned for climate transition demands.
7. Geopolitical Exposure
Fiserv, Inc.
- US-centric revenue limits geopolitical risk but sensitive to US-China tech tensions.
Wipro Limited
- Global footprint exposes to geopolitical volatility, especially India-US relations and emerging market instability.
Which company shows a better risk-adjusted profile?
Wipro Limited exhibits a stronger risk-adjusted profile. Its low leverage, superior liquidity, and stable stock volatility contrast with Fiserv’s higher financial risk and market valuation concerns. Wipro’s Altman Z-Score in the safe zone (5.06) versus Fiserv’s distress zone (1.40) underscores this advantage. Fiserv’s high debt ratio and narrow liquidity margin are red flags. A recent trend showing Wipro’s robust interest coverage (12.83x) confirms its superior financial cushioning against economic shocks.
Final Verdict: Which stock to choose?
Fiserv, Inc. wields unmatched operational efficiency, consistently creating value with a growing ROIC above its cost of capital. Its main point of vigilance is the elevated leverage, which might increase financial risk in volatile markets. It fits well within aggressive growth portfolios seeking durable competitive advantages.
Wipro Limited’s strategic moat lies in its diversified service portfolio and strong balance sheet, marked by low debt and robust liquidity. Compared to Fiserv, it offers better financial safety and stability. Wipro appeals to GARP investors who favor steady growth with reasonable risk management.
If you prioritize high operational efficiency and value creation with an appetite for leverage risk, Fiserv is the compelling choice due to its durable yet aggressive growth profile. However, if you seek financial stability combined with consistent returns and lower risk, Wipro offers better safety and steadier performance, commanding a premium for prudent investors.
Disclaimer: Investment carries a risk of loss of initial capital. The past performance is not a reliable indicator of future results. Be sure to understand risks before making an investment decision.
Go Further
I encourage you to read the complete analyses of Fiserv, Inc. and Wipro Limited to enhance your investment decisions: