In the dynamic world of information technology services, Fiserv, Inc. (FISV) and Leidos Holdings, Inc. (LDOS) stand out as influential players with distinct yet overlapping market focuses. Fiserv excels in financial technology and payment solutions, while Leidos specializes in defense, intelligence, and health IT services. Both companies embrace innovation to drive growth, making their comparison essential for investors seeking promising opportunities. Let’s explore which company offers the most compelling investment potential in 2026.
Table of contents
Companies Overview
I will begin the comparison between Fiserv and Leidos Holdings by providing an overview of these two companies and their main differences.
Fiserv Overview
Fiserv, Inc. focuses on delivering payment and financial services technology globally. The company operates through Acceptance, Fintech, and Payments segments, providing solutions like point-of-sale merchant acquiring, digital banking, fraud protection, and card processing services. Headquartered in Milwaukee, Wisconsin, Fiserv serves businesses, financial institutions, and merchants, positioning itself as a comprehensive technology provider in the financial services industry.
Leidos Holdings Overview
Leidos Holdings, Inc. offers services and solutions primarily in defense, intelligence, civil, and health markets. Its three segments—Defense Solutions, Civil, and Health—provide national security systems, IT solutions, and health-related services for government and commercial customers. Based in Reston, Virginia, Leidos specializes in technology and systems integration for critical missions, including cybersecurity, data analytics, and health information management.
Key similarities and differences
Both companies operate in the technology sector but serve distinctly different markets and client bases. Fiserv concentrates on financial technology and payments, while Leidos focuses on defense, civil infrastructure, and health services. They share an emphasis on technology-driven solutions but differ in industry focus, with Fiserv targeting financial institutions and merchants, and Leidos serving government agencies and health organizations. Employee counts also differ, with Leidos employing 47K and Fiserv 38K staff.
Income Statement Comparison
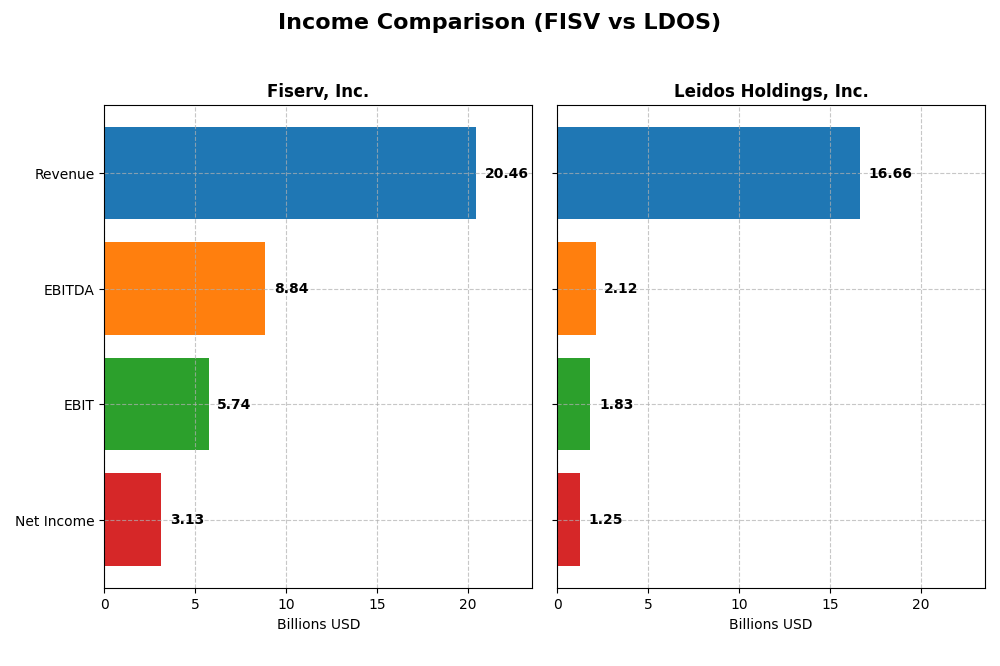
The table below presents a side-by-side comparison of key income statement metrics for Fiserv, Inc. and Leidos Holdings, Inc. for the fiscal year 2024.
| Metric | Fiserv, Inc. (FISV) | Leidos Holdings, Inc. (LDOS) |
|---|---|---|
| Market Cap | 36.7B | 24.4B |
| Revenue | 20.5B | 16.7B |
| EBITDA | 8.8B | 2.1B |
| EBIT | 5.7B | 1.8B |
| Net Income | 3.1B | 1.3B |
| EPS | 5.41 | 9.36 |
| Fiscal Year | 2024 | 2024 |
Income Statement Interpretations
Fiserv, Inc.
Fiserv’s revenue grew steadily from $14.9B in 2020 to $20.5B in 2024, with net income rising substantially from $958M to $3.13B over the same period. Gross and EBIT margins remained strong and favorable, around 61% and 28% respectively, though net margin showed a slight dip in the latest year. The 2024 performance saw slower net margin growth despite solid revenue and EPS increases.
Leidos Holdings, Inc.
Leidos demonstrated consistent revenue growth from $12.3B in 2020 to $16.7B in 2024, with net income surging from $628M to $1.25B. Margins were mixed: gross margin was neutral at 16.8%, but EBIT and net margins were favorable, improving notably in 2024. The latest year featured exceptional EBIT and net margin growth, supported by strong operational expense control and EPS gains.
Which one has the stronger fundamentals?
Both companies show favorable income statement fundamentals with sustained revenue and net income growth. Fiserv exhibits higher margins and stronger overall profitability, while Leidos posts impressive recent margin expansion and net margin growth. Fiserv’s larger scale and margin stability contrast with Leidos’s rapid margin improvements, making fundamental strength contingent on investor preference for scale versus growth dynamics.
Financial Ratios Comparison
The table below compares key financial ratios for Fiserv, Inc. (FISV) and Leidos Holdings, Inc. (LDOS) based on their most recent fiscal year data for 2024.
| Ratios | Fiserv, Inc. (FISV) | Leidos Holdings, Inc. (LDOS) |
|---|---|---|
| ROE | 11.57% | 28.42% |
| ROIC | 8.70% | 13.85% |
| P/E | 37.97 | 15.72 |
| P/B | 4.39 | 4.47 |
| Current Ratio | 1.06 | 1.21 |
| Quick Ratio | 1.06 | 1.13 |
| D/E | 0.92 | 1.20 |
| Debt-to-Assets | 32.34% | 40.38% |
| Interest Coverage | 4.75 | 9.47 |
| Asset Turnover | 0.27 | 1.27 |
| Fixed Asset Turnover | 8.62 | 10.74 |
| Payout ratio | 0 | 16.59% |
| Dividend yield | 0% | 1.05% |
Interpretation of the Ratios
Fiserv, Inc.
Fiserv shows a balanced profile with favorable net margin (15.31%) and WACC (6.11%), but unfavorable PE (37.97) and PB (4.39) ratios, indicating a potentially high valuation. Asset turnover is weak at 0.27, while fixed asset turnover is favorable at 8.62. The company does not pay dividends, reflecting a reinvestment focus or growth strategy.
Leidos Holdings, Inc.
Leidos presents stronger profitability ratios with a favorable ROE of 28.42% and ROIC of 13.85%, and a solid interest coverage ratio of 9.49. The PE ratio is neutral at 15.72, but the debt-to-equity ratio is unfavorable at 1.2. The company pays dividends with a 1.05% yield, suggesting some shareholder returns alongside growth investment.
Which one has the best ratios?
Leidos holds an edge with 50% favorable ratios including strong returns and coverage, and a moderate valuation. Fiserv has a mixed profile with equal favorable and unfavorable ratios and higher valuation multiples. Overall, Leidos’ ratios suggest a slightly more favorable financial standing in this comparison.
Strategic Positioning
This section compares the strategic positioning of Fiserv, Inc. and Leidos Holdings, Inc., including Market position, Key segments, and exposure to disruption:
Fiserv, Inc.
- Large market cap of 36.7B; operates in competitive payment and financial services technology.
- Key segments: Acceptance, Fintech, Payments; drivers include merchant services, digital banking.
- Exposure to technological disruption through fintech innovation, cloud-based platforms, security.
Leidos Holdings, Inc.
- Market cap of 24.4B; focused on defense, civil, health markets with government and commercial clients.
- Key segments: Defense Solutions, Civil, Health; drivers include national security, IT, health solutions.
- Exposure to disruption in cybersecurity, cloud computing, digital transformation across defense and health.
Fiserv vs Leidos Positioning
Fiserv has a diversified strategy across payment and financial tech segments, benefiting from broad client types. Leidos concentrates on defense and government sectors, leveraging specialized security and IT solutions. Fiserv’s breadth contrasts with Leidos’s focused mission-driven approach.
Which has the best competitive advantage?
Both companies demonstrate a very favorable moat with growing ROIC above WACC, reflecting durable competitive advantages. Leidos shows higher ROIC relative to cost of capital but with lower growth rate, indicating strong but more stable profitability compared to Fiserv’s accelerating returns.
Stock Comparison
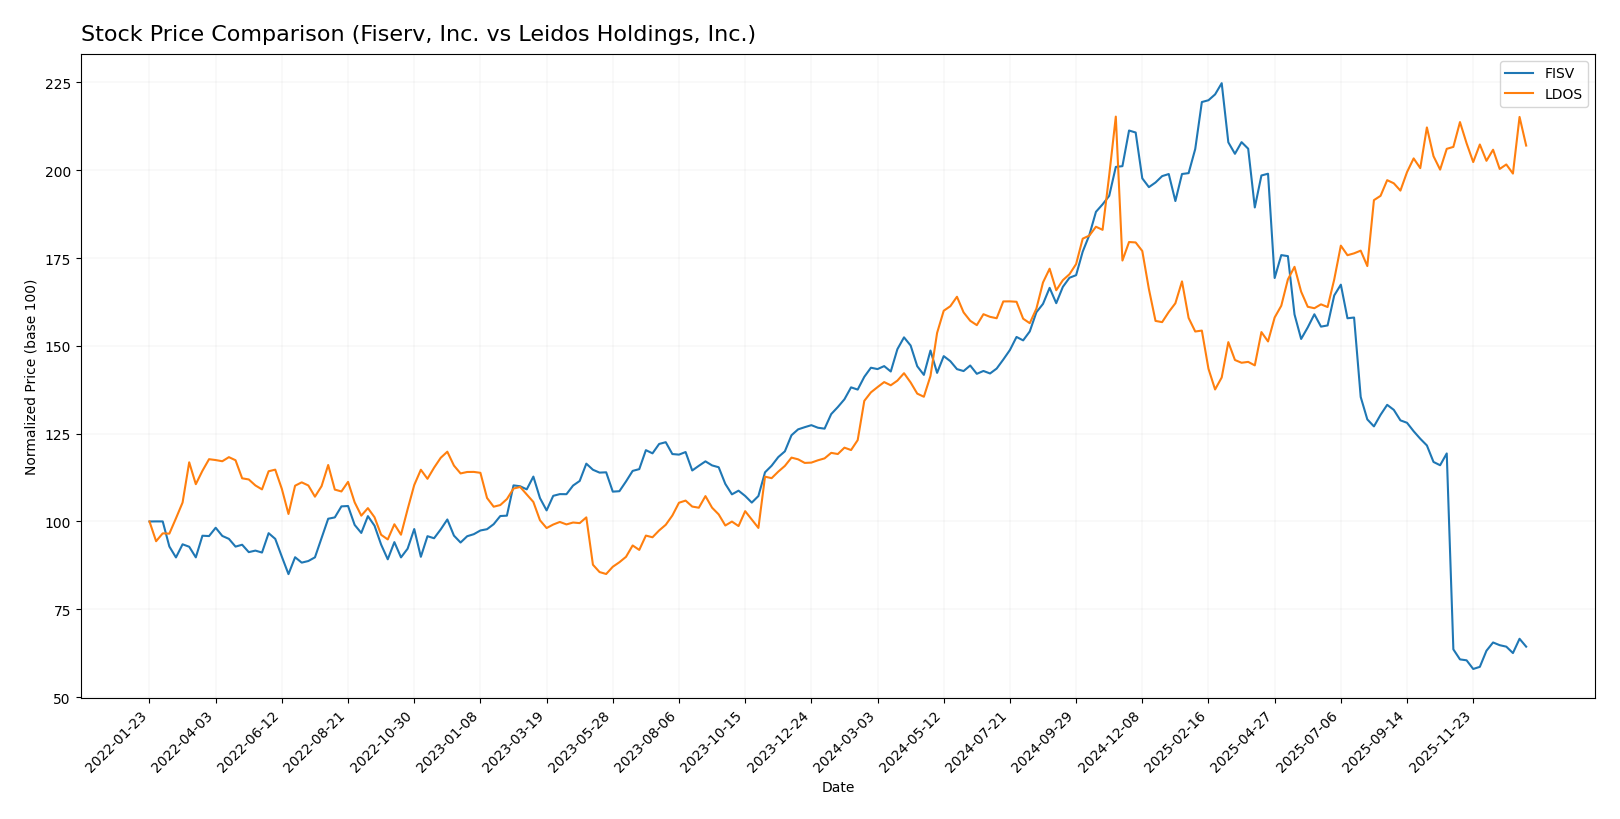
The stock price movements of Fiserv, Inc. and Leidos Holdings, Inc. over the past year reveal contrasting trends, with Fiserv experiencing a significant decline while Leidos shows a strong upward trajectory.
Trend Analysis
Fiserv, Inc. exhibits a bearish trend over the past 12 months with a -55.23% price change, marked by accelerating decline and high volatility, peaking at 235.69 and bottoming at 60.84.
Leidos Holdings, Inc. shows a bullish trend over the same period, gaining 51.37% with decelerating growth and moderate volatility, reaching a high of 198.42 and a low of 124.91.
Comparing both, Leidos delivered the highest market performance with positive growth, contrasting sharply with Fiserv’s significant losses over the last year.
Target Prices
Analysts show a varied but generally optimistic target price consensus for these companies.
| Company | Target High | Target Low | Consensus |
|---|---|---|---|
| Fiserv, Inc. | 180 | 62 | 111.39 |
| Leidos Holdings, Inc. | 230 | 216 | 222.2 |
Fiserv’s target consensus at $111.39 is significantly above its current price of $67.5, suggesting potential upside. Leidos’ consensus target of $222.2 also exceeds its current price of $190.82, indicating moderate expected growth.
Analyst Opinions Comparison
This section compares analysts’ ratings and financial grades for Fiserv, Inc. and Leidos Holdings, Inc.:
Rating Comparison
Fiserv, Inc. Rating
- Rating: B+, considered very favorable by analysts.
- Discounted Cash Flow Score: 5, indicating a very favorable valuation based on future cash flows.
- ROE Score: 4, rated favorable for efficient profit generation from shareholders’ equity.
- ROA Score: 3, moderate rating for asset utilization effectiveness.
- Debt To Equity Score: 1, very unfavorable, signifying high financial risk due to debt.
- Overall Score: 3, moderate overall financial standing.
Leidos Holdings, Inc. Rating
- Rating: B+, also rated very favorable by analysts.
- Discounted Cash Flow Score: 4, showing a favorable valuation outlook.
- ROE Score: 5, very favorable, indicating superior profit efficiency.
- ROA Score: 4, favorable rating for effective asset use.
- Debt To Equity Score: 1, also very unfavorable due to similar debt concerns.
- Overall Score: 3, moderate overall financial standing as well.
Which one is the best rated?
Both Fiserv and Leidos hold the same overall rating of B+ and an identical moderate overall score of 3. Leidos scores higher on ROE and ROA, while Fiserv leads on discounted cash flow, but both share very unfavorable debt-to-equity scores.
Scores Comparison
Here is a comparison of the Altman Z-Score and Piotroski Score for Fiserv, Inc. and Leidos Holdings, Inc.:
FISV Scores
- Altman Z-Score: 1.41, in distress zone indicating high bankruptcy risk.
- Piotroski Score: 7, strong financial health but below very strong range.
LDOS Scores
- Altman Z-Score: 4.15, in safe zone indicating low bankruptcy risk.
- Piotroski Score: 8, very strong financial health, close to highest value.
Which company has the best scores?
Leidos Holdings shows a safer financial position with its Altman Z-Score in the safe zone and a very strong Piotroski Score of 8. Fiserv, however, is in financial distress per its Altman score with a slightly lower Piotroski Score of 7.
Grades Comparison
The grades from multiple reputable financial institutions for Fiserv, Inc. and Leidos Holdings, Inc. are as follows:
Fiserv, Inc. Grades
The following table summarizes recent grades assigned to Fiserv, Inc. by well-known grading companies:
| Grading Company | Action | New Grade | Date |
|---|---|---|---|
| Tigress Financial | Maintain | Buy | 2025-12-31 |
| Mizuho | Maintain | Outperform | 2025-12-22 |
| Goldman Sachs | Downgrade | Neutral | 2025-10-30 |
| Bernstein | Downgrade | Market Perform | 2025-10-30 |
| Argus Research | Downgrade | Hold | 2025-10-30 |
| Morgan Stanley | Downgrade | Equal Weight | 2025-10-30 |
| Truist Securities | Downgrade | Hold | 2025-10-30 |
| JP Morgan | Maintain | Overweight | 2025-10-30 |
| Citigroup | Maintain | Neutral | 2025-10-30 |
| RBC Capital | Maintain | Outperform | 2025-10-30 |
The overall trend for Fiserv shows multiple downgrades around October 2025, shifting from mostly Buy/Outperform to more Neutral and Hold ratings, reflecting increased caution.
Leidos Holdings, Inc. Grades
The following table presents recent grades by established grading firms for Leidos Holdings, Inc.:
| Grading Company | Action | New Grade | Date |
|---|---|---|---|
| Citigroup | Maintain | Buy | 2026-01-13 |
| Stifel | Downgrade | Hold | 2026-01-08 |
| B of A Securities | Maintain | Buy | 2025-11-07 |
| Truist Securities | Maintain | Buy | 2025-11-05 |
| UBS | Maintain | Neutral | 2025-11-05 |
| Cantor Fitzgerald | Maintain | Overweight | 2025-10-31 |
| Argus Research | Maintain | Buy | 2025-09-24 |
| B of A Securities | Maintain | Buy | 2025-09-04 |
| RBC Capital | Upgrade | Outperform | 2025-09-04 |
| UBS | Maintain | Neutral | 2025-08-07 |
Leidos Holdings displays a predominantly positive rating trend with multiple Buy and Outperform grades, and only one recent downgrade to Hold.
Which company has the best grades?
Both Fiserv, Inc. and Leidos Holdings, Inc. hold a consensus “Buy” rating; however, Leidos exhibits a more consistent pattern of Buy and Outperform grades with fewer downgrades. This suggests relatively stronger analyst confidence in Leidos, potentially implying lower perceived risk or better growth prospects for investors compared to the more mixed and cautious outlook for Fiserv.
Strengths and Weaknesses
Below is a comparison of key strengths and weaknesses for Fiserv, Inc. (FISV) and Leidos Holdings, Inc. (LDOS) based on the most recent financial and operational data.
| Criterion | Fiserv, Inc. (FISV) | Leidos Holdings, Inc. (LDOS) |
|---|---|---|
| Diversification | Moderate: Focused on financial services with strong processing and payment segments. | High: Diverse segments including National Security, Defense, Civil, and Health. |
| Profitability | Moderate: Net margin of 15.3%, ROIC 8.7%, neutral overall rating. | Strong: Net margin 7.5%, ROIC 13.9%, favorable overall rating. |
| Innovation | Stable innovation with consistent service and product updates, but asset turnover is low. | Strong innovation focus supported by high asset turnover and growing ROIC trend. |
| Global presence | Significant presence in financial services globally, but less diversified geographically. | Extensive global footprint in defense and civil markets with growing revenues. |
| Market Share | Leading in payments and processing sectors but faces stiff competition. | Leading in defense and national security sectors, with increasing market share. |
Key takeaways: Both companies demonstrate durable competitive advantages with growing ROICs. Leidos shows superior profitability and diversification, while Fiserv excels in financial services specialization but faces challenges in asset turnover and valuation metrics. Investors should weigh diversification against sector exposure and growth prospects.
Risk Analysis
Below is a comparative table summarizing key risks for Fiserv, Inc. (FISV) and Leidos Holdings, Inc. (LDOS) based on the latest 2024 data and 2026 context.
| Metric | Fiserv, Inc. (FISV) | Leidos Holdings, Inc. (LDOS) |
|---|---|---|
| Market Risk | Moderate (Beta 0.80) | Lower (Beta 0.59) |
| Debt Level | Moderate (D/E 0.92) | Elevated (D/E 1.20) |
| Regulatory Risk | Moderate (Fintech/Payments regulation) | High (Defense & Gov contracts) |
| Operational Risk | Moderate (Tech platform complexity) | Moderate (Diverse IT services) |
| Environmental Risk | Low (Tech sector, limited direct impact) | Low (Service-based, less exposure) |
| Geopolitical Risk | Low to moderate (Global payments exposure) | High (Defense contracts, global operations) |
Fiserv faces moderate market and regulatory risks with a balanced debt profile but shows financial distress signs via Altman Z-score (1.41). Leidos has stronger financial health (Z-score 4.15) but faces higher geopolitical and regulatory risks due to defense sector exposure and higher leverage. The most impactful risks for investors are Leidos’s geopolitical dependencies and Fiserv’s financial distress potential.
Which Stock to Choose?
Fiserv, Inc. (FISV) shows a favorable income evolution with strong growth in net income and EPS over 2020-2024. Its financial ratios are balanced but with some unfavorable valuation multiples. Profitability is solid, supported by a very favorable economic moat, while debt levels are moderate. The overall rating is very favorable (B+) with a moderate overall score.
Leidos Holdings, Inc. (LDOS) exhibits a favorable income statement with strong recent growth in net margin and EPS. Its financial ratios are slightly more favorable, especially in profitability and asset turnover, though debt-to-equity is higher. The company also benefits from a very favorable economic moat. Its rating is equally very favorable (B+) with a moderate overall score.
Investors focused on growth and durable competitive advantage might find both companies appealing given their strong moats and favorable income trends. Risk-tolerant investors may lean towards LDOS for its higher profitability ratios, while those seeking stability could interpret FISV’s balanced financial profile as preferable.
Disclaimer: Investment carries a risk of loss of initial capital. The past performance is not a reliable indicator of future results. Be sure to understand risks before making an investment decision.
Go Further
I encourage you to read the complete analyses of Fiserv, Inc. and Leidos Holdings, Inc. to enhance your investment decisions: