Home > Comparison > Technology > IBM vs FISV
The strategic rivalry between International Business Machines Corporation and Fiserv, Inc. shapes the Technology sector’s future. IBM operates as a diversified technology giant, blending software, consulting, infrastructure, and financing. Fiserv specializes in payment and financial services technology, focusing on fintech innovation and digital commerce. This analysis contrasts IBM’s broad enterprise model with Fiserv’s niche fintech approach to identify which offers superior risk-adjusted returns for diversified portfolios.

Table of contents
Companies Overview
International Business Machines Corporation and Fiserv, Inc. stand as pivotal players in the Information Technology Services sector.
International Business Machines Corporation: Pioneering Hybrid Cloud & AI Solutions
IBM dominates the enterprise IT services landscape. Its core revenue derives from four segments: Software, Consulting, Infrastructure, and Financing. In 2026, IBM strategically focuses on hybrid cloud platforms, open-source solutions like Red Hat, and AI-driven software, emphasizing business automation and security for mission-critical workloads.
Fiserv, Inc.: Innovating Payment & Financial Services Technology
Fiserv leads in payment processing and fintech solutions. Its revenue engine spans Acceptance, Fintech, and Payments segments, delivering point-of-sale, digital commerce, and card transaction services. In 2026, Fiserv prioritizes cloud-based business management platforms and omnichannel commerce, targeting seamless financial transactions and fraud protection.
Strategic Collision: Similarities & Divergences
IBM and Fiserv both excel in tech-driven financial services but diverge strategically. IBM builds an integrated hybrid cloud and AI ecosystem, while Fiserv emphasizes open fintech platforms and payment innovation. Their primary battleground lies in digital transaction processing and cloud infrastructure services. IBM’s investment profile signals broad enterprise transformation; Fiserv’s reflects focused fintech disruption.
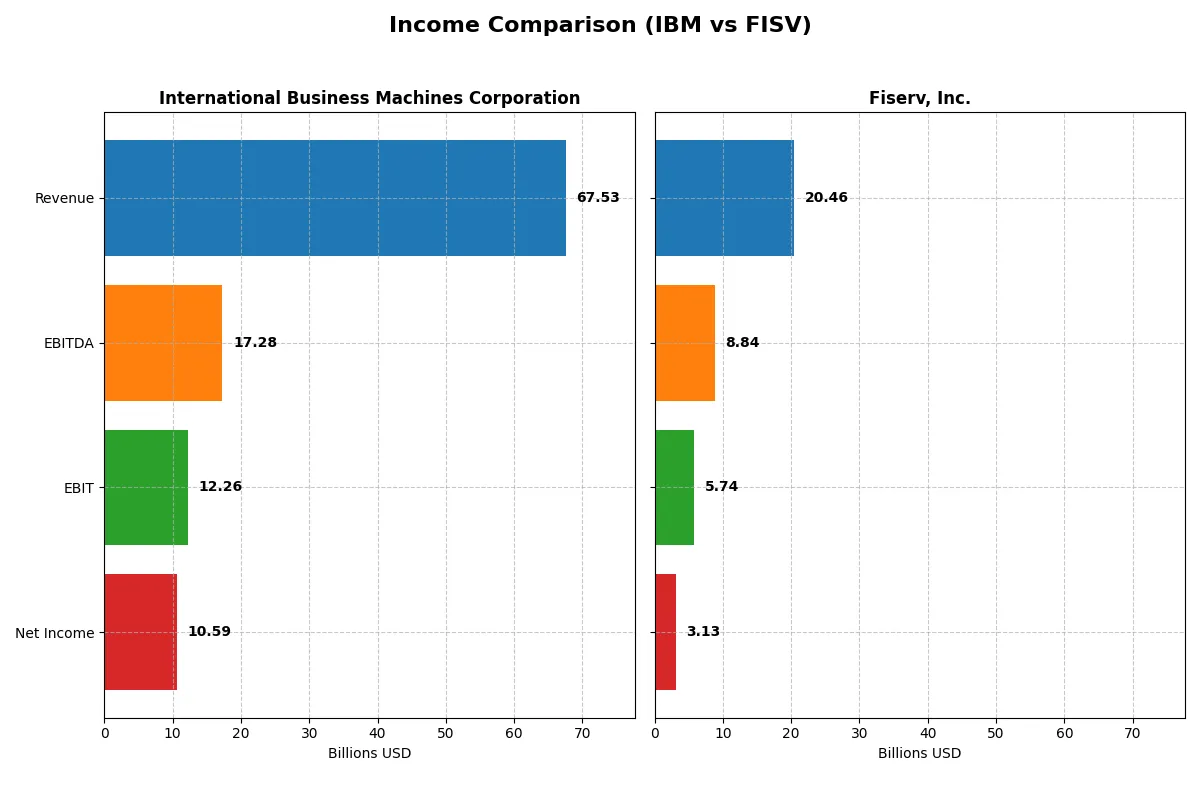
Income Statement Comparison
This data dissects the core profitability and scalability of both corporate engines to reveal who dominates the bottom line:
| Metric | International Business Machines Corporation (IBM) | Fiserv, Inc. (FISV) |
|---|---|---|
| Revenue | 67.5B | 20.5B |
| Cost of Revenue | 27.4B | 8.0B |
| Operating Expenses | 29.9B | 6.6B |
| Gross Profit | 40.2B | 12.4B |
| EBITDA | 17.3B | 8.8B |
| EBIT | 12.3B | 5.7B |
| Interest Expense | 1.9B | 1.2B |
| Net Income | 10.6B | 3.1B |
| EPS | 11.36 | 5.41 |
| Fiscal Year | 2025 | 2024 |
Income Statement Analysis: The Bottom-Line Duel
This comparison reveals how efficiently each company converts revenue into profit, spotlighting operational momentum and margin strength.
International Business Machines Corporation (IBM) Analysis
IBM’s revenue rose steadily from $57.4B in 2021 to $67.5B in 2025, with net income surging from $5.7B to $10.6B. Its gross margin remains robust at 59.5%, supported by a healthy net margin of 15.7%. The 2025 data highlights strong earnings momentum, with net income more than doubling over five years.
Fiserv, Inc. (FISV) Analysis
Fiserv’s revenue climbed from $14.9B in 2020 to $20.5B in 2024, while net income jumped from $958M to $3.1B. The company maintains an impressive gross margin near 60.8% and a net margin of 15.3%. Although net margin slightly contracted last year, Fiserv’s revenue and net income growth indicate solid operational scaling.
Margin Strength vs. Growth Trajectory
IBM demonstrates superior margin expansion and a doubling of net income, reflecting disciplined cost control and efficiency gains. Fiserv excels in faster top-line growth and a more than threefold net income increase, though with a slight dip in recent net margin. For investors, IBM appeals as a margin powerhouse, while Fiserv offers a growth-oriented profile with expanding scale.
Financial Ratios Comparison
These vital ratios act as a diagnostic tool to expose the underlying fiscal health, valuation premiums, and capital efficiency of the companies compared below:
| Ratios | International Business Machines Corporation (IBM) | Fiserv, Inc. (FISV) |
|---|---|---|
| ROE | 22.1% (2024) | 11.6% (2024) |
| ROIC | 9.2% (2024) | 8.7% (2024) |
| P/E | 34.2 (2024) | 38.0 (2024) |
| P/B | 7.54 (2024) | 4.39 (2024) |
| Current Ratio | 1.04 (2024) | 1.06 (2024) |
| Quick Ratio | 1.00 (2024) | 1.06 (2024) |
| D/E | 2.14 (2024) | 0.92 (2024) |
| Debt-to-Assets | 42.6% (2024) | 32.3% (2024) |
| Interest Coverage | 5.88 (2024) | 4.75 (2024) |
| Asset Turnover | 0.46 (2024) | 0.27 (2024) |
| Fixed Asset Turnover | 7.03 (2024) | 8.62 (2024) |
| Payout ratio | 102.1% (2024) | 0% (2024) |
| Dividend yield | 2.98% (2024) | 0% (2024) |
| Fiscal Year | 2024 | 2024 |
Efficiency & Valuation Duel: The Vital Signs
Financial ratios serve as a company’s DNA, exposing hidden risks and revealing operational excellence beneath the surface.
International Business Machines Corporation
IBM shows a solid net margin of 15.7%, indicating efficient profitability, yet its ROE and ROIC are absent, signaling challenges in capital returns. The stock trades at a stretched P/E of 26.1, somewhat expensive compared to sector norms. IBM rewards shareholders with a 2.27% dividend yield, balancing moderate income with reinvestment in operational efficiency.
Fiserv, Inc.
Fiserv posts a comparable net margin of 15.3%, with a neutral ROE at 11.6% and ROIC at 8.7%, reflecting average capital efficiency. Its valuation is stretched, with a high P/E near 38 and a rich P/B of 4.39. Fiserv offers no dividend, focusing instead on growth initiatives funded through retained earnings and moderate leverage.
Valuation Stretch vs. Operational Depth
IBM’s blend of steady profitability and shareholder dividends contrasts with Fiserv’s growth-focused profile and higher valuation multiples. IBM presents a more balanced risk-reward profile given its dividend and favorable interest coverage. Fiserv fits investors prioritizing growth despite richer valuations and absence of income.
Which one offers the Superior Shareholder Reward?
I see IBM offers a 2.27% dividend yield with a hefty 59% payout ratio, backed by strong free cash flow coverage over 2x, signaling dividend sustainability. IBM also runs moderate buybacks, boosting total shareholder return. Fiserv pays no dividends but reinvests heavily in growth and acquisitions, with no buybacks reported. Its higher margins and capital allocation to expansion may drive long-term value but lack immediate income. For 2026, IBM’s balanced dividend and buyback model delivers a more attractive total return profile for income-focused investors seeking steady rewards.
Comparative Score Analysis: The Strategic Profile
The radar chart reveals the fundamental DNA and trade-offs of International Business Machines Corporation and Fiserv, Inc., highlighting their financial strengths and vulnerabilities:
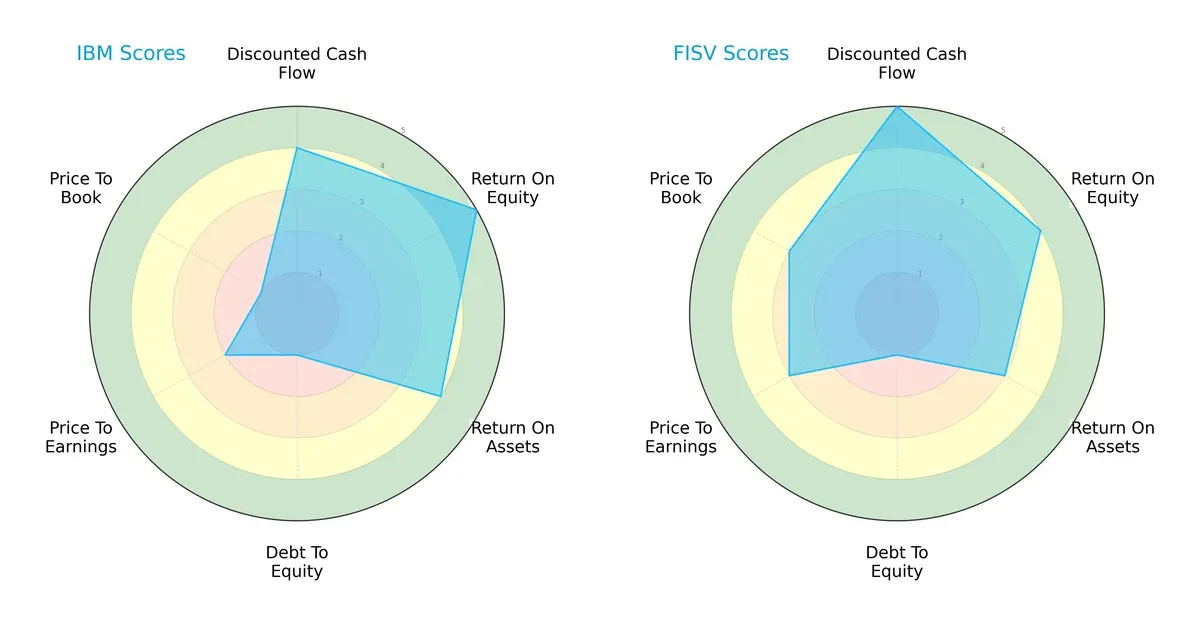
IBM shows strong operational efficiency with its highest ROE (5) and ROA (4) scores, signaling superior asset utilization. Fiserv leads in discounted cash flow (5) and valuation metrics (P/E 3, P/B 3), reflecting better market pricing and growth prospects. Both share a critical weakness in debt management, scoring 1 in debt-to-equity, indicating high leverage risk. Overall, IBM’s profile leans on operational excellence, while Fiserv offers a more balanced valuation and cash flow outlook.
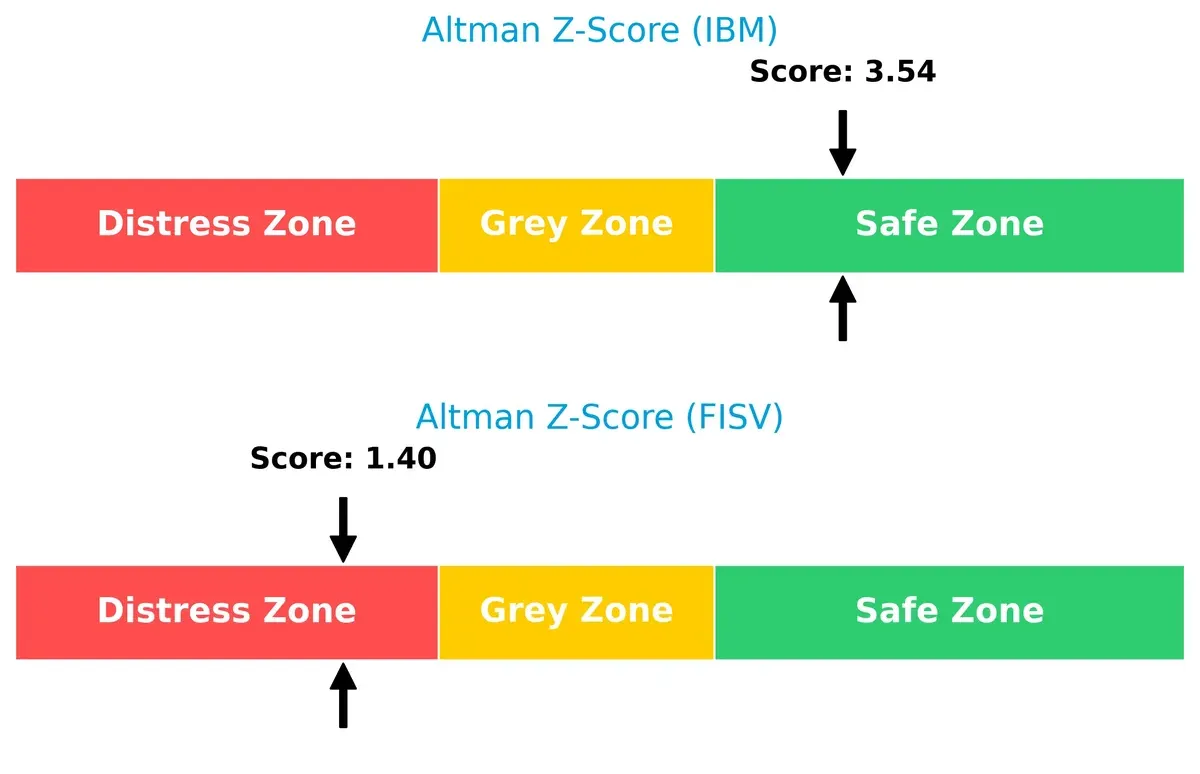
Bankruptcy Risk: Solvency Showdown
IBM’s Altman Z-Score of 3.54 places it firmly in the safe zone, indicating strong financial stability. Fiserv’s 1.40 score falls into the distress zone, signaling elevated bankruptcy risk under current economic conditions:
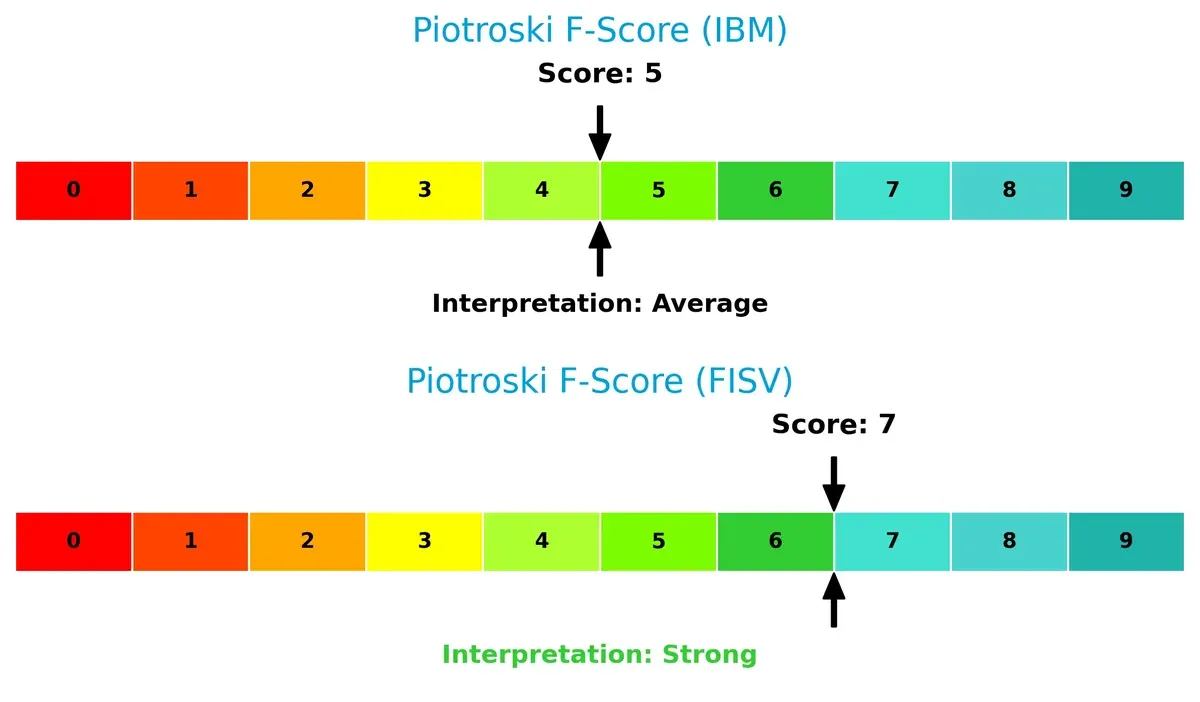
Financial Health: Quality of Operations
Fiserv’s Piotroski F-Score of 7 suggests robust internal financial health, outperforming IBM’s average score of 5. IBM’s lower score flags potential red flags in profitability or liquidity metrics compared to Fiserv:
How are the two companies positioned?
This section dissects IBM and FISV’s operational DNA by comparing their revenue distribution and internal dynamics—strengths and weaknesses. The goal is to confront their economic moats to identify which business model offers the most resilient competitive advantage today.
Revenue Segmentation: The Strategic Mix
This visual comparison dissects how International Business Machines Corporation and Fiserv, Inc. diversify their income streams and reveals their primary sector bets:
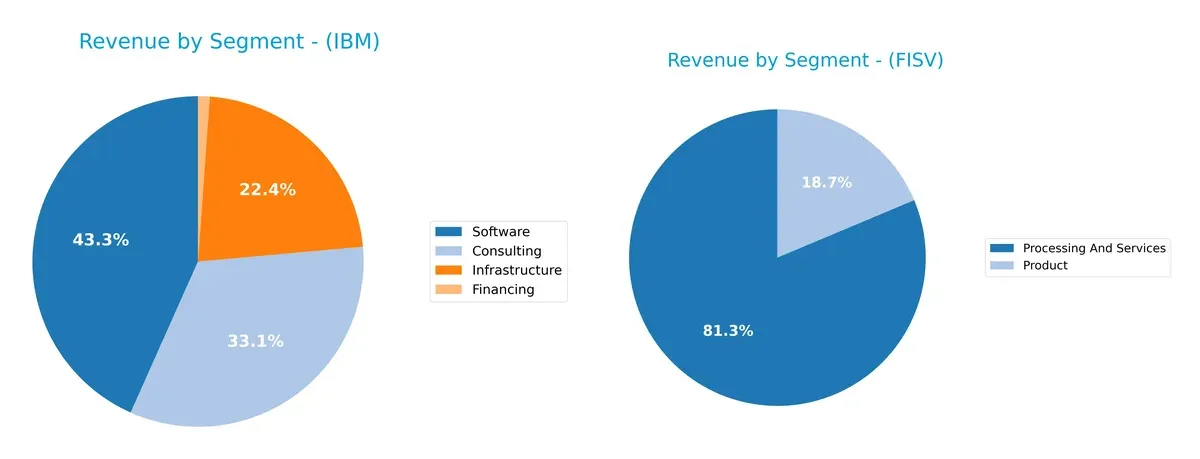
IBM displays a broad revenue mix anchored by Software at $27B, Consulting at $20.7B, and Infrastructure at $14B. This diversification reduces concentration risk and supports ecosystem lock-in through integrated tech services. Fiserv, however, relies heavily on Processing and Services, generating $16.6B, with its Product segment at $3.8B. This concentration on payment processing signals infrastructure dominance but exposes Fiserv to sector-specific volatility.
Strengths and Weaknesses Comparison
This table compares the Strengths and Weaknesses of IBM and Fiserv based on diversification, profitability, financial statements, innovation, global presence, and market share:
IBM Strengths
- Highly diversified revenue streams including Consulting, Software, Infrastructure, and Financing
- Strong global presence with significant revenues in Americas, EMEA, and Asia Pacific
- Favorable net margin at 15.69% and dividend yield of 2.27%
- Low debt-to-assets ratio and strong interest coverage ratio at 6.34
FISV Strengths
- Favorable net margin near IBM’s at 15.31%
- Positive return metrics (ROE 11.57%, ROIC 8.7%) with WACC at 6.1% signaling efficient capital use
- Favorable quick ratio and fixed asset turnover reflecting liquidity and operational efficiency
- Growing revenue from Processing and Product segments
IBM Weaknesses
- Unfavorable ROE and ROIC at 0%, indicating poor capital returns
- Unavailable WACC and unfavorable liquidity ratios (current and quick ratios at 0) raise financial stability concerns
- Unfavorable asset turnover metrics reducing operational efficiency
- High P/E ratio at 26.07 suggests possible overvaluation
FISV Weaknesses
- Unfavorable P/E of 37.97 and high P/B at 4.39 indicate valuation risks
- Neutral to unfavorable liquidity and leverage ratios including debt-to-assets at 32.34%
- Unfavorable asset turnover at 0.27, limiting efficiency
- No dividend yield reduces income appeal
Overall, IBM demonstrates a broader diversification and stronger global footprint but shows weaknesses in capital returns and liquidity. Fiserv presents better capital efficiency and liquidity metrics but faces valuation and operational efficiency challenges. Both companies exhibit strengths and weaknesses that influence their strategic priorities in profitability and financial management.
The Moat Duel: Analyzing Competitive Defensibility
A structural moat is the only reliable shield protecting long-term profits from relentless competitive erosion:
International Business Machines Corporation: Intangible Assets Moat
IBM’s primary advantage lies in its deep intangible assets—hybrid cloud software and AI solutions. This moat sustains stable margins and solid EBIT growth. Yet, its declining ROIC trend in 2025 signals caution for moat durability heading into 2026.
Fiserv, Inc.: Cost Advantage and Network Effects Moat
Fiserv’s moat combines cost advantages with network effects from its payments platform. It drives higher EBIT margins and growing ROIC, outperforming IBM’s trend. Expansion into digital banking services promises to deepen its competitive edge in 2026.
Moat Strength Showdown: Intangibles vs. Network-Driven Scale
Fiserv’s growing ROIC and expanding margins reveal a wider, more durable moat compared to IBM’s intangible asset base with a weakening ROIC. Fiserv stands better equipped to defend and grow its market share in the evolving fintech landscape.
Which stock offers better returns?
Over the past year, International Business Machines Corporation (IBM) showed a strong price increase, while Fiserv, Inc. (FISV) experienced a significant decline, highlighting contrasting trading dynamics.
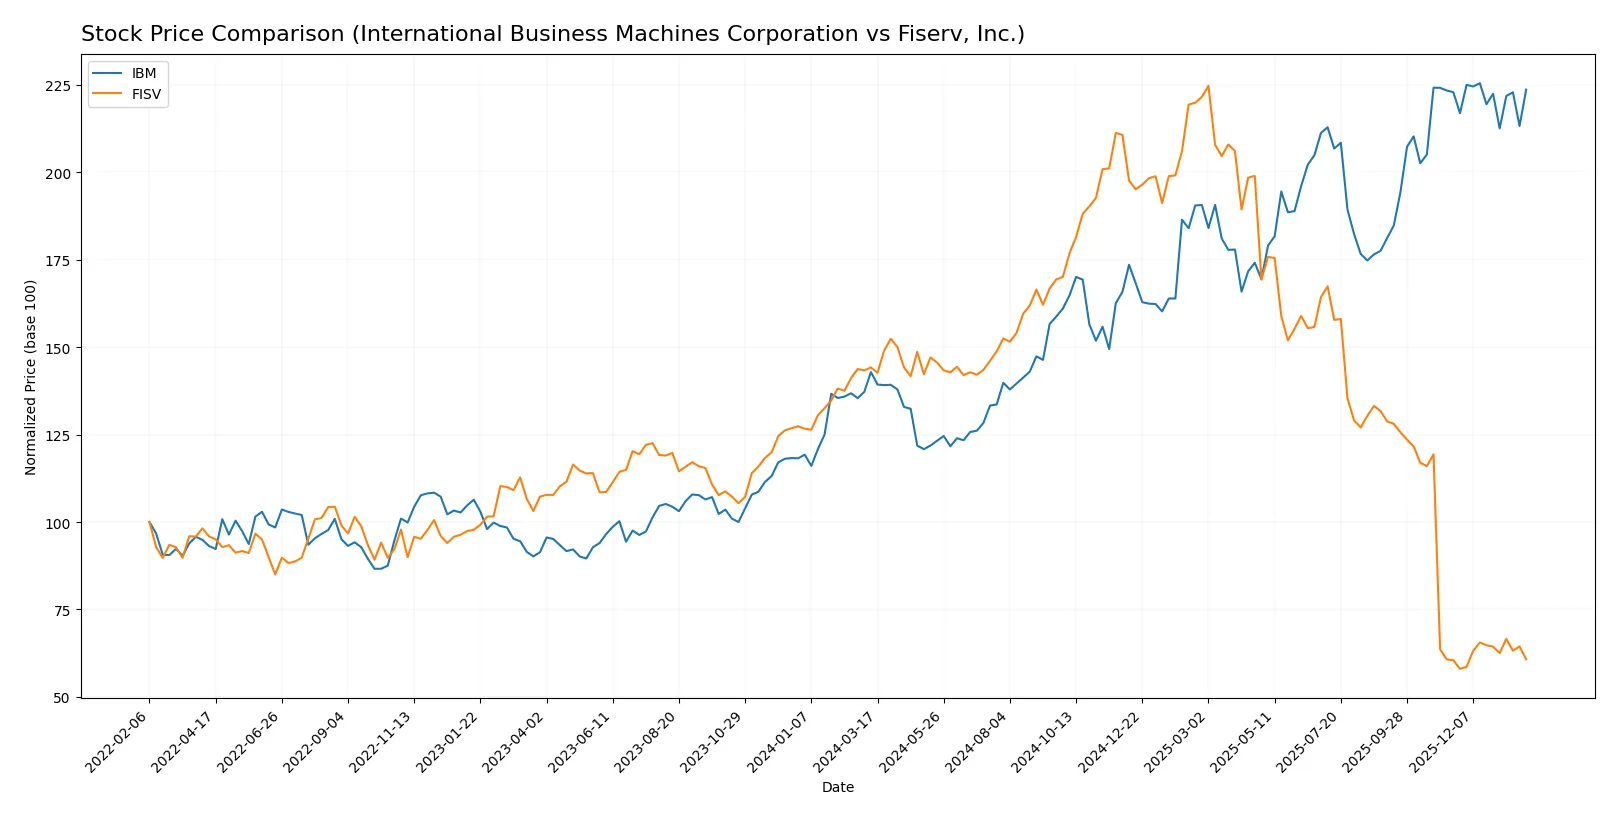
Trend Comparison
IBM’s stock rose 56.52% over the last 12 months, marking a bullish trend with decelerating momentum and a high volatility level (std deviation 43.36). The price peaked at 309.24 and bottomed at 165.71.
Fiserv’s stock fell 57.86% in the same period, confirming a bearish trend with accelerating downward momentum and slightly higher volatility (std deviation 46.88). Its price ranged between 60.84 and 235.69.
IBM outperformed Fiserv, delivering the highest market returns despite a recent mild price stagnation, while Fiserv continues to face downward pressure.
Target Prices
Analysts present a cautiously optimistic consensus on target prices for IBM and Fiserv.
| Company | Target Low | Target High | Consensus |
|---|---|---|---|
| International Business Machines Corporation (IBM) | 304 | 380 | 349.5 |
| Fiserv, Inc. (FISV) | 62 | 180 | 105.61 |
The consensus target for IBM at 349.5 suggests a modest upside from the current 306.7 price, reflecting steady confidence in its hybrid cloud and consulting businesses. Fiserv’s broader target range indicates greater uncertainty, but the consensus of 105.61 implies significant potential growth above the current 63.73 share price.

Don’t Let Luck Decide Your Entry Point
Optimize your entry points with our advanced ProRealTime indicators. You’ll get efficient buy signals with precise price targets for maximum performance. Start outperforming now!
How do institutions grade them?
International Business Machines Corporation Grades
The table below shows recent grades from reputable financial analysts for IBM.
| Grading Company | Action | New Grade | Date |
|---|---|---|---|
| Wedbush | maintain | Outperform | 2026-01-29 |
| RBC Capital | maintain | Outperform | 2026-01-29 |
| Stifel | maintain | Buy | 2026-01-29 |
| JP Morgan | maintain | Neutral | 2026-01-29 |
| UBS | maintain | Sell | 2026-01-29 |
| Evercore ISI Group | maintain | Outperform | 2026-01-29 |
| Jefferies | maintain | Buy | 2026-01-29 |
| JP Morgan | maintain | Neutral | 2026-01-21 |
| Evercore ISI Group | maintain | Outperform | 2026-01-20 |
| B of A Securities | maintain | Buy | 2026-01-13 |
Fiserv, Inc. Grades
The table below shows recent grades from reputable financial analysts for Fiserv.
| Grading Company | Action | New Grade | Date |
|---|---|---|---|
| Tigress Financial | maintain | Buy | 2025-12-31 |
| Mizuho | maintain | Outperform | 2025-12-22 |
| Argus Research | downgrade | Hold | 2025-10-30 |
| RBC Capital | maintain | Outperform | 2025-10-30 |
| Bernstein | downgrade | Market Perform | 2025-10-30 |
| Seaport Global | downgrade | Neutral | 2025-10-30 |
| Keybanc | downgrade | Sector Weight | 2025-10-30 |
| Truist Securities | downgrade | Hold | 2025-10-30 |
| Keefe, Bruyette & Woods | maintain | Outperform | 2025-10-30 |
| UBS | downgrade | Neutral | 2025-10-30 |
Which company has the best grades?
IBM holds a majority of “Buy” and “Outperform” grades, while Fiserv shows multiple downgrades to “Hold” and “Neutral.” Investors may view IBM’s stronger consensus as a sign of greater institutional confidence.
Risks specific to each company
The following categories identify critical pressure points and systemic threats facing International Business Machines Corporation (IBM) and Fiserv, Inc. (FISV) in the 2026 market environment:
1. Market & Competition
International Business Machines Corporation
- Faces intense competition in hybrid cloud and AI software from agile tech firms.
Fiserv, Inc.
- Competes in fast-evolving fintech and payments with strong pressure from digital disruptors.
2. Capital Structure & Debt
International Business Machines Corporation
- Shows favorable debt metrics and strong interest coverage, indicating solid financial stability.
Fiserv, Inc.
- Carries moderate debt load with neutral coverage, implying manageable but noticeable leverage risk.
3. Stock Volatility
International Business Machines Corporation
- Exhibits lower beta (0.70), suggesting less stock price volatility and defensive characteristics.
Fiserv, Inc.
- Slightly higher beta (0.80) indicates greater sensitivity to market swings and more volatility.
4. Regulatory & Legal
International Business Machines Corporation
- Subject to data privacy and tech regulations globally, with risks in compliance costs.
Fiserv, Inc.
- Faces regulatory scrutiny in payments and financial services, with evolving fintech compliance demands.
5. Supply Chain & Operations
International Business Machines Corporation
- Relies on complex global supply chain for hardware, vulnerable to disruptions and component shortages.
Fiserv, Inc.
- Operates cloud-based fintech services with fewer physical supply chain risks but tech infrastructure demands.
6. ESG & Climate Transition
International Business Machines Corporation
- Actively invests in climate initiatives but faces pressure to meet ambitious sustainability targets.
Fiserv, Inc.
- Increasing ESG focus required to address investor expectations and fintech sector environmental impact.
7. Geopolitical Exposure
International Business Machines Corporation
- Global operations expose IBM to geopolitical tensions, trade restrictions, and foreign policy risks.
Fiserv, Inc.
- Primarily US-focused but expanding internationally, with moderate exposure to geopolitical uncertainties.
Which company shows a better risk-adjusted profile?
IBM’s most impactful risk is market competition in a fast-changing tech landscape, while Fiserv’s chief risk lies in its financial leverage and regulatory complexity. IBM’s lower stock volatility and stronger debt metrics suggest a better risk-adjusted profile. However, Fiserv’s distress-level Altman Z-Score signals significant financial vulnerability despite strong operational scores. Recent data reveals IBM’s robust interest coverage of 6.34 versus Fiserv’s 4.64, justifying caution around Fiserv’s capital structure risks.
Final Verdict: Which stock to choose?
International Business Machines Corporation (IBM) stands out as a cash machine with strong income quality and impressive net margin growth. Its main point of vigilance is the declining ROIC trend and less robust liquidity ratios, signaling caution. IBM fits well in portfolios targeting stable income with moderate growth potential.
Fiserv, Inc. (FISV) boasts a durable competitive moat supported by a growing ROIC that outpaces its WACC, reflecting efficient capital allocation and rising profitability. While it carries a higher valuation premium and a weaker Altman Z-score, FISV offers better stability in operational returns, suiting GARP investors who value growth with reasonable risk.
If you prioritize steady cash generation and a history of solid income growth, IBM is the compelling choice despite some financial headwinds. However, if you seek a company with a demonstrably strong and expanding moat and are comfortable with valuation premiums, FISV offers superior capital efficiency and growth durability.
Disclaimer: Investment carries a risk of loss of initial capital. The past performance is not a reliable indicator of future results. Be sure to understand risks before making an investment decision.
Go Further
I encourage you to read the complete analyses of International Business Machines Corporation and Fiserv, Inc. to enhance your investment decisions: