In the dynamic world of information technology services, Fiserv, Inc. and Globant S.A. stand out as influential players driving innovation and growth. Both companies operate in overlapping markets, offering cutting-edge digital solutions that transform financial services and enterprise technology. This comparison explores their strategies and market positions to help you, the investor, identify which company presents the most compelling opportunity for your portfolio in 2026.

Table of contents
Companies Overview
I will begin the comparison between Fiserv and Globant by providing an overview of these two companies and their main differences.
Fiserv Overview
Fiserv, Inc. is a US-based technology services company focused on payment and financial services technology worldwide. It operates through Acceptance, Fintech, and Payments segments, offering solutions such as point-of-sale merchant acquiring, digital banking, card processing, and fraud protection. Headquartered in Milwaukee, Wisconsin, Fiserv serves banks, merchants, and other financial institutions with an emphasis on secure and integrated commerce platforms.
Globant Overview
Globant S.A., headquartered in Luxembourg, is a technology services company providing a broad range of digital transformation and consulting services globally. Its offerings include e-commerce, cloud transformation, AI-driven data strategies, gaming, and healthcare technology solutions. Globant focuses on innovation-driven services such as agile delivery, blockchain, UI/UX design, and sustainable business solutions, catering to diverse industries including media, travel, and healthcare.
Key similarities and differences
Both Fiserv and Globant operate in the technology services sector, providing digital solutions to global clients. Fiserv specializes primarily in financial services technology, including payment processing and banking software, while Globant offers a wider variety of IT consulting and digital transformation services across multiple industries. Fiserv’s business model is centered on financial institutions and merchants, contrasting with Globant’s broader focus on innovation and technology consulting.
Income Statement Comparison
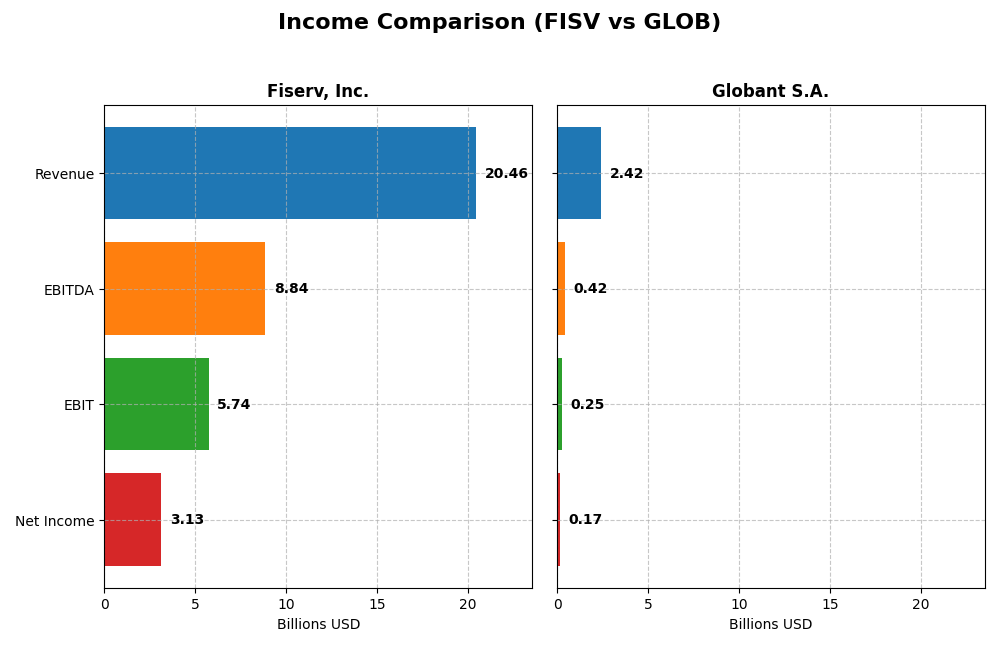
This table provides a side-by-side comparison of key income statement metrics for Fiserv, Inc. and Globant S.A. based on their most recent fiscal year data.
| Metric | Fiserv, Inc. | Globant S.A. |
|---|---|---|
| Market Cap | 36.7B | 3.0B |
| Revenue | 20.5B | 2.4B |
| EBITDA | 8.8B | 417M |
| EBIT | 5.7B | 254M |
| Net Income | 3.1B | 166M |
| EPS | 5.41 | 3.82 |
| Fiscal Year | 2024 | 2024 |
Income Statement Interpretations
Fiserv, Inc.
Fiserv’s revenue steadily increased from $14.9B in 2020 to $20.5B in 2024, with net income rising sharply from $958M to $3.13B over the same period. Gross and EBIT margins remained favorable, above 60% and 28% respectively, reflecting operational efficiency. In 2024, revenue growth slowed to 7.1%, but EBIT expanded 17.2%, though net margin slightly declined.
Globant S.A.
Globant’s revenue surged impressively from $814M in 2020 to $2.42B in 2024, with net income growing from $54M to $166M. Margins improved, with a 35.7% gross margin and 10.5% EBIT margin in 2024, supported by controlled interest expenses. The most recent year saw 15.3% revenue growth and 16.6% EBIT increase, while net margin fell by 9.3%.
Which one has the stronger fundamentals?
Both companies show favorable income trends and margin improvements, but Fiserv exhibits higher absolute profit levels and stronger EBIT and net margin percentages. Globant demonstrates faster revenue growth and margin expansion but from a smaller base. Fiserv’s scale and margin stability contrast with Globant’s rapid growth yet lower profitability, highlighting differing fundamental strengths.
Financial Ratios Comparison
Below is a comparison of key financial ratios for Fiserv, Inc. and Globant S.A. based on their most recent fiscal year 2024 data.
| Ratios | Fiserv, Inc. (FISV) | Globant S.A. (GLOB) |
|---|---|---|
| ROE | 11.6% | 8.4% |
| ROIC | 8.7% | 6.8% |
| P/E | 38.0 | 57.6 |
| P/B | 4.39 | 4.86 |
| Current Ratio | 1.06 | 1.54 |
| Quick Ratio | 1.06 | 1.54 |
| D/E (Debt-to-Equity) | 0.92 | 0.21 |
| Debt-to-Assets | 32.3% | 13.0% |
| Interest Coverage | 4.75 | 7.87 |
| Asset Turnover | 0.27 | 0.76 |
| Fixed Asset Turnover | 8.62 | 8.70 |
| Payout Ratio | 0 | 0 |
| Dividend Yield | 0% | 0% |
Interpretation of the Ratios
Fiserv, Inc.
Fiserv shows a balanced ratio profile with favorable net margin (15.31%) and WACC (6.11%), but unfavorable valuation multiples like PE (37.97) and PB (4.39). Liquidity and leverage ratios are mostly neutral to favorable, though asset turnover is weak. The company does not pay dividends, likely focusing on reinvestment and operational growth instead of shareholder distributions.
Globant S.A.
Globant presents a slightly favorable ratio set, with strong liquidity (current and quick ratios at 1.54) and low debt levels (debt to equity 0.21). However, its ROE (8.44%) and valuation multiples (PE 57.64, PB 4.86) are less attractive. Like Fiserv, Globant does not pay dividends, which may reflect a growth-oriented strategy prioritizing reinvestment and innovation.
Which one has the best ratios?
Globant holds a slight edge with more favorable liquidity and leverage ratios, supporting financial stability. Fiserv’s stronger profitability ratios contrast with weaker valuation and asset efficiency metrics. Both face challenges with high valuation multiples and lack dividend returns, making their ratio profiles relatively balanced but distinct in strengths.
Strategic Positioning
This section compares the strategic positioning of Fiserv, Inc. and Globant S.A., including Market position, Key segments, and Exposure to technological disruption:
Fiserv, Inc.
- Large market cap (~37B USD) with moderate competitive pressure in global payment and financial services.
- Focuses on payment technology, financial services, and fintech segments including POS, processing, cards.
- Exposure includes digital payments and fintech innovation, with established platforms like Clover.
Globant S.A.
- Smaller market cap (~3B USD) with higher competitive pressure in diverse global technology services.
- Offers broad technology services: digital transformation, cloud, AI, gaming, healthcare, sustainability, and business solutions.
- High exposure to disruption via cloud, AI, blockchain, metaverse, and agile delivery services across multiple industries.
Fiserv, Inc. vs Globant S.A. Positioning
Fiserv shows a more concentrated approach focused on payment and financial service technologies, while Globant pursues a diversified technology services strategy covering multiple sectors. Fiserv relies on established platforms; Globant bets on innovation across emerging tech trends.
Which has the best competitive advantage?
Fiserv demonstrates a very favorable moat with strong value creation and growing profitability, indicating a durable competitive advantage. Globant has a slightly unfavorable moat due to value destruction despite improving profitability, signaling weaker competitive sustainability.
Stock Comparison
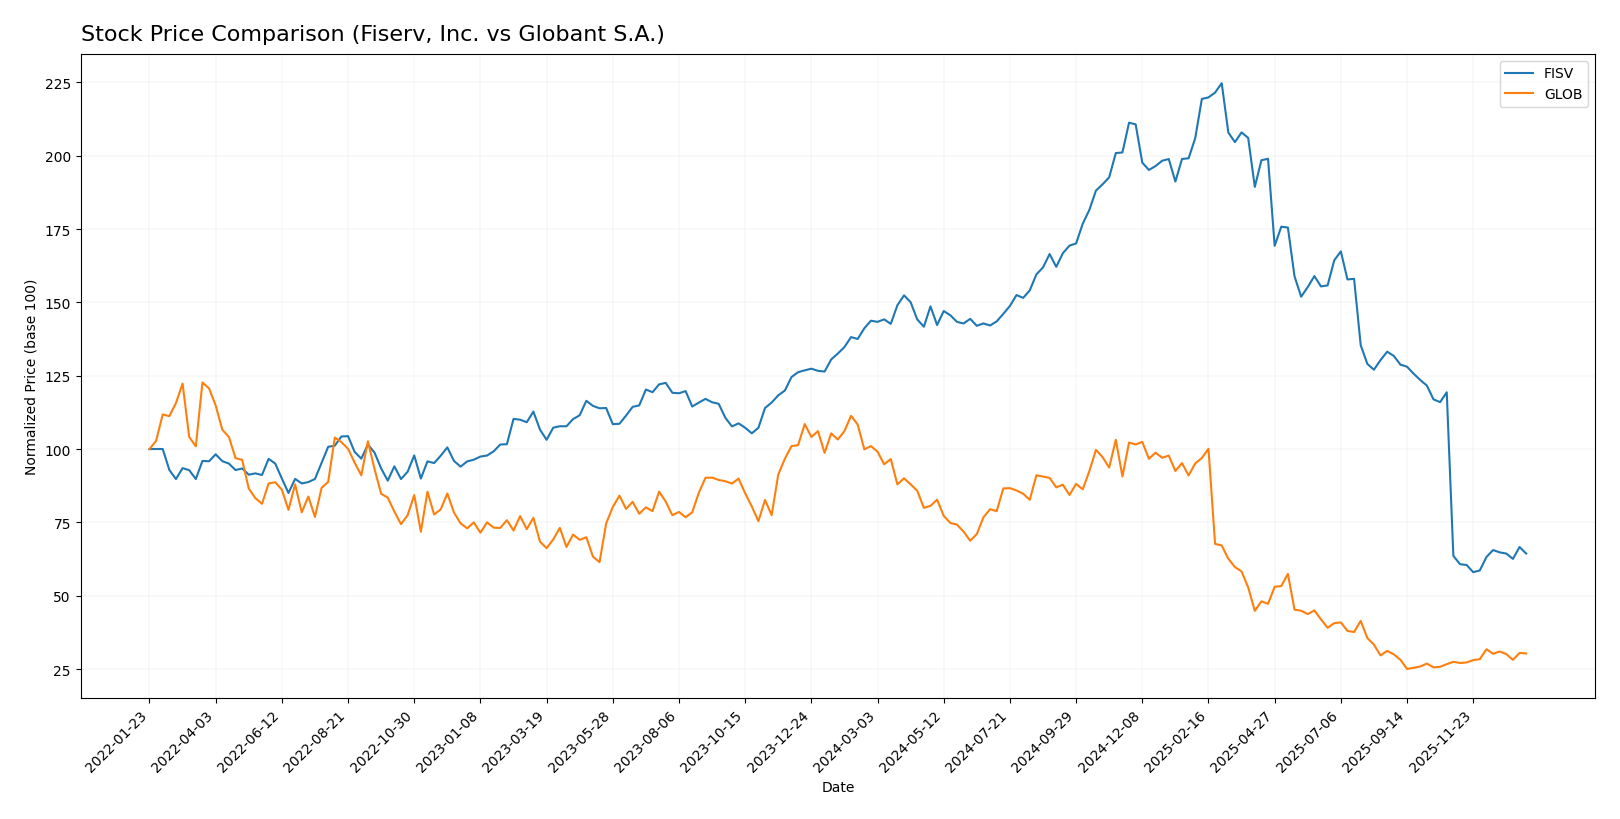
The stock prices of Fiserv, Inc. (FISV) and Globant S.A. (GLOB) over the past year reveal significant bearish trends with accelerating declines, though recent months show contrasting momentum shifts in trading dynamics.
Trend Analysis
Fiserv, Inc. (FISV) experienced a 55.23% price decline over the past 12 months, indicating a bearish trend with accelerating downward momentum. The stock showed high volatility with a standard deviation of 44.96 and a price range from 235.69 to 60.84.
Globant S.A. (GLOB) saw a sharper 70.01% decrease in stock price over the same period, also bearish with acceleration. Volatility was higher at 61.44 standard deviation, with prices ranging between 231.36 and 56.11.
Comparing both, Globant’s stock delivered a more pronounced market decline than Fiserv’s, though recent trends show GLOB’s stronger short-term rebound of 10.31% versus FISV’s 1.21%.
Target Prices
The current analyst consensus presents a balanced outlook with defined high and low targets for both Fiserv, Inc. and Globant S.A.
| Company | Target High | Target Low | Consensus |
|---|---|---|---|
| Fiserv, Inc. | 180 | 62 | 111.39 |
| Globant S.A. | 80 | 68 | 72.5 |
Fiserv’s consensus target of 111.39 is significantly above its current price of 67.5 USD, suggesting potential upside. Globant’s target consensus at 72.5 USD is slightly above its current price of 67.93 USD, indicating modest growth expectations.
Analyst Opinions Comparison
This section compares analysts’ ratings and grades for Fiserv, Inc. and Globant S.A.:
Rating Comparison
Fiserv, Inc. Rating
- Rating: B+, assessed as very favorable overall.
- Discounted Cash Flow Score: 5, very favorable.
- ROE Score: 4, favorable efficiency in equity use.
- ROA Score: 3, moderate asset utilization.
- Debt To Equity Score: 1, very unfavorable risk.
- Overall Score: 3, moderate overall standing.
Globant S.A. Rating
- Rating: A-, considered very favorable overall.
- Discounted Cash Flow Score: 5, very favorable.
- ROE Score: 3, moderate efficiency in equity use.
- ROA Score: 3, moderate asset utilization.
- Debt To Equity Score: 3, moderate financial risk.
- Overall Score: 4, favorable overall standing.
Which one is the best rated?
Based on the provided data, Globant S.A. holds a higher overall score (4 vs. 3) and a better debt to equity score, while Fiserv has a stronger ROE score. Globant’s rating and financial risk profile are comparatively more favorable.
Scores Comparison
Here is a comparison of the financial scores for Fiserv, Inc. and Globant S.A.:
Fiserv Scores
- Altman Z-Score: 1.41, indicating financial distress zone.
- Piotroski Score: 7, suggesting strong financial health.
Globant Scores
- Altman Z-Score: 3.05, indicating a safe zone from bankruptcy.
- Piotroski Score: 5, indicating average financial strength.
Which company has the best scores?
Based on the provided data, Globant has a better Altman Z-Score indicating lower bankruptcy risk, while Fiserv scores higher on the Piotroski scale, showing stronger financial health.
Grades Comparison
Here is a comparison of recent grades assigned to Fiserv, Inc. and Globant S.A. by various financial institutions:
Fiserv, Inc. Grades
This table summarizes recent grades from established grading companies for Fiserv, Inc.:
| Grading Company | Action | New Grade | Date |
|---|---|---|---|
| Tigress Financial | Maintain | Buy | 2025-12-31 |
| Mizuho | Maintain | Outperform | 2025-12-22 |
| Goldman Sachs | Downgrade | Neutral | 2025-10-30 |
| Bernstein | Downgrade | Market Perform | 2025-10-30 |
| Argus Research | Downgrade | Hold | 2025-10-30 |
| Morgan Stanley | Downgrade | Equal Weight | 2025-10-30 |
| Truist Securities | Downgrade | Hold | 2025-10-30 |
| JP Morgan | Maintain | Overweight | 2025-10-30 |
| Citigroup | Maintain | Neutral | 2025-10-30 |
| RBC Capital | Maintain | Outperform | 2025-10-30 |
Fiserv’s grades show a recent mixed trend with several downgrades in late 2025 but some firms maintaining buy or outperform ratings.
Globant S.A. Grades
This table summarizes recent grades from established grading companies for Globant S.A.:
| Grading Company | Action | New Grade | Date |
|---|---|---|---|
| Jefferies | Downgrade | Hold | 2025-11-20 |
| UBS | Maintain | Neutral | 2025-11-18 |
| JP Morgan | Maintain | Neutral | 2025-11-14 |
| Needham | Maintain | Buy | 2025-11-14 |
| Canaccord Genuity | Maintain | Hold | 2025-11-14 |
| Goldman Sachs | Maintain | Neutral | 2025-10-09 |
| UBS | Maintain | Neutral | 2025-08-20 |
| Goldman Sachs | Maintain | Neutral | 2025-08-18 |
| Needham | Maintain | Buy | 2025-08-15 |
| JP Morgan | Downgrade | Neutral | 2025-08-15 |
Globant’s grades mostly remain neutral or hold, with a few buy ratings and some recent downgrades to hold or neutral.
Which company has the best grades?
Both Fiserv and Globant hold a consensus “Buy” rating, but Fiserv has a larger number of buy and outperform grades despite recent downgrades. Investors might view Fiserv’s broader support as a sign of stronger institutional confidence, whereas Globant’s more neutral stance indicates caution.
Strengths and Weaknesses
The table below summarizes key strengths and weaknesses of Fiserv, Inc. and Globant S.A. based on their recent financial and operational data.
| Criterion | Fiserv, Inc. (FISV) | Globant S.A. (GLOB) |
|---|---|---|
| Diversification | High revenue from diversified segments: processing, fintech, payments | Moderate diversification, focused on digital services |
| Profitability | Strong net margin (15.31%) and positive ROIC vs WACC; value creator | Lower net margin (6.86%), ROIC below WACC; value destroyer |
| Innovation | Steady investment in technology products and services | Growing profitability but still shedding value, innovation needed |
| Global presence | Large global footprint in financial services | Expanding global client base in IT services |
| Market Share | Leading position in payment processing and financial services | Growing market presence but less dominant |
Fiserv exhibits a durable competitive advantage with solid profitability and diversified revenue streams, making it a more stable investment. Globant shows improving profitability but is currently less efficient in capital use, indicating higher risk despite growth potential.
Risk Analysis
Below is a risk comparison table for Fiserv, Inc. (FISV) and Globant S.A. (GLOB) based on the most recent data from 2024–2026:
| Metric | Fiserv, Inc. (FISV) | Globant S.A. (GLOB) |
|---|---|---|
| Market Risk | Moderate (Beta 0.80, stable) | Higher (Beta 1.20, more volatile) |
| Debt Level | Moderate (Debt/Equity 0.92) | Low (Debt/Equity 0.21) |
| Regulatory Risk | Moderate (US financial sector) | Moderate (Global digital services) |
| Operational Risk | Moderate (Tech integration) | Moderate (Rapid innovation demand) |
| Environmental Risk | Low (Service industry) | Low (Service industry) |
| Geopolitical Risk | Low (US-based) | Moderate (Luxembourg HQ, global) |
Fiserv faces moderate market and debt risks with a Beta under 1 but a debt-to-equity ratio near parity, raising some financial leverage concerns. Globant shows higher market volatility but lower financial risk thanks to conservative debt levels. Geopolitical risks are more pronounced for Globant due to its global operations. Investors should weigh Fiserv’s financial leverage against Globant’s higher volatility and exposure to international regulatory environments.
Which Stock to Choose?
Fiserv, Inc. (FISV) shows a favorable income evolution with strong gross and EBIT margins and significant net income growth over 2020-2024. Financial ratios are neutral overall but highlight a favorable net margin and WACC. Profitability is solid with ROE at 11.57%. Debt levels are moderate, and the rating is very favorable (B+).
Globant S.A. (GLOB) exhibits strong revenue and net income growth, with favorable income statement metrics including gross and EBIT margins. Financial ratios lean slightly favorable, supported by a low debt ratio and strong interest coverage, though ROE is less robust at 8.44%. The company’s rating is very favorable (A-).
For investors seeking durable value creation, FISV’s very favorable MOAT and growing ROIC above WACC might signal stronger competitive advantages. Conversely, GLOB’s slightly unfavorable MOAT despite improving profitability could appeal to those favoring growth with lower leverage. The choice may depend on whether an investor prioritizes stable value creation or dynamic growth potential.
Disclaimer: Investment carries a risk of loss of initial capital. The past performance is not a reliable indicator of future results. Be sure to understand risks before making an investment decision.
Go Further
I encourage you to read the complete analyses of Fiserv, Inc. and Globant S.A. to enhance your investment decisions: