Home > Comparison > Technology > FISV vs G
The strategic rivalry between Fiserv, Inc. and Genpact Limited shapes the evolution of the global information technology services sector. Fiserv operates as a capital-intensive fintech powerhouse specializing in payment and financial technology solutions. Genpact, by contrast, excels as a high-touch business process outsourcing and IT services leader. This analysis seeks to determine which model delivers superior risk-adjusted returns for a diversified portfolio amid intensifying sector competition.
Table of contents
Companies Overview
Fiserv, Inc. and Genpact Limited are pivotal players shaping the Information Technology Services sector.
Fiserv, Inc.: Payment and Financial Services Technology Leader
Fiserv dominates the global payment and financial services technology market. Its revenue stems from three segments: Acceptance, Fintech, and Payments, delivering solutions like point-of-sale systems, digital banking, and card processing. In 2026, Fiserv emphasizes expanding its cloud-based platforms and enhancing security and fraud protection to strengthen its competitive edge.
Genpact Limited: Global Business Process Outsourcing Specialist
Genpact excels in business process outsourcing and IT services across multiple industries. It generates revenue from finance, accounting, supply chain, and IT transformation services. The firm’s 2026 strategy focuses on integrating digital solutions and ESG advisory services, reflecting growing demand for sustainability and operational efficiency.
Strategic Collision: Similarities & Divergences
Fiserv pursues a technology-driven, product-centric model, while Genpact follows a client-centric, service-oriented philosophy. Their primary battleground is financial services, where digital transformation drives competition. Fiserv offers scalable platforms with embedded security; Genpact provides customized outsourcing and advisory. These distinctions yield contrasting investment profiles: Fiserv emphasizes innovation in financial tech; Genpact prioritizes operational excellence and ESG integration.
Income Statement Comparison
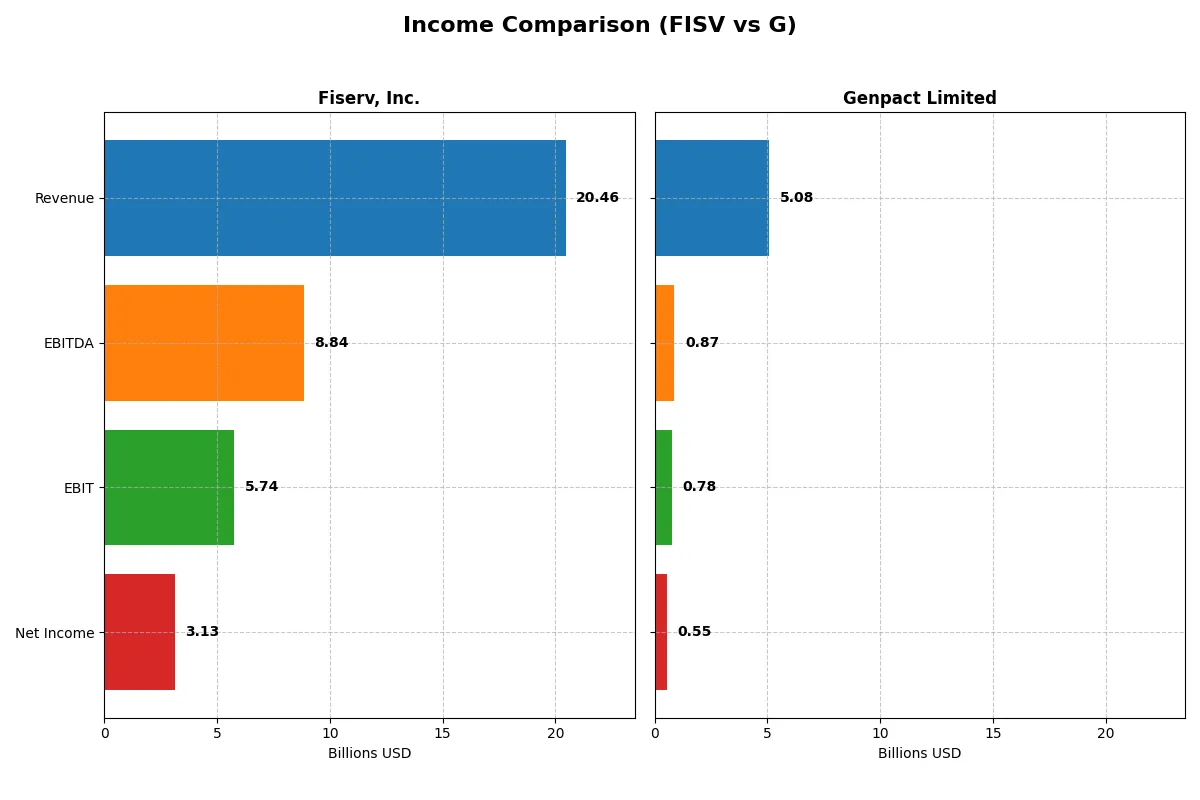
This data dissects the core profitability and scalability of both corporate engines to reveal who dominates the bottom line:
| Metric | Fiserv, Inc. (FISV) | Genpact Limited (G) |
|---|---|---|
| Revenue | 20.5B | 5.08B |
| Cost of Revenue | 8.01B | 3.25B |
| Operating Expenses | 6.56B | 1.05B |
| Gross Profit | 12.4B | 1.83B |
| EBITDA | 8.84B | 875M |
| EBIT | 5.74B | 780M |
| Interest Expense | 1.24B | 50M |
| Net Income | 3.13B | 552M |
| EPS | 5.41 | 3.18 |
| Fiscal Year | 2024 | 2025 |
Income Statement Analysis: The Bottom-Line Duel
This income statement comparison reveals the true efficiency and profitability of each company’s operational engine over recent years.
Fiserv, Inc. Analysis
Fiserv’s revenue climbs steadily from $14.9B in 2020 to $20.5B in 2024, reflecting strong growth momentum. Gross margins hold favorably above 60%, while net margins hover near 15%, showcasing robust profitability. The 2024 net income hits $3.13B, supported by efficient cost control and an EBIT margin of 28%, signaling solid operational leverage.
Genpact Limited Analysis
Genpact’s revenue grows from $4.0B in 2021 to $5.1B in 2025, a moderate pace. Its gross margin at 36% and net margin near 11% remain healthy but notably leaner than Fiserv’s. The 2025 net income of $552M shows steady improvement, with EBIT margin around 15%, indicating consistent but less aggressive profitability expansion compared to its peer.
Margin Dominance vs. Steady Growth
Fiserv commands higher margins and absolute profits, with superior operational efficiency and stronger net income growth over five years. Genpact’s profile emphasizes steady revenue and earnings expansion with moderate margins. For investors, Fiserv’s blend of scale and margin strength offers a more compelling fundamental advantage, reflecting a higher-quality earnings engine.
Financial Ratios Comparison
These vital ratios act as a diagnostic tool to expose the underlying fiscal health, valuation premiums, and capital efficiency:
| Ratios | Fiserv, Inc. (FISV) | Genpact Limited (G) |
|---|---|---|
| ROE | 11.57% | 21.67% |
| ROIC | 8.70% | 12.32% |
| P/E | 38.0x | 14.7x |
| P/B | 4.39x | 3.19x |
| Current Ratio | 1.06 | 1.66 |
| Quick Ratio | 1.06 | 1.66 |
| D/E | 0.92 | 0.23 |
| Debt-to-Assets | 32.3% | 9.9% |
| Interest Coverage | 4.75x | 15.32x |
| Asset Turnover | 0.27 | 0.87 |
| Fixed Asset Turnover | 8.62 | 13.65 |
| Payout ratio | 0% | 21.3% |
| Dividend yield | 0% | 1.45% |
| Fiscal Year | 2024 | 2025 |
Efficiency & Valuation Duel: The Vital Signs
Financial ratios provide a company’s DNA, unveiling hidden risks and operational strengths investors must understand to gauge true value.
Fiserv, Inc.
Fiserv displays a solid net margin of 15.31%, signaling decent profitability, but a modest ROE of 11.57% limits return expectations. The stock trades at a stretched P/E of 37.97 and a high P/B of 4.39, indicating expensive valuation. Fiserv pays no dividend, suggesting reinvestment in operational efficiency rather than shareholder returns.
Genpact Limited
Genpact impresses with a strong ROE of 21.67% and a robust net margin of 10.88%, reflecting efficient capital use and profitability. Its P/E ratio of 14.72 is attractive, pointing to fair valuation. The company offers a modest 1.45% dividend yield, balancing shareholder returns with growth investments.
Valuation Discipline vs. Profitability Strength
Genpact offers a compelling mix of profitability and reasonable valuation, with most ratios favoring operational strength and financial health. Fiserv’s premium multiples and lack of dividends signal higher risk. Investors seeking value with solid returns may prefer Genpact’s profile, while those tolerating valuation stretch might consider Fiserv.
Which one offers the Superior Shareholder Reward?
I see that Fiserv, Inc. (FISV) does not pay dividends, focusing instead on robust share buybacks funded by strong free cash flow (8.7B FCF per share in 2024). Genpact Limited (G) offers a modest dividend yield around 1.4% with a payout ratio near 21%, supported by solid free cash flow coverage (90%). FISV’s buyback intensity and zero dividend payout indicate aggressive capital return, while Genpact balances dividends with reinvestment. I judge FISV’s shareholder reward superior in 2026 due to its larger capital return via buybacks and sustainable free cash flow, which historically signals higher total returns in tech-adjacent sectors. Genpact’s model suits income investors but lacks FISV’s growth-driven capital allocation edge.
Comparative Score Analysis: The Strategic Profile
The radar chart reveals the fundamental DNA and trade-offs of Fiserv, Inc. and Genpact Limited, highlighting their distinct financial strengths and vulnerabilities:
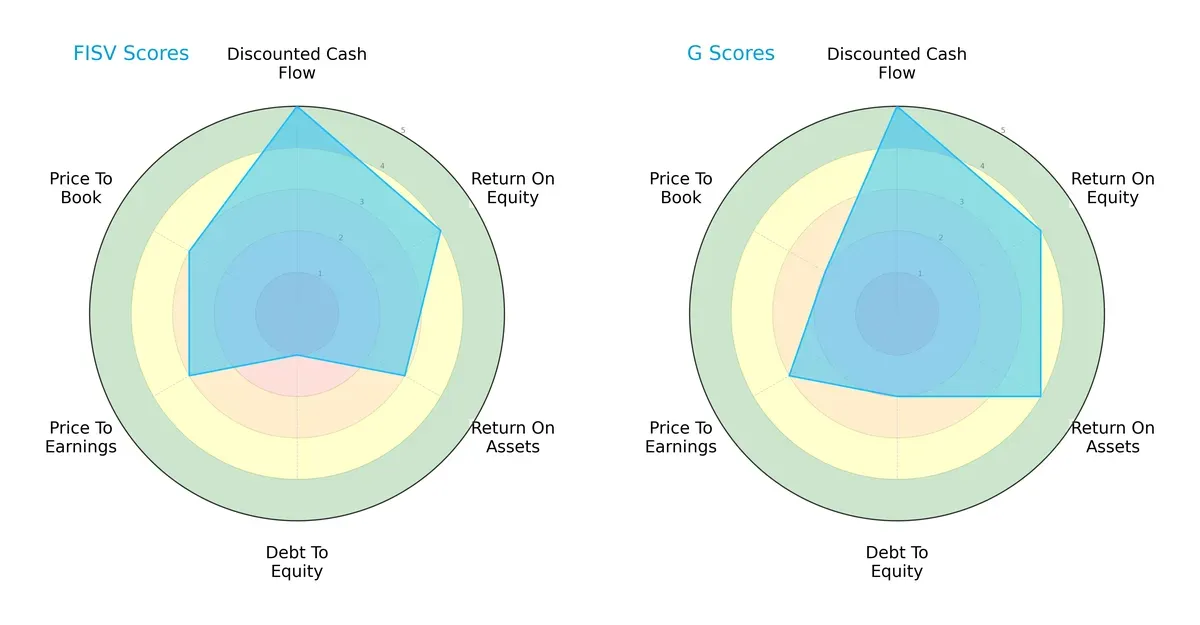
Genpact presents a more balanced profile with favorable scores in ROA (4) and debt-to-equity (2), signaling efficient asset use and moderate leverage. Fiserv matches Genpact’s high DCF score (5) but struggles with a very unfavorable debt-to-equity score (1), indicating higher financial risk. Valuation metrics favor Fiserv slightly with moderate P/E and P/B scores (3 each), whereas Genpact’s price-to-book score is less attractive (2). Overall, Genpact’s profile suggests steadier operational efficiency, while Fiserv leans heavily on cash flow strength but carries elevated leverage risk.
Bankruptcy Risk: Solvency Showdown
The Altman Z-Score gap exposes a clear solvency divergence between Fiserv and Genpact:
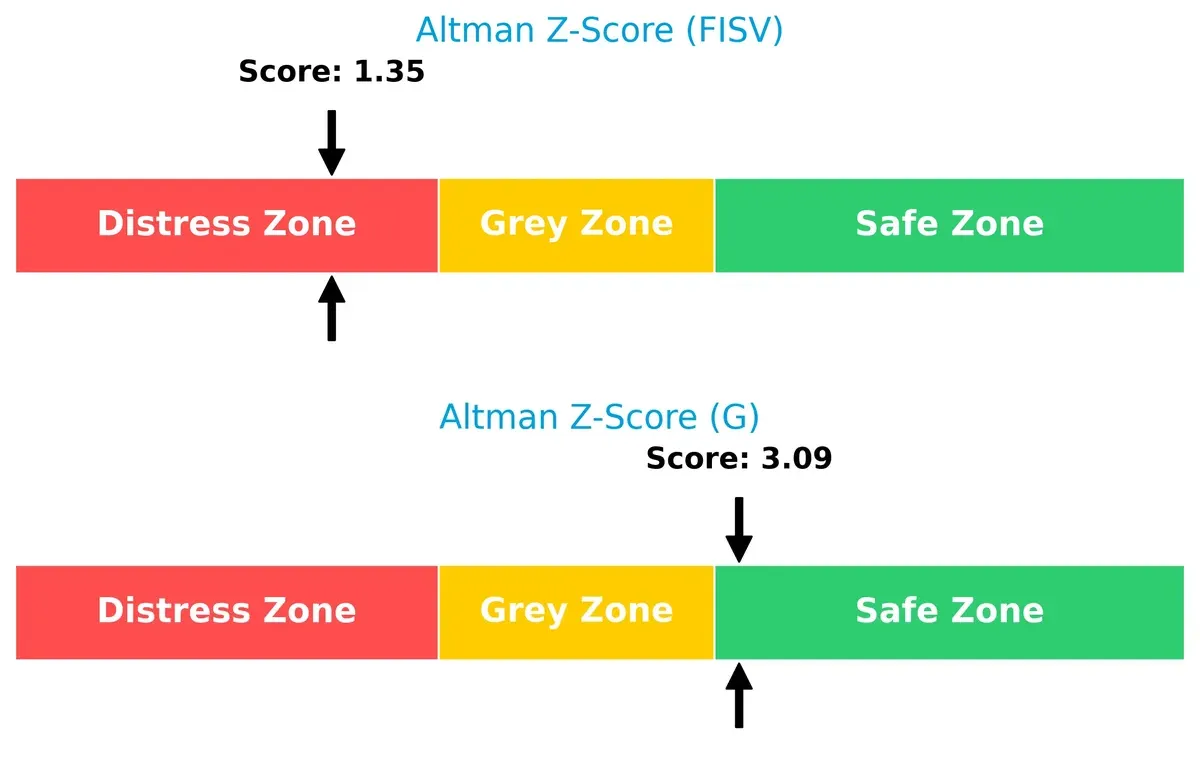
Fiserv’s Z-Score of 1.35 places it in the distress zone, signaling a high bankruptcy risk in this market cycle. Conversely, Genpact’s score of 3.09 situates it safely above distress thresholds, reflecting a robust buffer against financial distress. This contrast highlights Genpact’s superior long-term survival prospects amid economic fluctuations.
Financial Health: Quality of Operations
Piotroski F-Scores illustrate the operational quality and internal financial robustness of both firms:
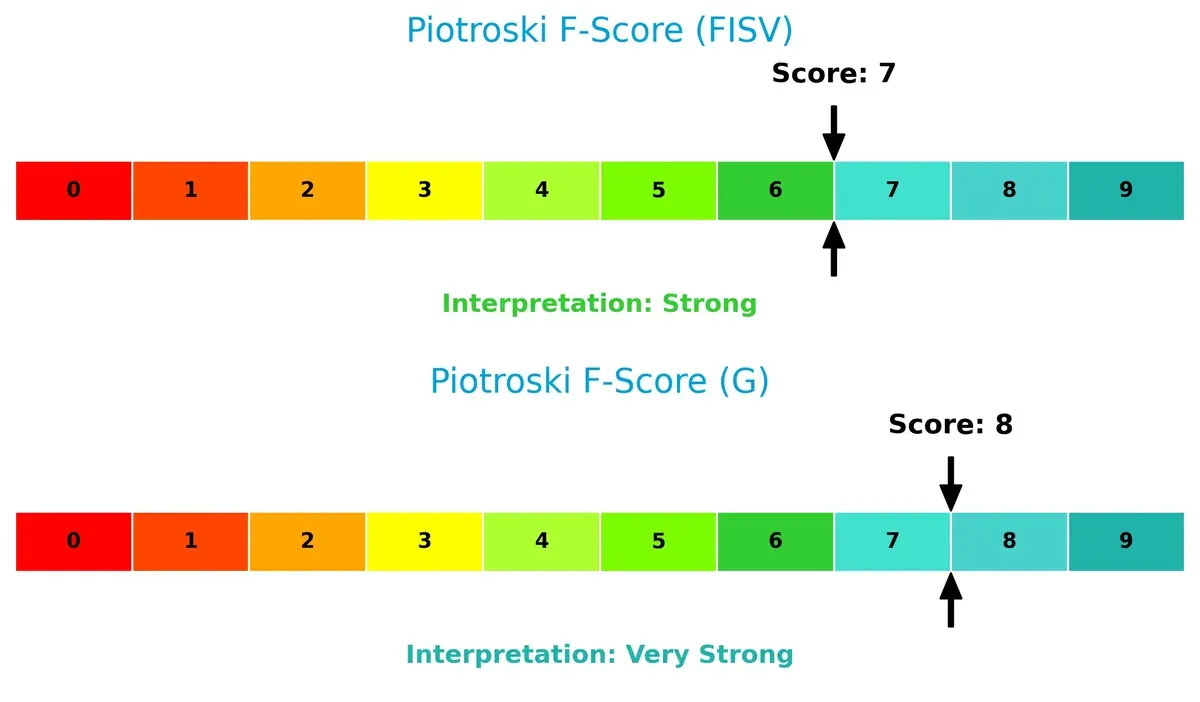
Genpact’s score of 8 indicates very strong financial health, reflecting solid profitability, liquidity, and efficiency metrics. Fiserv, with a score of 7, is strong but shows slightly more internal risk signals. While neither firm raises immediate red flags, Genpact’s internal financial quality appears more resilient and well-managed.
How are the two companies positioned?
This section dissects FISV and G’s operational DNA by comparing their revenue distribution and internal strengths and weaknesses. The goal is to confront their economic moats to reveal which model offers the most resilient, sustainable competitive advantage today.
Revenue Segmentation: The Strategic Mix
This comparison dissects how Fiserv, Inc. and Genpact Limited diversify their income streams and reveals where their primary sector bets lie:
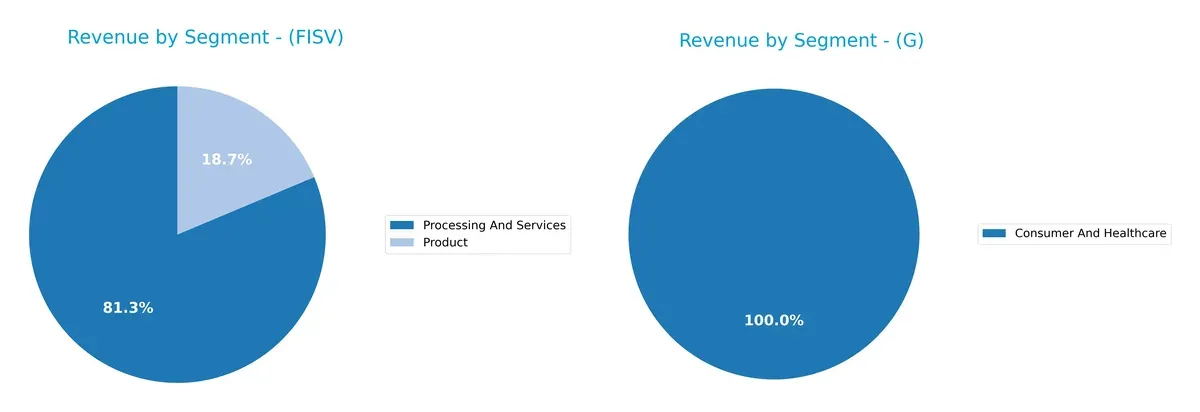
Fiserv anchors its revenue heavily in “Processing And Services” with $16.6B, while its secondary “Product” segment lags at $3.8B. This concentration signals a strong infrastructure dominance but also a potential risk if processing dynamics shift. Genpact, by contrast, shows a more diversified footprint in 2024, with $1.7B from its “Consumer And Healthcare” segment alone, reflecting a broader service mix and less dependency on a single domain.
Strengths and Weaknesses Comparison
This table compares the Strengths and Weaknesses of Fiserv, Inc. and Genpact Limited:
Fiserv Strengths
- Strong processing and services revenue of $16.6B
- Favorable net margin at 15.31%
- Favorable quick ratio at 1.06
- Favorable fixed asset turnover at 8.62
- Neutral debt levels with 32.34% debt to assets
Genpact Strengths
- Diverse segments including consumer, healthcare, and financial services
- Favorable ROE at 21.67% and ROIC at 12.32%
- Strong liquidity with current and quick ratios at 1.66
- Low debt ratio at 9.91% and high interest coverage of 15.72
- Significant global presence including India and Americas
Fiserv Weaknesses
- Unfavorable P/E at 37.97 and P/B at 4.39
- Unfavorable asset turnover at 0.27
- No dividend yield
- Neutral ROE and ROIC indicate moderate profitability
- Limited recent geographic revenue detail beyond 2020
Genpact Weaknesses
- Unfavorable P/B ratio at 3.19
- Moderate net margin at 10.88% lower than Fiserv
- Neutral dividend yield at 1.45%
- Asset turnover neutral at 0.87
- Concentrated revenue in India may pose regional risk
Both companies show distinct financial profiles. Fiserv excels in processing scale and some liquidity metrics but faces valuation and asset efficiency challenges. Genpact offers stronger profitability ratios and better leverage management but has regional concentration and valuation concerns. These contrasts frame strategic priorities differently for each firm.
The Moat Duel: Analyzing Competitive Defensibility
A structural moat is the only thing protecting long-term profits from the erosion of competition. Let’s dissect how these two firms defend their turf:
Fiserv, Inc.: Intangible Assets and Network Effects Powerhouse
Fiserv’s moat hinges on its integrated payments platform and strong network effects, reflected in a robust 28% EBIT margin and growing ROIC. Expansion into digital commerce deepens this advantage in 2026.
Genpact Limited: Cost Advantage with Scale and Process Expertise
Genpact relies on operational scale and process outsourcing efficiencies, showing a solid 15% EBIT margin and improving ROIC, though lower than Fiserv’s. Its focus on ESG and automation offers growth avenues amid competitive pressures.
Economic Moats Clash: Intangibles vs. Cost Leadership
Fiserv’s deeper moat stems from higher ROIC spread (2.7% above WACC) and accelerating profitability. Genpact’s cost-driven moat is wide but less defensible long term. Fiserv is better positioned to sustain market share against rising competition.
Which stock offers better returns?
Over the past 12 months, Fiserv, Inc. experienced a sharp decline with accelerating losses, while Genpact Limited showed steady gains despite recent deceleration and short-term weakness.
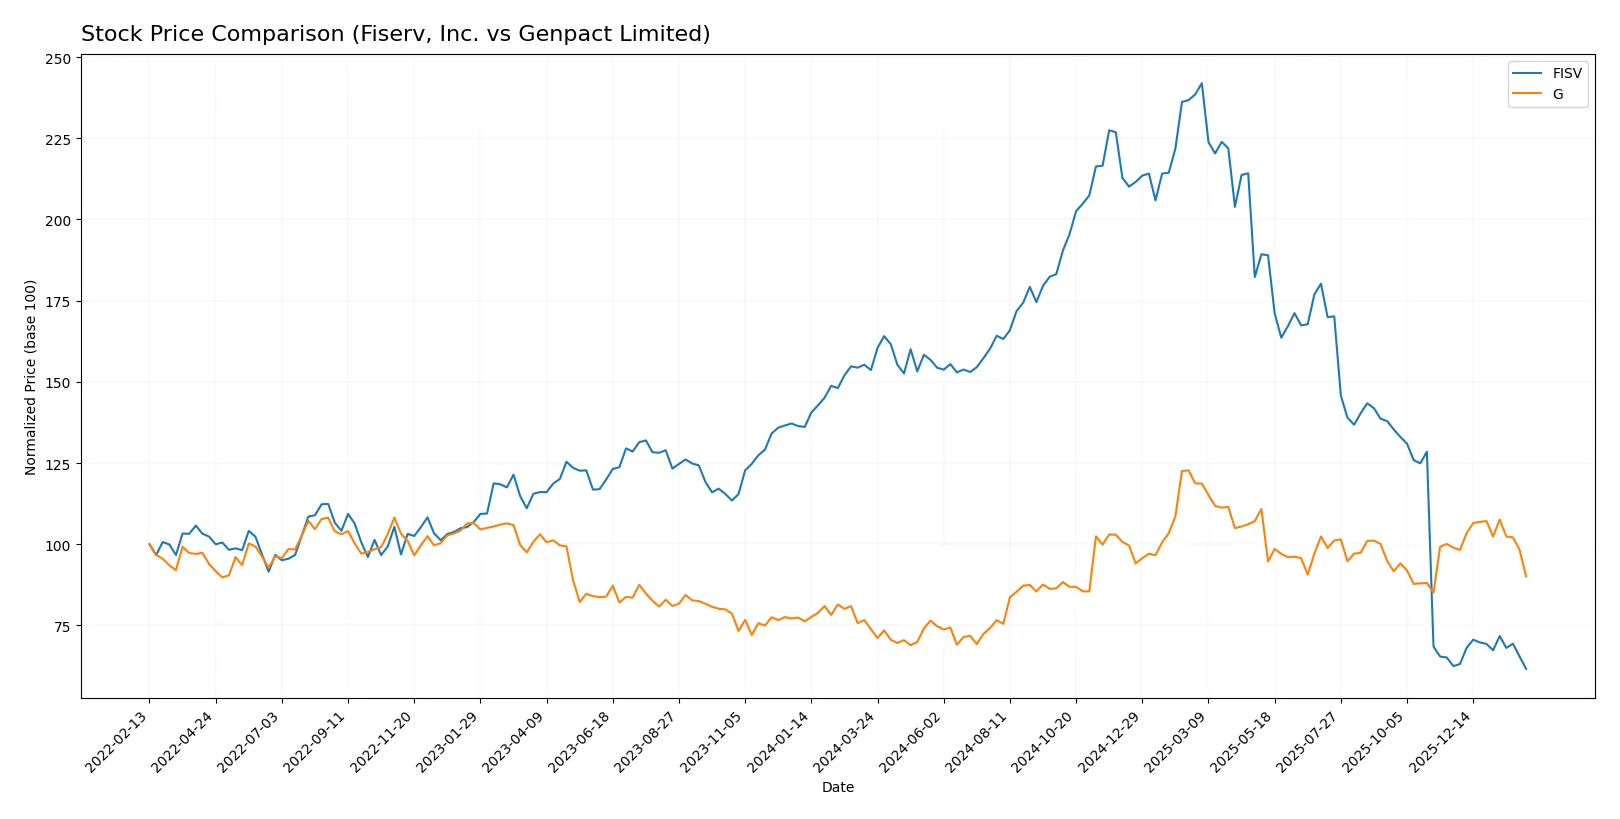
Trend Comparison
Fiserv’s stock fell 59.9% over the last year, marking a bearish trend with accelerating decline. It hit a high of 235.69 and a low of 60.0, with volatility peaking at a 47.89 standard deviation.
Genpact’s stock rose 21.95% over the same period, signaling a bullish trend with decelerating gains. The price ranged from 30.9 to 55.05, accompanied by low volatility (6.04 std deviation).
Genpact outperformed Fiserv by a wide margin in market returns over the year, despite both stocks showing recent downward pressure.
Target Prices
Analysts present a mixed but cautiously optimistic consensus on Fiserv, Inc. and Genpact Limited.
| Company | Target Low | Target High | Consensus |
|---|---|---|---|
| Fiserv, Inc. | 62 | 180 | 105.61 |
| Genpact Limited | 42 | 50 | 46 |
Fiserv’s target consensus at 105.61 suggests significant upside from its current 60, reflecting expectations of a rebound. Genpact’s consensus near 46 slightly exceeds its 40.39 price, indicating moderate growth anticipation.

Don’t Let Luck Decide Your Entry Point
Optimize your entry points with our advanced ProRealTime indicators. You’ll get efficient buy signals with precise price targets for maximum performance. Start outperforming now!
How do institutions grade them?
Fiserv, Inc. Grades
Here are recent institutional grades for Fiserv, Inc.:
| Grading Company | Action | New Grade | Date |
|---|---|---|---|
| Tigress Financial | maintain | Buy | 2025-12-31 |
| Mizuho | maintain | Outperform | 2025-12-22 |
| Keefe, Bruyette & Woods | maintain | Outperform | 2025-10-30 |
| Bernstein | downgrade | Market Perform | 2025-10-30 |
| Argus Research | downgrade | Hold | 2025-10-30 |
| RBC Capital | maintain | Outperform | 2025-10-30 |
| Keybanc | downgrade | Sector Weight | 2025-10-30 |
| Truist Securities | downgrade | Hold | 2025-10-30 |
| Citigroup | maintain | Neutral | 2025-10-30 |
| UBS | downgrade | Neutral | 2025-10-30 |
Genpact Limited Grades
Below are the latest institutional grades for Genpact Limited:
| Grading Company | Action | New Grade | Date |
|---|---|---|---|
| Needham | maintain | Buy | 2026-02-06 |
| JP Morgan | maintain | Neutral | 2025-08-20 |
| Needham | maintain | Buy | 2025-08-08 |
| Mizuho | maintain | Neutral | 2025-07-01 |
| Needham | maintain | Buy | 2025-06-30 |
| TD Cowen | maintain | Buy | 2025-06-27 |
| Baird | maintain | Neutral | 2025-05-08 |
| Needham | maintain | Buy | 2025-05-08 |
| Mizuho | maintain | Neutral | 2025-02-10 |
| Needham | maintain | Buy | 2025-02-07 |
Which company has the best grades?
Genpact consistently earns “Buy” ratings from Needham and others, showing steady institutional support. Fiserv’s grades vary more, with several downgrades and mixed ratings. Investors may view Genpact’s steadier buy consensus as a clearer vote of confidence.
Risks specific to each company
The following categories identify critical pressure points and systemic threats facing both firms in the 2026 market environment:
1. Market & Competition
Fiserv, Inc.
- Faces intense competition in fintech and payment solutions, with pressure from agile startups and large incumbents.
Genpact Limited
- Operates in a crowded BPO and IT services market, challenged by automation trends and pricing pressures.
2. Capital Structure & Debt
Fiserv, Inc.
- Debt-to-equity near 0.92 signals moderate leverage, raising financial risk amid rising rates.
Genpact Limited
- Low debt-to-equity of 0.23 indicates conservative borrowing, enhancing balance sheet stability.
3. Stock Volatility
Fiserv, Inc.
- Beta of 0.78 shows below-market volatility, offering relative stability for investors.
Genpact Limited
- Beta at 0.74 also reflects lower volatility, appealing to risk-averse holders.
4. Regulatory & Legal
Fiserv, Inc.
- Subject to stringent financial services regulations and cybersecurity standards in the US.
Genpact Limited
- Faces compliance challenges across multiple jurisdictions, especially in data privacy and outsourcing laws.
5. Supply Chain & Operations
Fiserv, Inc.
- Relies on technology partners and cloud infrastructure; any disruption could impair service delivery.
Genpact Limited
- Extensive global delivery centers expose it to operational risks from geopolitical and labor market shifts.
6. ESG & Climate Transition
Fiserv, Inc.
- Limited visible ESG initiatives; potential reputational risk as clients demand stronger sustainability credentials.
Genpact Limited
- Active ESG services offering positions it well but also exposes it to execution risk in evolving frameworks.
7. Geopolitical Exposure
Fiserv, Inc.
- Primarily US-focused, limiting geopolitical risk but also growth opportunities abroad.
Genpact Limited
- Global footprint subjects it to currency fluctuations, trade tensions, and regional instability.
Which company shows a better risk-adjusted profile?
Genpact’s low leverage and strong Altman Z-Score place it in a safer financial zone compared to Fiserv’s distress-level metrics. Fiserv’s market pressure and debt load elevate its risk profile despite stable stock volatility. Genpact’s broader geographic exposure is offset by superior financial health and ESG positioning. Recent ratio trends confirm Genpact’s robust capital structure and operational resilience, justifying greater risk tolerance on its stock.
Final Verdict: Which stock to choose?
Fiserv, Inc. impresses with its superpower of delivering strong free cash flow and a very favorable economic moat, signaling efficient capital use and value creation. Its point of vigilance lies in the relatively high valuation multiples and a current ratio that suggests limited liquidity buffer. It suits investors targeting aggressive growth with tolerance for valuation risk.
Genpact Limited’s strategic moat is rooted in robust operational returns and a safer balance sheet, evidenced by low debt and a solid Altman Z-score. Its valuation appears more reasonable, offering a blend of growth with financial stability. This stock fits well within a GARP (Growth at a Reasonable Price) portfolio seeking balanced risk and reward.
If you prioritize aggressive growth and can accept valuation premiums, Fiserv outshines with higher profitability and cash flow generation potential. However, if you seek better stability and a more conservative risk profile, Genpact offers superior balance sheet strength and a compelling margin of safety. Each company appeals to distinct investor avatars, so alignment with your risk tolerance is key.
Disclaimer: Investment carries a risk of loss of initial capital. The past performance is not a reliable indicator of future results. Be sure to understand risks before making an investment decision.
Go Further
I encourage you to read the complete analyses of Fiserv, Inc. and Genpact Limited to enhance your investment decisions: