Home > Comparison > Technology > FISV vs IT
The strategic rivalry between Fiserv, Inc. and Gartner, Inc. shapes the trajectory of the technology services sector. Fiserv operates as a capital-intensive payment and financial technology provider, while Gartner delivers high-margin research and advisory services. This analysis pits Fiserv’s scale and infrastructure against Gartner’s intellectual capital and subscription model. I aim to determine which company offers superior risk-adjusted returns for a diversified portfolio in this evolving market landscape.
Table of contents
Companies Overview
Fiserv and Gartner both dominate key niches in the Information Technology Services sector with distinct service models and client bases.
Fiserv, Inc.: Global Payment and Financial Technology Leader
Fiserv is a leading provider of payment and financial services technology worldwide. It generates revenue through three core segments: Acceptance, Fintech, and Payments, offering solutions such as point-of-sale platforms, digital banking, and card transaction processing. In 2026, Fiserv’s strategic focus remains on expanding its omnichannel commerce solutions and strengthening partnerships with financial institutions and software vendors.
Gartner, Inc.: Premier Research and Advisory Powerhouse
Gartner operates primarily as a research and advisory company, serving global clients through subscription-based research, conferences, and consulting services. Its revenue engine centers on delivering actionable insights and customized IT solutions to optimize digital transformation and IT sourcing. The company’s 2026 strategy emphasizes expanding its consulting footprint and enhancing data-driven decision support for enterprise clients.
Strategic Collision: Similarities & Divergences
Fiserv and Gartner both serve the technology sector but take radically different approaches: Fiserv focuses on transaction processing and fintech infrastructure, while Gartner excels in knowledge services and strategic advisory. Their main battleground lies in influencing enterprise IT decisions—Fiserv via technology deployment, Gartner through thought leadership. Investors will find Fiserv offers asset-heavy operational scale, whereas Gartner provides a scalable, subscription-driven model with high margin potential.
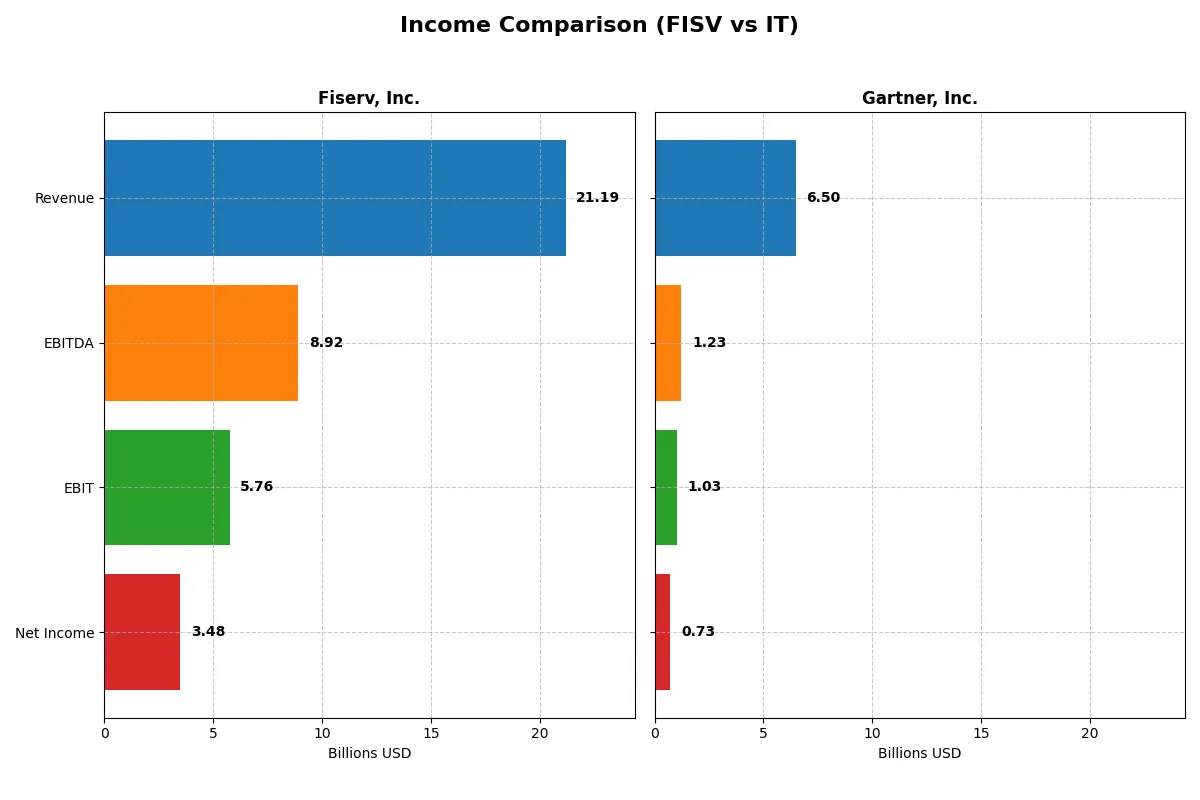
Income Statement Comparison
The following data dissects the core profitability and scalability of both corporate engines to reveal who dominates the bottom line:
| Metric | Fiserv, Inc. (FISV) | Gartner, Inc. (IT) |
|---|---|---|
| Revenue | 21.2B | 6.5B |
| Cost of Revenue | 8.6B | 2.1B |
| Operating Expenses | 6.9B | 3.4B |
| Gross Profit | 12.6B | 4.4B |
| EBITDA | 8.9B | 1.2B |
| EBIT | 5.8B | 1.0B |
| Interest Expense | 1.5B | 61M |
| Net Income | 3.5B | 729M |
| EPS | 6.34 | 9.68 |
| Fiscal Year | 2025 | 2025 |
Income Statement Analysis: The Bottom-Line Duel
This income statement comparison will reveal which company runs the more efficient and profitable corporate engine in 2025.
Fiserv, Inc. Analysis
Fiserv’s revenue climbs steadily from $16.2B in 2021 to $21.2B in 2025, with net income surging from $1.3B to $3.5B. The company sustains strong gross margins around 59%, while net margins expand to 16.4%, signaling improving profitability and operational control. In 2025, Fiserv’s EPS jumps 17.8%, reflecting solid momentum and disciplined capital allocation.
Gartner, Inc. Analysis
Gartner grows revenue from $4.7B in 2021 to $6.5B in 2025, a commendable top-line advance. Gross margin stands robust at 67.7%, but net margin compresses to 11.2% due to rising expenses. Notably, EBIT and net margin fall sharply in 2025, dragging EPS down nearly 40%. This signals margin pressure and declining bottom-line efficiency despite revenue growth.
Margin Strength vs. Earnings Momentum
Fiserv outpaces Gartner in profitability and earnings growth. Its superior net margin and nearly 161% net income growth over five years highlight operational excellence. Gartner’s top-line gains are undermined by margin erosion and a net income decline. For investors focused on durable earnings power, Fiserv’s profile offers clearer fundamental strength and momentum.
Financial Ratios Comparison
These vital ratios act as a diagnostic tool to expose the underlying fiscal health, valuation premiums, and capital efficiency of the companies compared below:
| Ratios | Fiserv, Inc. (FISV) | Gartner, Inc. (IT) |
|---|---|---|
| ROE | 13.5% | 227.9% |
| ROIC | 8.0% | 19.2% |
| P/E | 10.6x | 24.9x |
| P/B | 1.43x | 56.8x |
| Current Ratio | 1.03 | 1.00 |
| Quick Ratio | 1.03 | 1.00 |
| D/E | 1.12 | 0.86 |
| Debt-to-Assets | 36.2% | 3.4% |
| Interest Coverage | 3.82 | 16.93 |
| Asset Turnover | 0.26 | 0.80 |
| Fixed Asset Turnover | 6.87 | 15.17 |
| Payout Ratio | 0% | 0% |
| Dividend Yield | 0% | 0% |
| Fiscal Year | 2025 | 2025 |
Efficiency & Valuation Duel: The Vital Signs
Financial ratios serve as a company’s DNA, exposing hidden risks and revealing operational excellence beneath surface numbers.
Fiserv, Inc.
Fiserv delivers a solid 13.5% ROE with a favorable 16.4% net margin, signaling decent profitability. Its P/E of 10.6 and P/B of 1.43 suggest the stock trades at a reasonable valuation. Despite no dividend payout, Fiserv reinvests earnings to sustain growth, though its debt-to-equity ratio of 1.12 flags leverage risks.
Gartner, Inc.
Gartner impresses with a stellar 228% ROE and 19.2% ROIC, reflecting exceptional capital efficiency. Its P/E near 25 marks a stretched valuation, compounded by an elevated P/B of 56.8. The company pays no dividends, instead allocating heavily to R&D, fueling innovation and long-term growth potential despite slightly weaker liquidity metrics.
Premium Valuation vs. Operational Safety
Fiserv offers balanced valuation and steady returns with manageable risks, while Gartner boasts superior profitability but at a premium price and higher valuation multiples. Investors seeking growth and innovation may prefer Gartner’s profile. Those prioritizing valuation discipline and leverage control might find Fiserv better suited.
Which one offers the Superior Shareholder Reward?
I see Fiserv and Gartner both avoid dividends, focusing on reinvestment and buybacks. Fiserv’s payout ratio is zero, yet its free cash flow per share hits 11.0, supporting consistent buybacks. Gartner’s free cash flow per share is even stronger at 16.3, with buybacks fueling shareholder value. Fiserv trades at a modest P/FCF of 6.1, signaling undervaluation. Gartner’s valuation is richer, at 15.5 P/FCF, reflecting growth expectations. Gartner’s higher operating margins and cash per share (24.0 vs. 1.5) show operational strength and ample liquidity. However, its extreme leverage and sky-high price-to-book ratio (56.8) raise sustainability concerns. Fiserv’s conservative leverage and reasonable valuation offer a steadier model. For 2026, I favor Fiserv’s balanced buyback-driven approach as the superior total return opportunity, blending value and growth with manageable risks.
Comparative Score Analysis: The Strategic Profile
The radar chart reveals the fundamental DNA and trade-offs of Fiserv, Inc. and Gartner, Inc., highlighting their financial strengths and vulnerabilities:
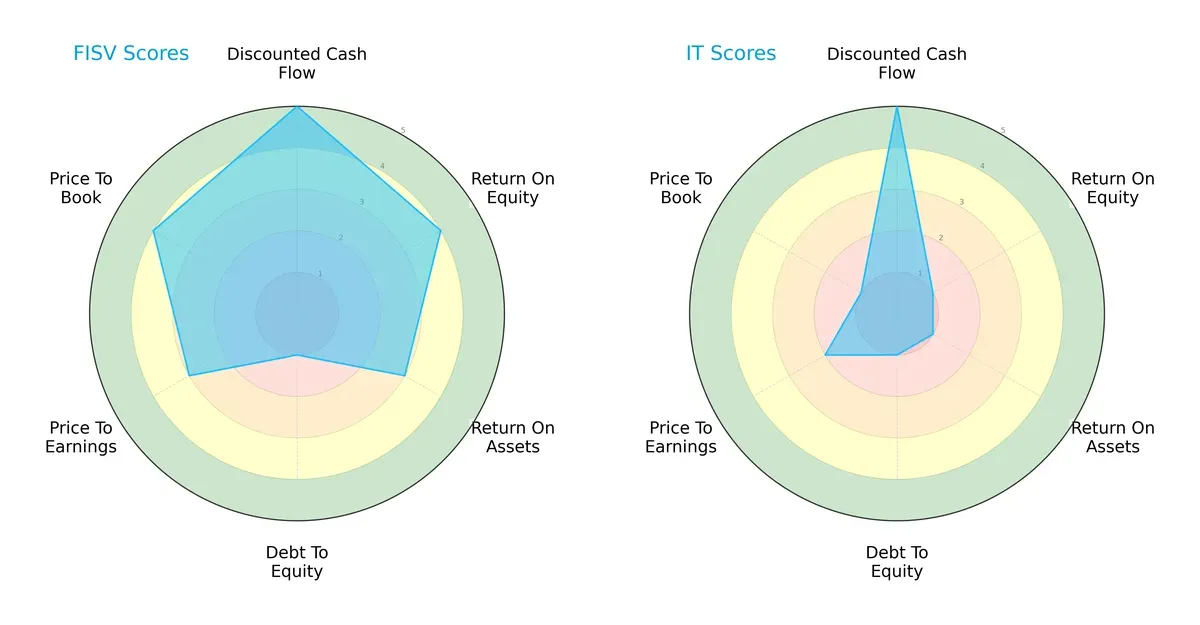
Fiserv demonstrates a more balanced profile with favorable DCF, ROE, and price-to-book scores, while its debt-to-equity score signals financial leverage risks. Gartner relies heavily on a strong DCF score but suffers from weak profitability and valuation metrics, indicating a less stable financial footing.
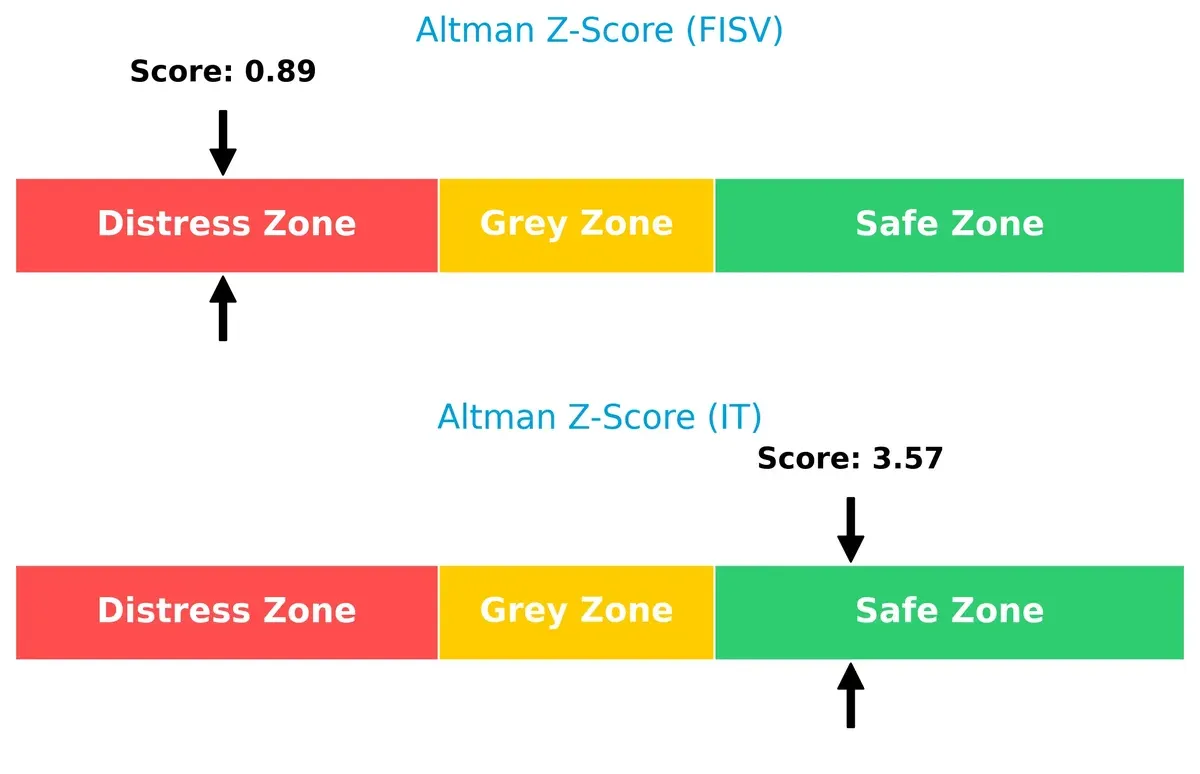
Bankruptcy Risk: Solvency Showdown
The Altman Z-Score gap reveals a stark contrast: Gartner stands safely above 3, signaling strong long-term survival prospects; Fiserv, however, sits deep in distress territory below 1.8, raising red flags about its financial resilience:
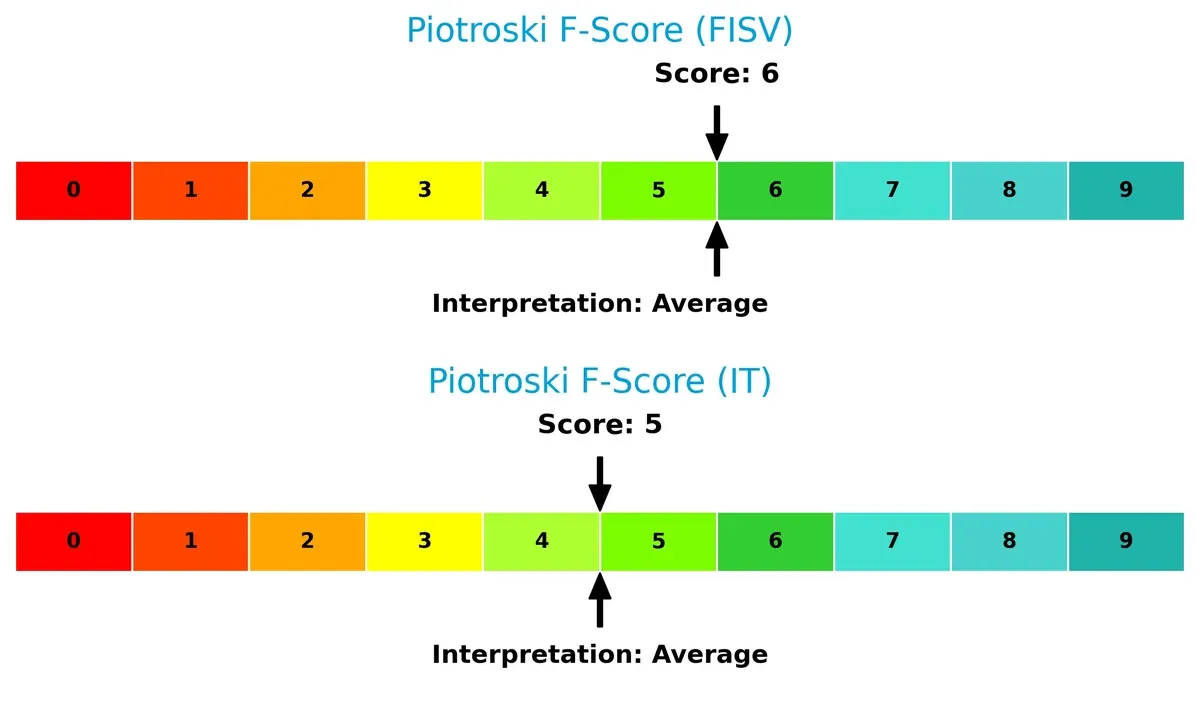
Financial Health: Quality of Operations
Fiserv and Gartner both show average Piotroski F-Scores (6 and 5, respectively), suggesting moderate operational quality. Neither company signals severe internal red flags, but both have room to improve financial robustness:
How are the two companies positioned?
This section dissects the operational DNA of Fiserv and Gartner by comparing their revenue distribution and internal dynamics. The goal is to confront their economic moats and identify which model offers the most resilient competitive advantage today.
Revenue Segmentation: The Strategic Mix
This visual comparison dissects how Fiserv, Inc. and Gartner, Inc. diversify their income streams and where their primary sector bets lie:
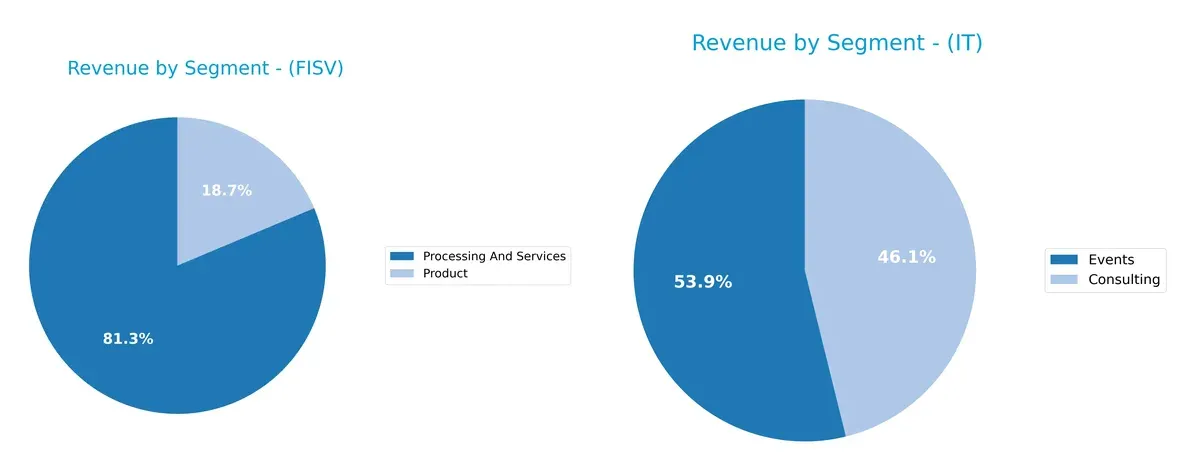
Fiserv anchors its revenue with a dominant Processing And Services segment at $16.6B in 2024, dwarfing its $3.8B Product segment. Gartner, by contrast, pivots on a highly concentrated Research Segment at $5.1B, with Consulting and Events trailing around $0.56B and $0.58B respectively. Fiserv’s broader operational mix reduces concentration risk, while Gartner’s reliance on research revenue underscores its ecosystem lock-in but raises dependency concerns.
Strengths and Weaknesses Comparison
This table compares the Strengths and Weaknesses of Fiserv, Inc. and Gartner, Inc.:
Fiserv Strengths
- Diversified revenue across processing, services, and fintech segments
- Favorable net margin at 16.42%
- Favorable WACC at 5.78% supports capital efficiency
- Strong fixed asset turnover at 6.87
- Global presence including US, EMEA, Asia Pacific
- Reasonable valuation metrics with PE at 10.6 and PB at 1.43
Gartner Strengths
- High profitability with ROE at 227.93% and ROIC at 19.23%
- Favorable interest coverage at 16.98 indicates strong debt servicing
- Leading fixed asset turnover at 15.17
- Low debt-to-assets ratio at 3.4% reduces financial risk
- Significant global revenue from US, EMEA, and other international markets
- Solid market presence in consulting, events, and research segments
Fiserv Weaknesses
- Elevated debt-to-equity ratio of 1.12 signals leverage risk
- Unfavorable asset turnover at 0.26 may limit operational efficiency
- No dividend yield may deter income-focused investors
- Neutral ROE and ROIC suggest moderate capital returns
- Current ratio near 1.03 is barely sufficient liquidity
- Market concentration in processing and services limits diversification
Gartner Weaknesses
- Unfavorable high PB ratio at 56.78 may imply overvaluation risk
- Current ratio at 1.0 signals tight short-term liquidity
- Neutral to unfavorable valuation with PE at 24.91
- No dividend yield reduces appeal for income investors
- Asset turnover at 0.8 is moderate, indicating average efficiency
- Heavy reliance on research segment may concentrate revenue risk
Fiserv shows strengths in diversified revenue streams and efficient capital costs but faces leverage and asset efficiency challenges. Gartner excels in profitability and debt management, offset by valuation concerns and liquidity tightness. Each company’s financial profile suggests distinct strategic priorities.
The Moat Duel: Analyzing Competitive Defensibility
A structural moat is the only reliable shield protecting long-term profits from relentless competition erosion. Let’s break down the competitive moats of two tech leaders:
Fiserv, Inc.: Switching Costs Powerhouse
Fiserv leverages high switching costs with integrated payment platforms, sustaining margin stability and 27% EBIT. Expansion in digital commerce deepens its moat amid evolving fintech trends in 2026.
Gartner, Inc.: Intangible Asset Dominator
Gartner’s moat stems from intangible assets—exclusive research and brand authority. Despite lower margins than Fiserv, it commands high ROIC, with growth potential in consulting and global conferences disrupting IT advisory markets.
Competitive Moat Showdown: Switching Costs vs. Intangible Assets
Fiserv’s wider moat derives from sticky customer contracts and scalable tech, reflected in superior EBIT margins and accelerating ROIC growth. Gartner’s intangible assets offer a defensible niche but face margin pressure. Fiserv stands better poised to defend market share long term.
Which stock offers better returns?
Over the past year, both Fiserv, Inc. and Gartner, Inc. experienced sharp declines, with accelerating bearish trends and notable price volatility shaping their trading dynamics.
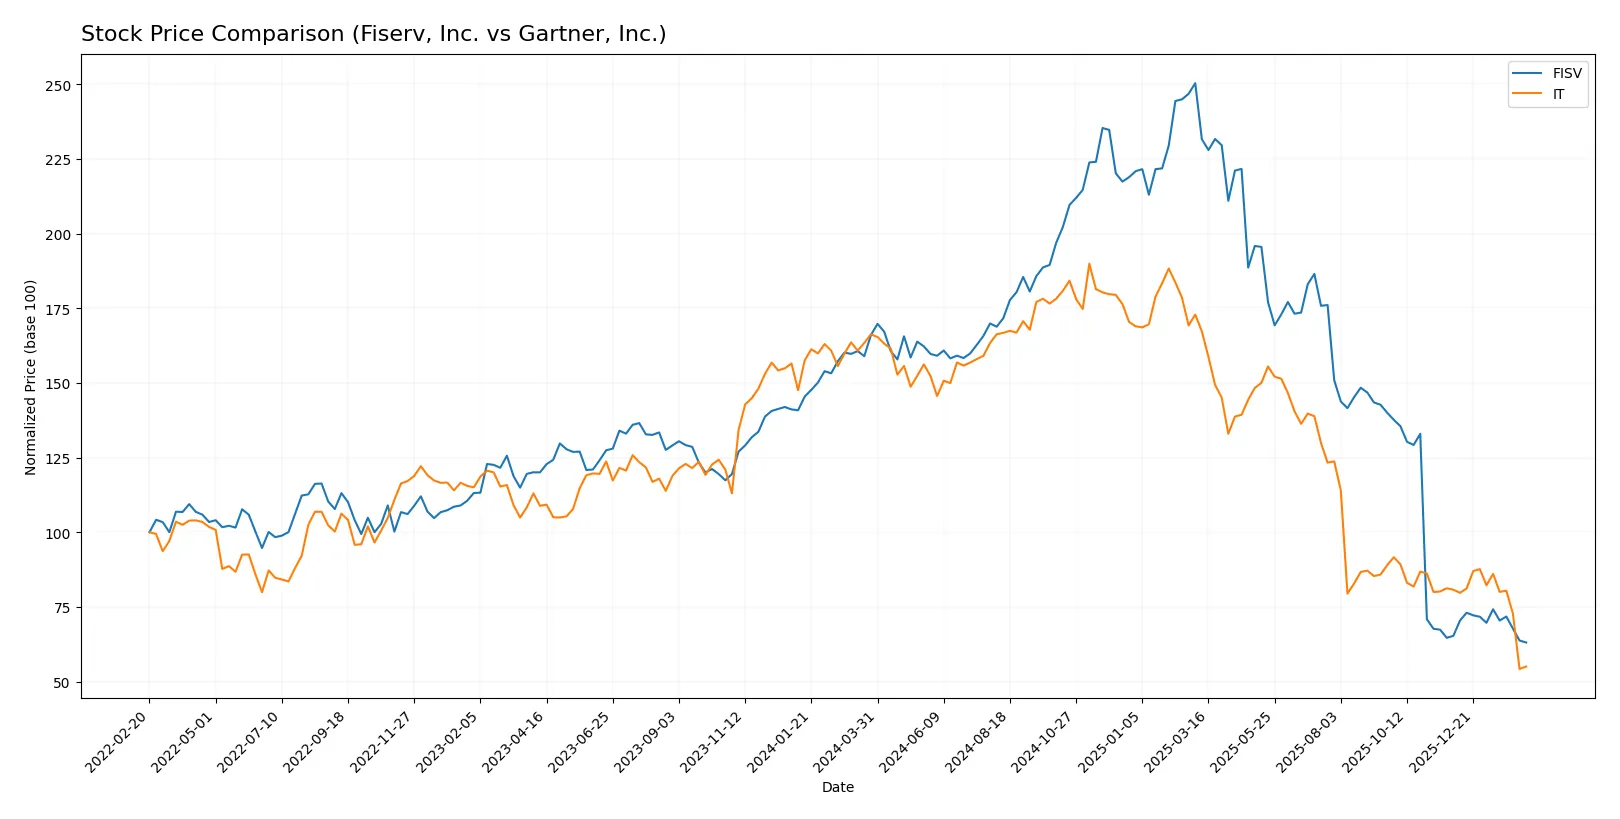
Trend Comparison
Fiserv, Inc. (FISV) shows a 62.02% price decline over 12 months, signaling an accelerating bearish trend. The stock fluctuated between $59.36 and $235.69, with recent modest continued weakness.
Gartner, Inc. (IT) dropped 66.92% over the same period, also bearish but with decelerating momentum. Price swings were wider, between $156.33 and $547.40, and recent losses accelerated sharply.
Both stocks posted significant declines, but Fiserv’s larger acceleration contrasts with Gartner’s higher volatility and deeper drawdown, placing Fiserv ahead in relative market stability.
Target Prices
Analysts present a wide but constructive target range for both Fiserv, Inc. and Gartner, Inc., signaling varied but generally positive expectations.
| Company | Target Low | Target High | Consensus |
|---|---|---|---|
| Fiserv, Inc. | 62 | 180 | 104.18 |
| Gartner, Inc. | 170 | 275 | 206.3 |
Fiserv’s consensus target stands substantially above its current price of 59.36, suggesting upside potential despite volatility. Gartner’s consensus target also exceeds its current 158.58 price, indicating expected growth aligned with its strong market position.

Don’t Let Luck Decide Your Entry Point
Optimize your entry points with our advanced ProRealTime indicators. You’ll get efficient buy signals with precise price targets for maximum performance. Start outperforming now!
How do institutions grade them?
This section summarizes recent institutional grades for Fiserv, Inc. and Gartner, Inc.:
Fiserv, Inc. Grades
Here are the latest grades assigned to Fiserv, Inc. by notable financial institutions:
| Grading Company | Action | New Grade | Date |
|---|---|---|---|
| Citigroup | Maintain | Neutral | 2026-02-11 |
| B. Riley Securities | Maintain | Neutral | 2026-02-11 |
| UBS | Maintain | Neutral | 2026-02-11 |
| Stephens & Co. | Maintain | Equal Weight | 2026-02-11 |
| Tigress Financial | Maintain | Buy | 2025-12-31 |
| Mizuho | Maintain | Outperform | 2025-12-22 |
| Morgan Stanley | Downgrade | Equal Weight | 2025-10-30 |
| JP Morgan | Maintain | Overweight | 2025-10-30 |
| RBC Capital | Maintain | Outperform | 2025-10-30 |
| Goldman Sachs | Downgrade | Neutral | 2025-10-30 |
Gartner, Inc. Grades
Below are recent grades given to Gartner, Inc. by respected grading firms:
| Grading Company | Action | New Grade | Date |
|---|---|---|---|
| Truist Securities | Maintain | Buy | 2026-02-06 |
| Barclays | Maintain | Equal Weight | 2026-02-05 |
| Morgan Stanley | Maintain | Equal Weight | 2026-02-04 |
| Wells Fargo | Maintain | Underweight | 2026-02-04 |
| UBS | Maintain | Neutral | 2026-01-09 |
| Morgan Stanley | Maintain | Equal Weight | 2025-12-17 |
| BMO Capital | Maintain | Market Perform | 2025-11-06 |
| UBS | Maintain | Neutral | 2025-11-05 |
| Goldman Sachs | Maintain | Buy | 2025-11-05 |
| Barclays | Maintain | Equal Weight | 2025-11-05 |
Which company has the best grades?
Fiserv, Inc. shows a mixed rating spectrum ranging from Buy to Neutral, with some recent downgrades. Gartner, Inc. mostly holds Buy to Equal Weight ratings, with a notable Underweight. Gartner’s grades lean slightly more positive overall. Investors might interpret this as Gartner enjoying steadier institutional confidence.
Risks specific to each company
The following categories identify the critical pressure points and systemic threats facing both firms in the 2026 market environment:
1. Market & Competition
Fiserv, Inc.
- Faces intense competition in payment tech and fintech sectors; needs innovation to maintain market share.
Gartner, Inc.
- Operates in research and advisory with strong niche, but high dependency on subscription renewals challenges growth.
2. Capital Structure & Debt
Fiserv, Inc.
- High debt-to-equity ratio (1.12) signals leveraged balance sheet; interest coverage moderate at 3.86x.
Gartner, Inc.
- Low debt-to-equity (0.86) and strong interest coverage (16.98x) indicate conservative capital structure.
3. Stock Volatility
Fiserv, Inc.
- Beta of 0.78 suggests lower volatility than market; stock range compressed recently (57.8-238.59).
Gartner, Inc.
- Beta around 1.04 shows market-level volatility; wider price range (139.18-517.06) indicates higher trading swings.
4. Regulatory & Legal
Fiserv, Inc.
- Payment sector faces ongoing compliance costs and cyber security regulations that can impact margins.
Gartner, Inc.
- Advisory and consulting face fewer regulatory burdens but must manage data privacy and intellectual property risks.
5. Supply Chain & Operations
Fiserv, Inc.
- Complex payment processing infrastructure vulnerable to operational disruptions and tech failures.
Gartner, Inc.
- Operations rely heavily on digital platforms and expert networks; relatively resilient but talent retention critical.
6. ESG & Climate Transition
Fiserv, Inc.
- ESG integration in fintech growing; risk from evolving standards and client expectations on sustainable finance.
Gartner, Inc.
- Increasing pressure to align advisory content and practices with ESG trends; opportunity and risk coexist.
7. Geopolitical Exposure
Fiserv, Inc.
- Operates worldwide; sensitive to global payment regulations and cross-border transaction restrictions.
Gartner, Inc.
- Global footprint exposes it to political risks, especially in emerging markets and trade tensions.
Which company shows a better risk-adjusted profile?
Fiserv’s primary risk lies in its leveraged capital structure, raising financial vulnerability despite stable market position. Gartner faces elevated valuation risk and regulatory challenges but maintains a safer balance sheet and stronger profitability metrics. Gartner’s Altman Z-Score in the safe zone contrasts with Fiserv’s distress zone, signaling better financial stability. However, Fiserv’s lower beta and moderate operational risks provide some risk mitigation. Overall, Gartner offers a superior risk-adjusted profile due to its conservative leverage, robust cash flow, and safer solvency metrics, despite valuation concerns.
Final Verdict: Which stock to choose?
Fiserv’s superpower lies in its ability to generate consistent cash flow and steadily improve profitability, demonstrating a robust economic moat. Its point of vigilance is the elevated leverage, which could pressure financial flexibility. It suits investors with an appetite for steady value creation in a mature growth setting.
Gartner’s strategic moat is its dominant position in high-value research and advisory services, delivering recurring revenue and strong returns on capital. It offers better balance sheet safety compared to Fiserv but trades at a premium with valuation concerns. It fits well in portfolios targeting GARP—growth at a reasonable price.
If you prioritize stable cash generation and improving profitability with manageable risk, Fiserv presents a compelling scenario due to its sustainable value creation. However, if you seek a resilient moat with recurring revenues and higher capital efficiency, Gartner offers better stability despite valuation challenges. Both remain slightly favorable but require careful monitoring of leverage and earnings trends.
Disclaimer: Investment carries a risk of loss of initial capital. The past performance is not a reliable indicator of future results. Be sure to understand risks before making an investment decision.
Go Further
I encourage you to read the complete analyses of Fiserv, Inc. and Gartner, Inc. to enhance your investment decisions: