Home > Comparison > Utilities > XEL vs FE
The strategic rivalry between Xcel Energy Inc. and FirstEnergy Corp. shapes the competitive landscape of the regulated electric utilities sector. Xcel Energy operates a diversified generation portfolio across multiple states, focusing on renewable integration. FirstEnergy emphasizes extensive transmission and distribution networks in densely populated regions. This analysis pits Xcel’s growth-oriented asset mix against FirstEnergy’s infrastructure scale to identify which offers superior risk-adjusted returns for diversified portfolios.
Table of contents
Companies Overview
Xcel Energy and FirstEnergy dominate the U.S. regulated electric utility sector with complementary regional footprints.
Xcel Energy Inc.: Diverse Energy Producer and Distributor
Xcel Energy operates as a regulated electric and natural gas utility, generating revenue by selling electricity and natural gas across eight states. Its diversified energy mix includes coal, nuclear, natural gas, hydro, solar, wind, and biomass. In 2026, Xcel focuses on expanding renewable generation and upgrading infrastructure to support sustainable energy delivery to 3.7M electric and 2.1M gas customers.
FirstEnergy Corp.: Transmission and Distribution Powerhouse
FirstEnergy primarily generates revenue through its regulated distribution and transmission segments, serving 6M customers in six states. It operates extensive transmission lines and various power plants including coal, nuclear, hydro, natural gas, wind, and solar. The company’s strategic emphasis in 2026 lies in maintaining grid reliability while integrating clean energy solutions to meet evolving regulatory standards.
Strategic Collision: Similarities & Divergences
Both companies operate within regulated electric utilities but diverge in scale and focus. Xcel emphasizes a balanced energy portfolio with growth in renewables. FirstEnergy prioritizes transmission and distribution network management with a larger customer base. They compete primarily for market share in Midwest and Mid-Atlantic regions. Xcel offers growth through clean energy, while FirstEnergy presents stability via infrastructure dominance.
Income Statement Comparison
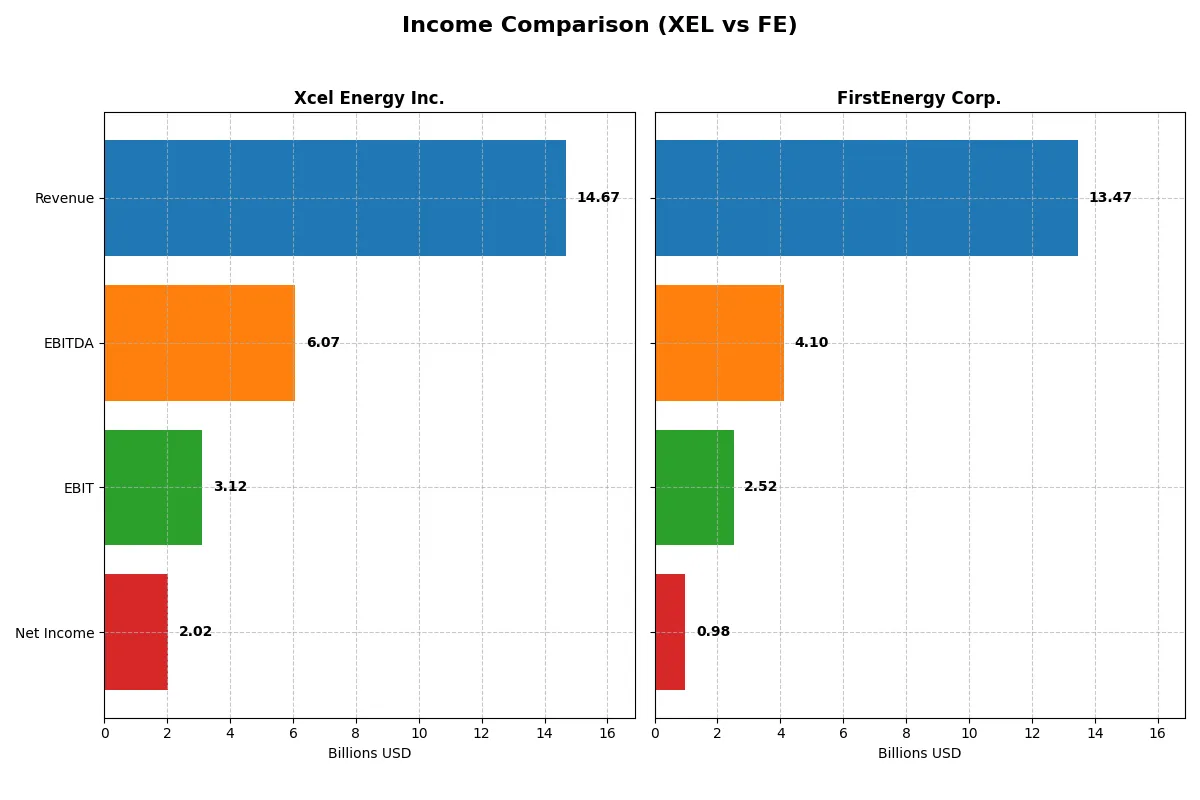
The following data dissects the core profitability and scalability of both corporate engines to reveal who dominates the bottom line:
| Metric | Xcel Energy Inc. (XEL) | FirstEnergy Corp. (FE) |
|---|---|---|
| Revenue | 14.7B | 13.5B |
| Cost of Revenue | 11.1B | 4.4B |
| Operating Expenses | 686M | 6.7B |
| Gross Profit | 3.6B | 9.1B |
| EBITDA | 6.1B | 4.1B |
| EBIT | 3.1B | 2.5B |
| Interest Expense | 1.3B | 1.0B |
| Net Income | 2.0B | 978M |
| EPS | 3.44 | 1.7 |
| Fiscal Year | 2025 | 2024 |
Income Statement Analysis: The Bottom-Line Duel
This income statement comparison reveals which company runs its business more efficiently, converting revenue into profits with greater precision.
Xcel Energy Inc. Analysis
Xcel Energy’s revenue rose steadily to $14.7B in 2025, with net income climbing to $2.0B. Its gross margin of 24.3% and net margin of 13.76% remain strong, reflecting disciplined cost control. Despite a one-year dip in gross profit growth, XEL’s EBIT growth at 14.7% signals robust operational momentum entering 2026.
FirstEnergy Corp. Analysis
FirstEnergy’s revenue grew modestly to $13.5B in 2024, but net income fell sharply to $978M. The company boasts a high gross margin of 67.5%, yet net margin lags at 7.26%. EBIT growth barely nudged 1%, while net margin contraction highlights inefficiencies that weigh on profitability and investor returns.
Margin Discipline vs. Revenue and Earnings Growth
Xcel Energy outpaces FirstEnergy on net income growth and margin expansion over the last five years. Though FirstEnergy’s gross margin impresses, its shrinking net margin and declining EPS undermine its appeal. Xcel’s consistent margin improvement and earnings momentum make it the clearer fundamental winner for investors focused on sustainable profitability.
Financial Ratios Comparison
These vital ratios act as a diagnostic tool to expose the underlying fiscal health, valuation premiums, and capital efficiency of each company:
| Ratios | Xcel Energy Inc. (XEL) | FirstEnergy Corp. (FE) |
|---|---|---|
| ROE | 9.9% | 7.9% |
| ROIC | 3.6% | 3.7% |
| P/E | 21.5 | 23.4 |
| P/B | 1.95 | 1.84 |
| Current Ratio | 0.67 | 0.56 |
| Quick Ratio | 0.57 | 0.45 |
| D/E (Debt-to-Equity) | 1.55 | 1.95 |
| Debt-to-Assets | 43.1% | 46.6% |
| Interest Coverage | 2.14 | 2.35 |
| Asset Turnover | 0.19 | 0.26 |
| Fixed Asset Turnover | 0.23 | 0.33 |
| Payout ratio | 82.2% | 99.2% |
| Dividend yield | 3.8% | 4.2% |
| Fiscal Year | 2025 | 2024 |
Efficiency & Valuation Duel: The Vital Signs
Financial ratios serve as a company’s DNA, exposing hidden risks and operational strengths essential for informed investment decisions.
Xcel Energy Inc.
Xcel Energy posts a solid net margin of 13.76%, signaling operational efficiency, though its ROE and ROIC are unfavorable. The stock trades at a neutral P/E of 21.48, neither cheap nor stretched. A healthy dividend yield of 3.83% rewards shareholders, balancing reinvestment with steady returns despite some liquidity concerns.
FirstEnergy Corp.
FirstEnergy shows a modest net margin of 7.26% and a lower ROE of 7.85%, indicating weaker profitability. Its P/E ratio of 23.39 suggests the stock is fairly valued but slightly pricier than Xcel. The company offers a higher dividend yield of 4.24%, yet faces higher leverage and liquidity risks, reflecting a more cautious financial posture.
Balanced Yield vs. Operational Efficiency
Xcel Energy offers better operational margins and a dependable dividend with moderate valuation, while FirstEnergy provides a higher yield but weaker profitability and riskier leverage. Investors prioritizing efficiency and stability may favor Xcel, whereas those seeking higher income might lean toward FirstEnergy’s profile.
Which one offers the Superior Shareholder Reward?
I see Xcel Energy (XEL) offers a 3.8% dividend yield with an 82% payout ratio, signaling strong FCF coverage despite some capital intensity. FirstEnergy (FE) yields 4.2% but pays out nearly all its earnings, risking sustainability. XEL’s moderate payout, backed by a steady buyback program, balances income and growth. FE’s aggressive dividend and weaker margins raise red flags. I conclude XEL delivers a more sustainable and attractive total return profile for 2026 investors.
Comparative Score Analysis: The Strategic Profile
The radar chart reveals the fundamental DNA and trade-offs of Xcel Energy Inc. and FirstEnergy Corp., highlighting their core financial strengths and vulnerabilities:
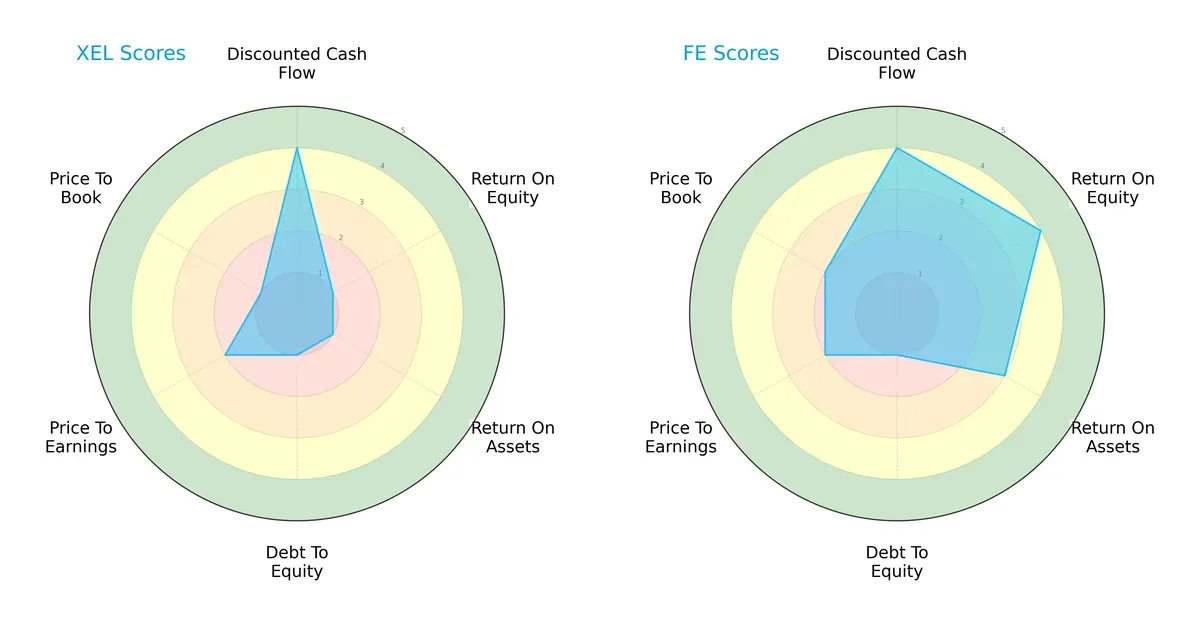
FirstEnergy shows a more balanced financial profile with strong ROE (4) and ROA (3) scores, signaling efficient profitability and asset use. Xcel Energy relies heavily on discounted cash flow strength (4) but suffers from weak profitability (ROE and ROA at 1) and leverage metrics (debt-to-equity at 1). Both firms face valuation challenges with unfavorable P/E and P/B scores, but FirstEnergy’s overall moderate score (3) trumps Xcel’s unfavorable (2), indicating it manages trade-offs better.
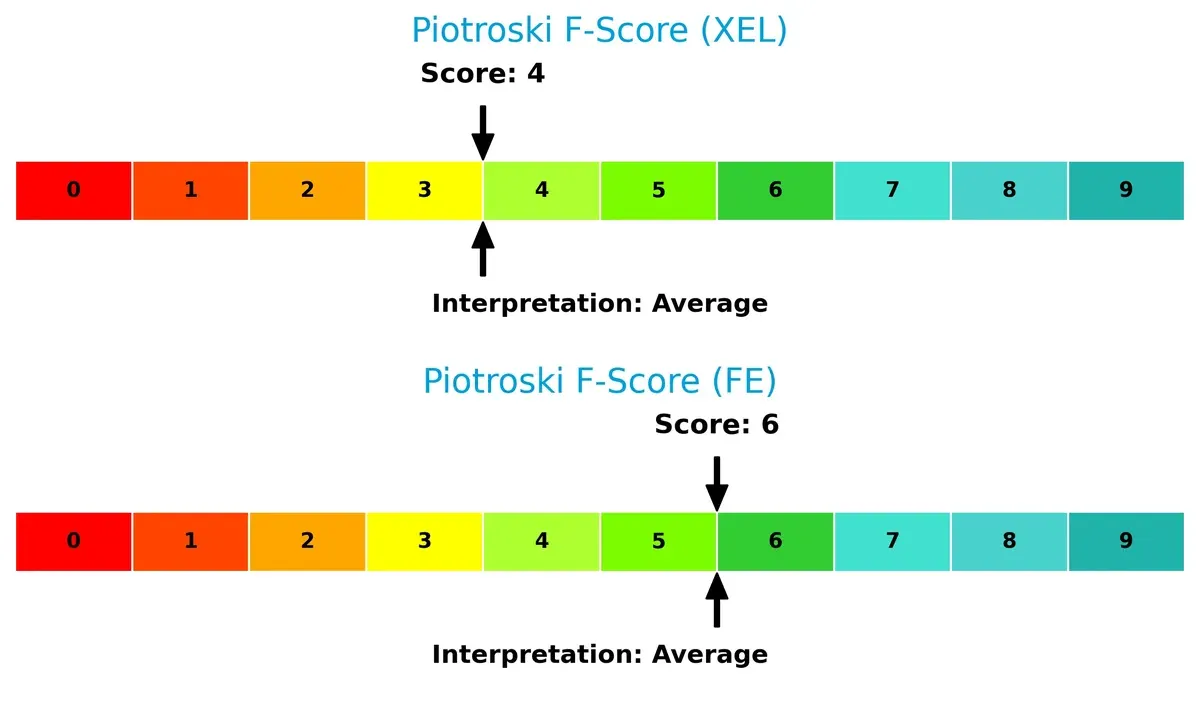
Financial Health: Quality of Operations
FirstEnergy scores a 6 on the Piotroski F-Score, compared to Xcel Energy’s 4, suggesting more robust internal financial health and operational quality. Neither firm is in peak condition, but Xcel’s lower score raises red flags about its financial stability and efficiency:
How are the two companies positioned?
This section dissects Xcel Energy’s and FirstEnergy’s operational DNA by comparing their revenue distribution and internal strengths and weaknesses. The goal is to confront their economic moats to determine which model offers the most resilient and sustainable competitive advantage today.
Revenue Segmentation: The Strategic Mix
This visual comparison dissects how Xcel Energy Inc. and FirstEnergy Corp. diversify their income streams and reveals their primary sector bets for 2024:
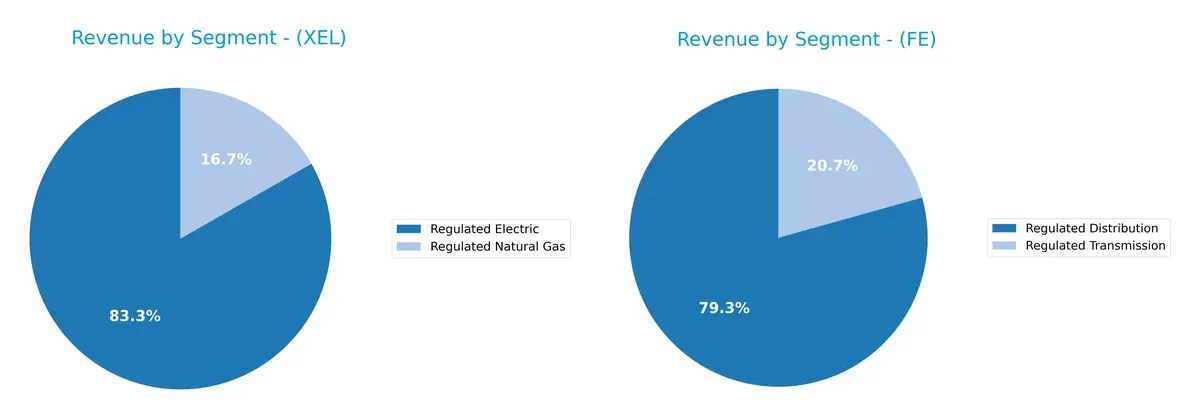
Xcel Energy anchors its revenue in Regulated Electric at $22.3B, with Regulated Natural Gas adding $4.5B, showcasing a balanced two-segment focus. FirstEnergy relies heavily on Regulated Distribution at $6.9B, with Regulated Transmission contributing $1.8B, indicating a narrower, infrastructure-heavy mix. Xcel’s diversification mitigates concentration risk, while FirstEnergy’s dominance in distribution suggests infrastructure lock-in but less sector variety.
Strengths and Weaknesses Comparison
This table compares the Strengths and Weaknesses of Xcel Energy Inc. and FirstEnergy Corp.:
Xcel Energy Inc. Strengths
- Higher net margin at 13.76%
- Favorable debt-to-equity and debt-to-assets ratios
- Dividend yield at 3.83% supports income investors
- Significant regulated electric revenue of 22.3B USD
- Favorable price-to-book ratio
FirstEnergy Corp. Strengths
- WACC at 4.88% indicates efficient capital cost management
- Dividend yield at 4.24% is attractive
- Larger diversification with competitive energy services segment
- Neutral price-to-earnings and price-to-book ratios
- Regulated distribution revenue around 6.9B USD
Xcel Energy Inc. Weaknesses
- Zero reported ROE and ROIC indicate operational challenges
- Unfavorable liquidity ratios (current and quick ratio at 0)
- Underperforming asset turnover ratios
- Slightly unfavorable overall ratio evaluation
FirstEnergy Corp. Weaknesses
- Lower net margin at 7.26%
- Unfavorable debt-to-equity at 1.95
- Unfavorable ROE and ROIC values
- Liquidity ratios below 1 (current 0.56, quick 0.45)
- Unfavorable asset turnover ratios
Both companies show slightly unfavorable overall ratio profiles, but Xcel excels in profitability and leverage metrics. FirstEnergy’s strengths lie in capital cost efficiency and revenue diversification, though liquidity and profitability remain concerns. These factors shape their operational and financial strategies differently.
The Moat Duel: Analyzing Competitive Defensibility
A structural moat is the sole shield protecting long-term profits from relentless competitive erosion. Let’s break down the moat dynamics for these utilities:
Xcel Energy Inc.: Diversified Regulated Utility Moat
Xcel’s moat stems from regulated utilities and stable customer base, reflected in solid EBIT margins around 21%. Expansion in renewables in 2026 could deepen regulatory goodwill but margin pressures loom.
FirstEnergy Corp.: Transmission & Distribution Network Moat
FirstEnergy leverages its vast grid infrastructure as a high barrier to entry. However, shrinking ROIC and value destruction signal weakening competitive positioning amid rising operational costs.
Network Stability vs. Regulatory Resilience
Xcel’s broader regulatory footprint and favorable income metrics suggest a wider moat compared to FirstEnergy’s eroding returns. Xcel stands better poised to defend market share through renewables and regulatory relationships.
Which stock offers better returns?
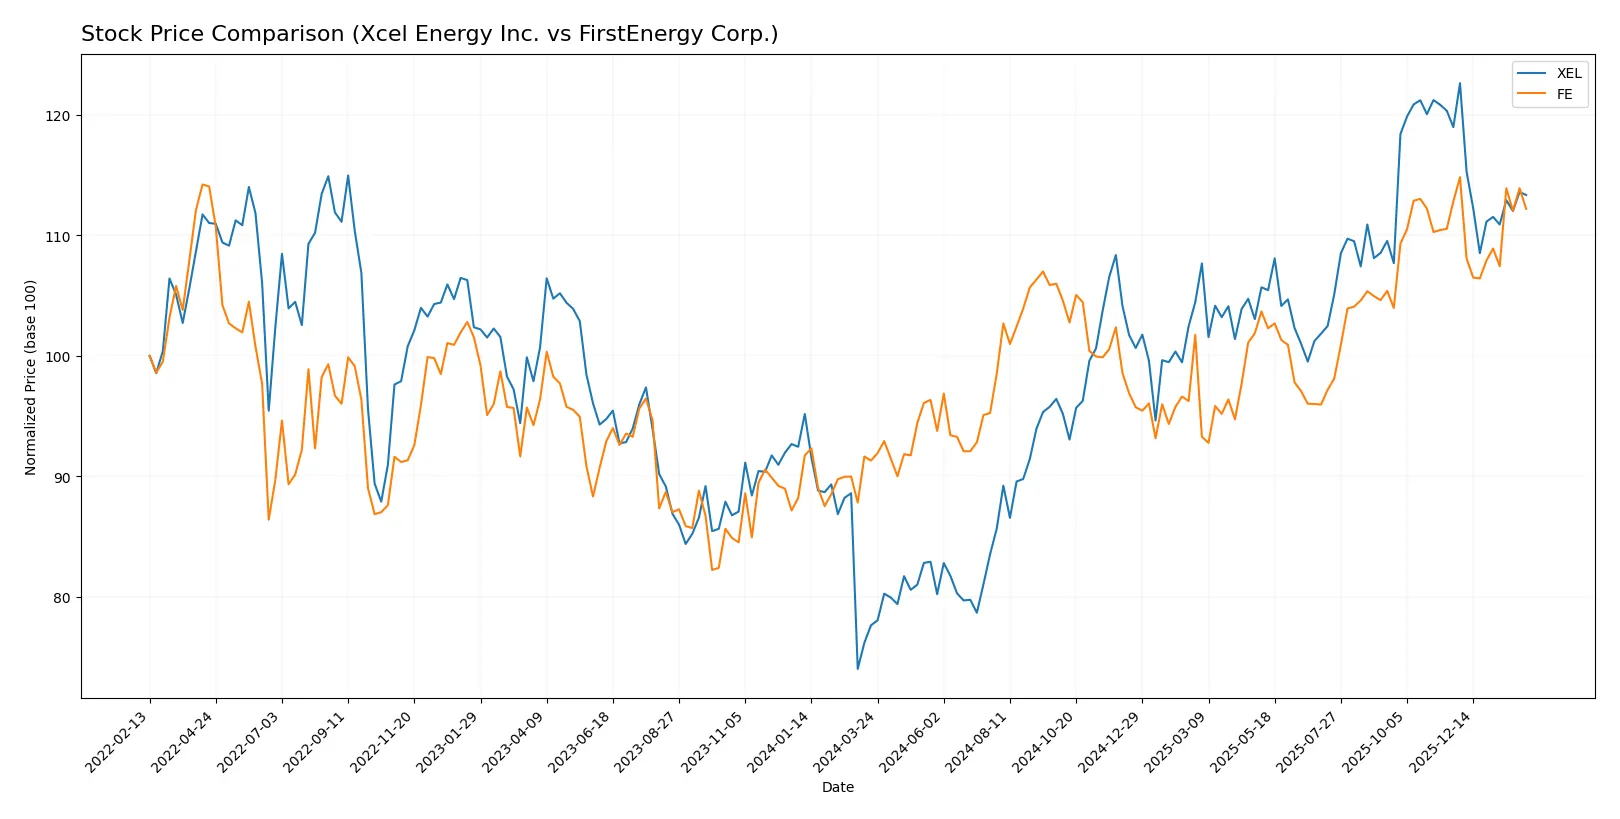
Xcel Energy Inc. and FirstEnergy Corp. have shown significant price movements over the past year, with both stocks trending upward despite recent short-term fluctuations.
Trend Comparison
Xcel Energy Inc. posted a strong 45.99% gain over the last 12 months, indicating a bullish trend with decelerating momentum and notable price volatility.
FirstEnergy Corp. gained 22.87% in the same period, reflecting a bullish trend with accelerating momentum and lower volatility relative to Xcel Energy.
Xcel Energy’s stock outperformed FirstEnergy’s by a wide margin over the past year in total returns.
Target Prices
Analysts present a clear consensus on target prices for both Xcel Energy Inc. and FirstEnergy Corp.
| Company | Target Low | Target High | Consensus |
|---|---|---|---|
| Xcel Energy Inc. | 81 | 95 | 88 |
| FirstEnergy Corp. | 46 | 54 | 49.5 |
Xcel Energy’s consensus target of 88 exceeds its current price of 75.9, implying upside potential. FirstEnergy’s target consensus of 49.5 is modestly above the current price of 46.63, suggesting limited near-term gains.

Don’t Let Luck Decide Your Entry Point
Optimize your entry points with our advanced ProRealTime indicators. You’ll get efficient buy signals with precise price targets for maximum performance. Start outperforming now!
How do institutions grade them?
This section compares recent institutional grades for Xcel Energy Inc. and FirstEnergy Corp.:
Xcel Energy Inc. Grades
The following table lists recent grades assigned by reputable institutions to Xcel Energy Inc.:
| Grading Company | Action | New Grade | Date |
|---|---|---|---|
| Barclays | Maintain | Overweight | 2026-01-15 |
| UBS | Maintain | Neutral | 2025-12-17 |
| Keybanc | Maintain | Overweight | 2025-12-12 |
| JP Morgan | Maintain | Overweight | 2025-12-11 |
| Barclays | Maintain | Overweight | 2025-11-05 |
| Citigroup | Maintain | Buy | 2025-11-03 |
| UBS | Maintain | Neutral | 2025-10-31 |
| Mizuho | Maintain | Outperform | 2025-10-27 |
| Jefferies | Maintain | Buy | 2025-10-16 |
| Keybanc | Maintain | Overweight | 2025-10-15 |
FirstEnergy Corp. Grades
Below is a summary of recent grades from recognized grading firms for FirstEnergy Corp.:
| Grading Company | Action | New Grade | Date |
|---|---|---|---|
| Wolfe Research | Upgrade | Outperform | 2026-01-27 |
| Barclays | Maintain | Overweight | 2026-01-22 |
| Wells Fargo | Maintain | Overweight | 2026-01-20 |
| UBS | Maintain | Neutral | 2025-12-17 |
| UBS | Maintain | Neutral | 2025-10-24 |
| Scotiabank | Maintain | Sector Outperform | 2025-10-24 |
| Mizuho | Maintain | Neutral | 2025-10-24 |
| Morgan Stanley | Maintain | Overweight | 2025-10-21 |
| Jefferies | Maintain | Hold | 2025-10-21 |
| Keybanc | Downgrade | Sector Weight | 2025-10-15 |
Which company has the best grades?
Xcel Energy consistently holds multiple Overweight and Buy ratings, showing steady institutional confidence. FirstEnergy features a recent upgrade to Outperform and several Overweight grades but includes a downgrade to Sector Weight. Investors may view Xcel’s stable high ratings as a sign of steady institutional support compared to FirstEnergy’s more mixed signals.
Risks specific to each company
The following categories identify the critical pressure points and systemic threats facing both firms in the 2026 market environment:
1. Market & Competition
Xcel Energy Inc. (XEL)
- Operates in diverse energy generation segments with renewable investments, facing moderate competition in regulated utility markets.
FirstEnergy Corp. (FE)
- Serves a larger customer base in several states with heavy coal dependency, facing pressure from cleaner energy competitors.
2. Capital Structure & Debt
Xcel Energy Inc. (XEL)
- Maintains favorable debt-to-equity ratios and moderate interest coverage, signaling a relatively stable capital structure.
FirstEnergy Corp. (FE)
- Exhibits high debt-to-equity ratio (1.95) and weaker liquidity ratios, increasing financial risk and refinancing challenges.
3. Stock Volatility
Xcel Energy Inc. (XEL)
- Beta of 0.48 indicates low stock volatility, reflecting defensive investor sentiment typical of regulated utilities.
FirstEnergy Corp. (FE)
- Beta at 0.62 shows moderate volatility; stock is more sensitive to market fluctuations than XEL.
4. Regulatory & Legal
Xcel Energy Inc. (XEL)
- Subject to evolving environmental regulations but benefits from diversified geographic footprint reducing regulatory risk concentration.
FirstEnergy Corp. (FE)
- Faces regulatory scrutiny due to legacy coal assets and recent legal challenges, increasing compliance costs.
5. Supply Chain & Operations
Xcel Energy Inc. (XEL)
- Investments in renewable infrastructure enhance supply chain resilience but fixed asset turnover is low, signaling operational inefficiencies.
FirstEnergy Corp. (FE)
- Operational footprint is large with extensive transmission lines, yet asset turnover metrics suggest underutilization of assets.
6. ESG & Climate Transition
Xcel Energy Inc. (XEL)
- Aggressively expanding renewable energy projects, positioning well for the energy transition and ESG compliance.
FirstEnergy Corp. (FE)
- Slower transition pace and reliance on fossil fuels create long-term ESG risks and potential stranded asset exposure.
7. Geopolitical Exposure
Xcel Energy Inc. (XEL)
- Primarily US-focused with stable regulatory environment, limiting geopolitical risks.
FirstEnergy Corp. (FE)
- Also US-centric but operates in states with varied energy policies, adding some regulatory unpredictability.
Which company shows a better risk-adjusted profile?
Xcel Energy’s strongest risk is operational inefficiency indicated by low asset turnover, while FirstEnergy’s greatest risk is its high leverage and associated financial distress signals. Xcel’s lower stock volatility and stronger capital structure suggest a better risk-adjusted profile. The notable trend is FirstEnergy’s Altman Z-score in the distress zone (0.8), which underscores its elevated bankruptcy risk, contrasting with Xcel’s more stable financial footing.
Final Verdict: Which stock to choose?
Xcel Energy Inc. (XEL) stands out as a cash-generating utility with a resilient revenue base. Its real strength lies in steady income and a reliable dividend yield near 4%. However, its leverage and liquidity metrics are points of vigilance that might pressure financial flexibility. It fits portfolios seeking steady income with moderate growth exposure.
FirstEnergy Corp. (FE) offers a strategic moat rooted in operational scale and EBITDA resilience, supported by a decent dividend yield above 4%. Relative to XEL, FE appears more leveraged and volatile, signaling a higher-risk profile. It suits investors looking for growth at a reasonable price with a tolerance for balance sheet risk.
If you prioritize income stability and moderate growth, XEL is the compelling choice due to its consistent cash flow and dividend safety. However, if you seek deeper value and can tolerate financial risk, FE offers better upside potential through operational leverage and growth opportunities. Both stocks warrant cautious evaluation given their financial gearing and sector challenges.
Disclaimer: Investment carries a risk of loss of initial capital. The past performance is not a reliable indicator of future results. Be sure to understand risks before making an investment decision.
Go Further
I encourage you to read the complete analyses of Xcel Energy Inc. and FirstEnergy Corp. to enhance your investment decisions: